gramme using multiple experiments is required to uncover important dimensions involved in any scientific field (Fisher, 1952). These multi- ple experiments may ...
MULTIPLE COMPARISON PROCEDURES WITHIN EXPERIMENTAL RESEARCH CAROLINE DAVIS and JOHN GAITO York University ABSTRACT A variety of multiple comparison procedures have become available over the past 60 years. The development of the most important of these procedures is traced since the 1920s. In this development, there appear to be two different approaches. One is that of the practicalresearch-oriented investigator, who emphasizes the importance of the Type II error and associated power (e.g., Fisher). The other is exemplified by mathematical statisticians, such as Tukey, Duncan, and Scheffe, who emphasize "pure" mathematical aspects and concentrate on the importance of controlling Type I errors. Two important issues or emphases are discussed: emphasis on Type I errors within single experiments vs. emphasis on Type II errors within multiple experiments. Finally, a set of recommendations are provided which emphasize the use of nonorthogonal F tests within a multiple-experiment research design.
When a researcher uses analysis of variance (ANOVA) procedures and there are more than two levels of the dimension of concern, the F test may not provide the information necessary for conclusions and inferences. In such a case, most researchers will stop if the F test results in a nonrejection of the null hypothesis (Ho). However, if rejection of Ho occurs, the researcher must resort to some type of multiple comparison procedure to gain more complete information concerning the number of population distributions involved in the dimension. The area of multiple comparison procedures seems to be one of the most confusing areas in psychological statistics, as has been noted by a number of authors (Cohen & Cohen, 1975; Gaito, 1978; Gaito & Nobrega, 1981; Games, 1971b; Keppel, 1982; Kirk, 1968; Miller, 1966; Petrinovich & Hardyck, 1969; Ryan, 1959). This confusion is illustrated also in the questions which students and faculty ask when seeking advice for their research efforts. There is a bewildering array of multiple comparison procedures, each one having features that are often only slightly different from the others. Thus, the person who has little or moderate experience in statistics can be confused by the number of these available. Table 1, from Gaito and Nobrega (1981), illustrates this confusion. The specific procedures Requests for reprints should be sent to Dr. John Gaito, Department of Psychology, York University, 4700 Keele St., Downsview, Ont. M3J 1P3.
Canadian Psychology / Psychologie Canadienne, 1984, 25: 1
which researchers have been using in recent years were determined by a review of papers in a specific psychological journal {Bulletin of the Psychonomic Society) over a period of two years (1978-1979). A total of 507 articles were examined. Of these, 88 had no statistical tests of Ho and eight did not specify the actual statistical procedures used. Of the remaining 411 papers, 314 used ANOVA (76.4%). In 15 of the other 97 papers, multiple t tests without a general F test were employed (3.6%). In the 314 papers using ANOVA, there were no multiple comparisons involved in 108. Of those with multiple contrasts (206), one-quarter of the researchers used ANOVA multiple F tests; another quarter used multiple t tests.1 The Newman-Keuls procedure was the choice of about 21% of the researchers. The remaining percentages were split amongst a number of procedures. One possible means of reducing this confusion is to consider the background in the de'Although / and F tests for a given set of data can provide the same probability values because the; and F distributions are related (viz., r = F for two-tailed r), usually these tests are different in two respects. Multiple / tests are pairwise comparisons which may make use of the data only for the two groups of concern in each test in obtaining the means and the estimate of error. Multiple F tests involve a subset of the main effect of concern; the error term is the same as that for the general F test, providing greater degrees of freedom for the denominator and usually leading to greater power. The comparisons can be pairwise and/or more complex comparisons involving the grouping of more than one group (with common characteristics) into a new overall group.
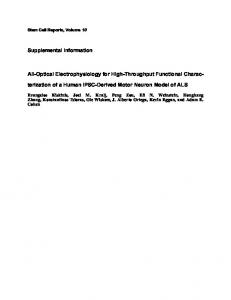
Canadian Psychology / Psychologie Canadienne, 1984, 25:1 TABLE 1 Multiple comparison procedures following general F test repotted in 206 articles Procedure
Frequency
Percentage
Multiple t Tests ANOVA Multiple F Tests Newman -Keuls Tukey Duncan Scheffe X" Mann-Whitney Dunnett Cicchetti Test Not Specified
51 50a 43 21 17 7 6 3 2 1 5
24.8 24.3 20.9 10.2 8.3 3.4 2.9 1.5 1.0 .5 2.4
Source. Modified from Gaito and Nobrega (1981). The articles were those in the Bulletin of the Psychonomic Society during 1978-79. 'Six of these were test of trends.
velopment of these procedures. We will not attempt the difficult task of discussing all multiple comparison procedures available. Miller (1977) cited 255 papers on this subject published between 1966 and 1976 alone. Many of these procedures have been covered elsewhere in excellent fashion (e.g., Games, 1971b; Miller, 1966). Our emphasis will be on two major approaches which underlie most of them. Their development involved at first an emphasis on research design in the writings and research of those such as Fisher and Snedecor, who advocated multiple experiments (e.g., Fisher, 1952) and were concerned with power in detecting scientific information. Then an approach concerned with statistical analysis of Type I error rates within single experiments became prominent. Representatives of this emphasis were Tukey, Duncan, and Scheffe. A recognition of these two approaches with their associated orientation should help to resolve some of the confusion present for researchers faced with choosing an appropriate method. Development of Multiple Comparison Procedures 1. Early Techniques a) The t test. Before ANOVA procedures were developed by Fisher, one method used in a multiple comparison situation was the t test. This procedure is a suitable one to use when only two means are to be contrasted (k = 2); however, when three or more means are in-
cluded in the experiment, the t distribution is no longer a suitable yardstick (Snedecor, 1946). If the t test is used, the effect is to produce a high Type I error rate overall. For example, if 10 means were involved and Ho were true, in the long run the difference between the largest and smallest means would be reported to be significant approximately 60% of the time (a set at .05 level). The corresponding significant results when k = 6 and 3 are 40% and 13%, respectively (Kirk, 1968). The major problem in using the / procedure in this fashion is that the value of the range increases at a greater rate than does the standard deviation, as n (size of sample) increases. Using Tippett and Pearson sample data drawn from a normal distribution, Snedecor (1946) showed that the mean of the ratio of the range to the standard deviation was 1.13 when n = 2; this value increased to 2.33, 3.08, and 4.50 when n was 5, 10, and 50 respectively. Likewise, the values exceeding the .05 probability level for n = 2, 5, 10, and 50 were 2.77, 3.87, 4.48, and 5.64 respectively. These data on the sampling distribution of the ratio — range/standard deviation (RSD ratio) — show that both the means and the value to exceed a specific probability level increase as n increases. It follows that as k increases beyond 2, users of multiple comparison procedures should be aware of the potentially greater increase of the range relative to the standard deviation. Furthermore, if one took the mean of each sample and looked at the sampling distribution of these k means (i.e., the sampling distribution of the means of the ratio of range to standard deviation; each mean is considered as a single observation), one would expect results similar to those for the sampling distribution of the ratio. In both cases, the mean of the distribution would increase as n (or k) increased, and the values exceeding specific probability levels (which would correspond to a levels) would increase also. An important point is that the values required to attain a specific probability level decrease as n increases with the t distribution, whereas the opposite result transpires with the sampling distribution of the ratio of the range to the standard deviation. The defect of the t procedure is that it considers the standard deviation in the formulation but does not allow for the greater increase of the range relative to the standard deviation. This fact increases the probability of a Type I error beyond the level expected.
Multiple Comparison Procedures b) Range considerations. One attempt to overcome the inadequacy of the t test was the use of the RSD ratio. This ratio has a history as long as that of ANOVA; its original application was inspired by practical industrial considerations. The earliest computational work on the RSD ratio was done by Tippett (1925), who provided tables for the mean range expressed in terms of the population standard deviation for samples of size 2 to 1,000. Soon afterwards, "Student" (1927) introduced the use of the RSD ratio as a practical and efficient method for increasing the accuracy of inference in routine chemical analyses carried out in industrial laboratories. The fundamental problem, he stated, was to get results as quickly and cheaply as possible. The analyst in these circumstances was required each day to make a number of similar routine analyses of some substances that were regularly checked for conformity to a standard, analyses which today we would call quality control testing. The intention was to obtain each day the truest value of that which was being measured, by obtaining a few observations and basing the measurement on the aggregate. The ratio was used as a comparison test for the n observations which made up the aggregate. Newman (1939) was the first to propose using the RSD ratio for the purpose of assessing differences between k means. He devised a sequential range test using the q statistic (i.e., the RSD ratio). If this value exceeds the critical tabled value for q, the most divergent treatment is dropped and the range of the remaining samples is tested. This process continues until the calculated q fails to reach significance. Newman not only calculated a number of percentage points for q, but provided examples illustrating how the range test could be used as an alternative to Fisher's z test. The important point in examining Newman's article is that he was not proposing the range test because he believed there was some intrinsic inaccuracy in the conventional ANOVA techniques, but rather because this test would be computationally quicker and therefore, in some instances, would have greater practical value, even though it would show a small loss in efficiency (compared to the z test). c) Fisher's contributions. In the first edition of his book Design of Experiments (1935), Fisher stated that if the general test of H(l is not rejected, the individual means will not usually
be considered further. However, if a significant value has been obtained, or if the experiment leaves any grounds for practical doubt, values may be compared by the t test. For this purpose he suggested using the mean square for error as an estimate of the variance, and the associated degrees of freedom (df). Other eariy statisticians were in agreement with Fisher on this method of assessing differences between means in ANOVA. Snedecor (1946), Lindquist (1953), and Cochran and Cox (1950) outlined an identical procedure. The Fisher procedure of using a general F test (which he called the z test), followed by a number of pairwise t determinations (simple comparisons), can be expanded to more complex contrasts (one or more means vs. one or more means) and become multiple F tests. This procedure is merely an expression of the capability of the ANOVA procedure to allow for the subdivision of the sum of squares and dftox a set of data (total, main effects, interactions, error) into subsets (Fisher, 1935). The subdivision can be in a routine fashion: e.g., the total SS in a twofactor design can be partitioned into sources due to A, B, AB interaction, and error. Alternatively, the subdivision can proceed in a nonroutine fashion so as to ensure components which are relevant to the empirical hypotheses or questions of concern. The subdivision can be orthogonal or nonorthogonal: for the former, the df and SS for each component sum to the df and SS of the source concerned with that dimension; for the latter these conditions do not prevail. Writers generally refer to the Fisher procedure as a two-stage test (Lindquist, 1953; Miller, 1966). Only if the overall Ho is rejected by the F test at the appropriate a level does one proceed to testing comparisons of interest using the t test. However, it is interesting to note that Fisher (1935) was more flexible: When the z-test does not demonstrate significant differentiation, much caution should be used before claiming significance for special comparisons. Comparisons which the experiment was designed to make may, of course, be made without hesitation, (p. 65)
The idea of making inflexible statistical rules relevant to the analysis of experimental data flies in the face of Fisher's research philosophy. His statistical viewpoint was eminently practical. The nature and diversity of his work at Rothamsted (1919-1933), as well as the fact
Canadian Psychology/Psychologie Canadienne, 1984, 25:1 rate within a set of comparisons (1978). We prefer the term "familywise" because it appears so frequently in the literature and because a number of procedures use it in the control of Type I errors. According to many, a most critical decision is the choice between the per comparison or familywise (experimentwise) unit in controlling Type I errors (Games, 1971b; Keppel, 1982; Ryan, 1959). 2. Later Developments Many of the multiple comparison procedures b) More recent range tests. It appears that have been developed to minimize Type I error the primary rationale for the development of rates. Thus, to appreciate fully the contributions some multiple comparison procedures was rein the development of these procedures over the lated to the idea that when k > 2, the observed past half-century, it is necessary to be aware of value of / for some differences will exceed the the various types of error rates. Ryan's (1959) tabled a level for t more frequently than a classification has been most influential. should allow, and that this will get worse as k increases (see section la above). The RSD ratio, a) Error rates: • Per comparison. This is the probability or a variation of this ratio, was prominent in that any comparison will incorrectly produce a these procedures. Tukey (1949) was one of the first who felt a rejection of Ho, and is equal to a. • Per experiment. This is the long-run aver- fundamental disagreement with the existing 2 age number of significant results which will be procedures. He was most concerned about the erroneous. For example, if a is .05 and there are possibility of obtaining false positives (Type I 100 comparisons, then we would, on average, errors) in statistical analyses and essentially pointed out, as Snedecor (1946) had done, the expect five erroneous results. • Experimentwise (familywise). This is the problems which are generated by the use of t error rate associated with all the comparisons tests. effected within an experiment and is defined as In 1953, Tukey developed a procedure to the probability of obtaining at least one erron- control the risk of false positives at a fixed a eous result. If the comparisons are independent level for all comparisons by use of the range and c comparisons are used, this Type I error statistic, q. This is the Wholly Significant Difrate is easy to determine. We are interested in ference (WSD) test.' Tukey proposed calcuthe probability of obtaining at least one signifi- lating a series of confidence statements for each cant comparison which is erroneous; the error difference between pairs of means using k and rate in a set of comparisons is [ 1 — (I — a)'], or the df associated with the mean square for error. approximately cot (for small values of c, 6 or For any interval not containing zero, the paired less). If the comparisons are not independent, mean values are inferred to be significantly the error rate within a set of comparisons is more different. difficult to determine exactly. It varies between Similarly, Keuls (1952) pointed out (using an [1 - (1 - a)], i.e., a, and[l - (1 - and Fn • • • form, they will stop the proliferation of articles or rather trivial variations on the same ideas, (p. 181) We agree and think that the multiple F approach combined with multiple experimentation is a simple solution to use. We hope that this article,
Canadian Psychology / Psychologie Canadienne, 1984, 25:1
12
and the three research and statistical recommendations (which are essentially those suggested
by Fisher many years ago), will be helpful in eliminating some of the existing confusion.
RESUME Les 60 dernieres annecs ont vu le developpement de plusieurs techniques statistiques a fins de comparaisons multiples. Cet article trace tout d'abord 1c developpement des plus importantes de ccs techniques depuis les annees 1920. Cet examen revcle deux approches differentes au developpement de ces techniques. La premiere dc ees approches reflete prrncipalement un interet pratique oriente vers des questions de recherche, met 1'emphase sur les errcurs de type II et sur la puissance du test, et est representec par les travaux dc Fisher. La deuxieme reflete plutot des intercts en mathematiques pures, met 1'emphase sur les erreurs de type I, et se manifesto principalcment dans les travaux dc statisticiens-mathematicians tels que Tukey, Duncan, et Scheffe. L'articlc discute aussi l'importance relative des erreurs de type I dans le cadre d'unc seule experience et des erreurs dc type II dans le cadre d'experiences multiples. En dernier lieu Particle presente un ensemble de recommandations qui preconisent l'usage d'analyses F nonorthogonales dans le cadre d'un plan a experiences multiples.
References Cochran, W. G., & Cox, G. M. Experimental designs. New York: Wiley, 1950. Cohen, J., & Cohen, P. Applied multiple regression! correlation analysis for the behavioral sciences. Hillsdale, N.J.: Lawrence Erlbaum Associates, 1975. Duncan, D. B. A significance test for differences between ranked treatments in an analysis of variance. Virginia Journal of Science, 1951,2, 171-189. Duncan, D. B. On the properties of (he multiple comparison test. Virginia Journal of Science, 1952, 3, 49-67. Duncan, D. B. Multiple range and multiple F tests. Biometrics, 1955, 11, 1-42. Fisher, R. A. The design of experiments. Edinburgh: Oliver and Boyd, 1935. Fisher, R. A. Sequential experimentation. Biometrics, 1952, 8, 183-187. Fisher, R. A. Statistical methods and scientific induction. Journal of the Royal Statistical Society, 1955, 17, 69-78. Fisher, R. A. The place of the design of experiments in the logic of scientific inference. Colloques internationaux du Centre national de la recherche scientifique (Paris), 1962, 110, 13-19. Fisher-Box, J. R. A. Fisher: Life of a scientist. New York: John Wiley and Sons, 1978. Gaito, J. Multiple comparisons within ANOVA using orthogonal and nonorthogonal components. Educational and Psychological Measurement, 1978, 38, 901-904. Gaito, } . , & Nobrega, J. A. A note on multiple comparisons as an ANOVA problem. Bulletin of the Psychonomic Society, 1981, 17, 169-170. Games, P. A. Inverse relation between the risks of Type I and Type II errors and suggestions for the unequal n case in multiple comparisons. Psychological Bulletin, 1971, 75, 97-102. (a) Games, P. A. Multiple comparison of means. American Educational Research Journal, 1971, 8, 531-565. (b) Games, P. A. A three factor model encompassing many possible statistical tests on independent groups. Psychological Bulletin, 1978, 85, 168-182. (a) Games, P. A. A four-factor structure for parametric test on independent groups. Psychological Bulletin, 1978, 85, 661-672. (b)
Kendall, M. G. The history and future of statistics. In T. A. Bancroft (Ed.), Statistical papers in honor of George W. Snedecor. Ames: Iowa State University Press, 1972. Keppel, G. Design and analysis: A researcher s handbook. Englewood Cliffs, N.J.: Prentice-Hall, 1982. Keuls, M. The use of the studentized range in connection with an analysis of variance. Euphvtica, 1952, /, 112-122. Kirk, R. E. Experimental design: Procedures for the behavioral sciences. Belmont, Calif: Brooks/ Cole, 1968. Lindquist, E. F. Design and analysis of experiments in psychology and education. Cambridge, Mass.: The Riverside Press, 1953. Lush, J. L. Early statistics at Iowa State College. In T. A. Bancroft (Ed.), Statistical papers in honor of George W. Snedecor. Ames: Iowa State University Press, 1972. Miller. R. G., Jr. Simultaneous statistical inference. New York: McGraw-Hill, 1966. Miller, R. G., Jr. Developments in multiple comparisons 1966-1976. Journal of American Statistical Association, 1977, 72, 779-788. Newman, D. The distribution of range in samples from a normal population, expressed in terms of an independent estimate of standard deviation. Biometrika, 1939, 31, 20-30. Pearson, E. S., & Hartley, H. O. Tables of the probability integral of the studentized range. Biometrika, 1943, 33, 89-94. Petrinovich, L. F., & Hardyck, C. D. Error rates for multiple comparison methods: Some evidence concerning the frequency of erroneous conclusions. Psychological Bulletin, 1969, 71, 43-54. Ramsey, P. H. Power of univariate pairwise multiple comparison procedures. Psychological Bulletin, 1981, 90, 352-366. Ryan, T. A. Multiple comparisons in psychological research. Psychological Bulletin, 1959, 56, 26-47. Scheffe, H. A method for judging all contrasts in the analysis of variance. Biometrika, 1953, 40, 87-104. Snedecor, G. W. Statistical methods. Ames: Iowa State College Press, 1946. "Student." Errors of routine analysis. Biometrika, 1927, 19, 151-164. Tippett, L. H. C. On the extreme individuals and the range of samples taken from a normal population. Biometrika, 1925, 17, 364-387.
Multiple Comparison Procedures Tukey, J. W. Comparing individual means in the analysis of variance. Biometrics, 1949, 5, 99-114. Tukey, J. W. The problem of multiple comparisons. Prince-
13 ton, N.J.: Princeton University, 1953. (ditto) Tukey, J. W. Exploratory data analysis. Reading Mass.: Addison- Wesley, 1977.