Univ. of Texas Pan-American. Edinburg, Texas, USA. Brent Wilson. Amsted Rail Company, Inc. Granite City, Illinois, USA. Allen J. Fuller. Amsted Rail Brenco.
Proceedings of the 2015 Joint Rail Conference JRC2015 March 23-26, 2015, San Jose, CA, USA
JRC2015-5785 MULTIPLE FREQUENCY ULTRASONIC DETECTION OF SUBSURFACE NEAR-RACE INCLUSIONS FOR IMPROVED FATIGUE LIFE PERFORMANCE Ping Hu Joseph A. Turner Mechanical and Materials Engineering University of Nebraska-Lincoln Lincoln, Nebraska, USA
Constantine Tarawneh Mechanical Engineering Dept. Univ. of Texas Pan-American Edinburg, Texas, USA
Brent Wilson Amsted Rail Company, Inc. Granite City, Illinois, USA
Allen J. Fuller Amsted Rail Brenco Petersburg, VA, USA
ABSTRACT The importance of steel cleanliness for the performance of tapered roller bearings has been clearly established and has led to on-going improvements in steel production methods. The presence of non-metallic impurities within the steel can result in hard/brittle inclusions that may serve as initiation sites for damage due to sub-surface rolling contact fatigue (RCF) if the inclusions lie within the near-race of the bearing components due to the high mechanical stress present. Current inspection standards define steel cleanliness with respect to bulk inclusion morphology, which limits inspection to a small area that may or may not be representative of the entire steel heat. In this presentation, ultrasonic surface wave methods are described for detecting subsurface inclusions directly on finished bearing inner and outer rings. We expand on our previous work to exploit the different inspection depths that can be achieved with different measurement frequencies. The impact of the different inspection depths is quantified through simulated service life testing with heavy axle loading conditions. For this study, bearing components were first subjected to ultrasonic surface wave testing at three different frequencies to identify near-race inclusions. The simulated service life testing was then used to assess the onset and propagation of RCF failure. RCF spall initiations correlated highly with the positions identified by the ultrasonic inspections suggesting that this approach has a predictive potential. However, additional research is needed to establish the specific criteria needed for such predictions with respect to the inclusion location along the race, the depth from the race surface, the inclusion morphology and the inclusion mechanical properties. This work is anticipated to improve the understanding of RCF damage initiation which will lead a higher level of safety for railroad operations.
INTRODUCTION With the increase in service loads of railcars aimed to improve the efficiency of the transport industry, the desired performance of railway tapered roller bearing increases continuously. One of the most important aspects related to the performance is bearing steel cleanliness, which has been clearly established [1-4]. Bearing steel cleanliness has led to on-going improvements in steel production methods both in design and quality control, such as new standards to measure the nonmetallic impurity content in a particular heat of a steel supplier [3-5]. The presence of non-metallic impurities within the steel can result in hard/brittle inclusions that may serve as initiation sites for damage due to sub-surface rolling contact fatigue (RCF) if the inclusions lie within the near-race of the bearing components due to the high mechanical stress present [3,4, 6]. The critical region of bearing components has been estimated as several hundred micrometers. Current inspection standards for inspection in the critical region of rail components include methods based on bulk inclusion morphology, BS-EN 12080 [7], bulk material ultrasonic scanning, and so on. Even if the exact chemical composition of the inclusion is known, the existing inspection standards with respect to bulk inclusion morphology are limited to a small inspection area that may or may not be representative of the entire steel heat. In BS-EN 12080, an ultrasonic longitudinal wave is generated with an incident normal transducer configuration and the reduced echo reflected from the back surface of the sample is monitored. The size of the drilled flat bottomed hole (FBH) on the surface of standard ranges from 0.5 mm to 1 mm in both diameter and depth, which is much larger than the depth of the critical region such that it is reasonable to question if important inclusions are missed. Bulk
1
Copyright © 2015 by ASME
ULTR RASONIC EX XPERIMNETA AL ORIENTAT TION The aiim of the ultraasonic surface wave inspection technique is i to deetect subsurfacce inclusions at critical rregions of the racew ways. In this article, a set number of aassembly-ready y bearinng outer rings ((cups) were sccanned ultrasonnically to verify fy the feaasibility of thee theoretical assumption. In oorder to have an n accuraate understandding of the experimental results, it is necesssary to have a uniform set of ultrasonic experimentaal orientaations. W When the cup iss oriented withh the part identtification letterrs right-sside-up, the rrace above thhe letters is ddenoted as the “inboaard” race, while the race bellow the part ID D is denoted as a the “ooutboard” racee as shown inn Figure 2 (a).. The two race surfacces are separatted by a flat pportion as show wn in Figure 2 (b). T The cup was sccanned in a coounterclockwisse direction fo or each rrace. The rotatiion angle is m marked as , succh that the starrt point bbegins just beffore part identiification engraaving. Once one race w was scanned, tthe cup was tuurned over andd the other race was sccanned. The oorigin coordinaate of z is justt above the flaat portioon, and the endd point of the z location is the start of the underccut. Therefore, the z locationn encompassess only the racee. The uupward axial ddirection is thhe positive z ddirection in the scanniing procedure for both the inbboard and outbboard races.
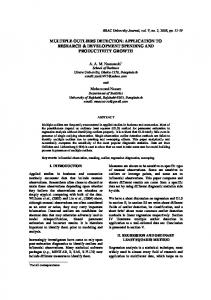
materrial ultrasonic scanning is an n efficient metthod to estimatte the qquality and cleeanliness of stteels but it faiils to guaranteee steel cleanliness in the t critical region as identifieed in the BS-EN N ment study usin ng the Hertziaan 120800. Furthermoree, a finite elem contaact stress mod deling approach showed th hat the criticaal regionn was approx ximately 200 m away fro om the contacct surfacce of bearing components [6]. Alternativees to inspectio on withinn this calculaated depth arre needed to provide morre inform mation about potential p impurrities. In this arrticle, ultrasoniic surfacce wave inspeection methodss are applied to achieve this goal for detecting subsurface in nclusions direcctly on finisheed bearinng inner and outer o rings. Th he increased in nspection depth hs are obbtained through h different meaasurement freq quencies. RFACE WAVE ES AT MULTIP PLE FREQUE ENCIES SUR S Surface waves are generated d when the incidence angle of o the trransmitted sou und wave is sllightly larger than t the secon nd criticaal angle of the sound wave for the material undeer inspection. A surfface wave is a combinatio on of materiaal b longitudin nal and transv verse type. Th he displaacements of both most significant feaature of a surfa face wave is th hat it propagatees gh a depth of o alongg the free surrface and atteenuates throug approoximately one acoustic wavellength [7]. Forr a steel samplee, a 15 M MHz surface wave w can penettrate around 20 00 m below th he surfacce, while 10 0 and 7.5 MHz surfacee waves hav ve corressponding insp pection depth hs of 300 and 400 m m, respectively. This concept c is show wn schematicaally in Figure 1. he inspection volume of a lower centeer It is clear that th frequuency is larger.
hematic diagra am of an ultrrasonic surfacce Figurre 1: The sch wavee scan using multiple m frequeencies on a steeel sample.
ntation of the rrace surfaces (outboard and d Figurre 2: (a) Orien inboaard) and their respective positive rotatioons, (b) Origin n coord dinate of z and d the correspoonding positivve direction for the booth inboard an nd outboard rraces.
2
Copyright © 2015 by ASME
ULTR RASONIC EX XPERIMENTA AL RESULTS S T The ultrasonic experimental results are sttored as C-scaan imagees, in which the waveform m signals are obtained from m locatiions on each sample. Each h value in thee C-scan imag ge corressponds to the maximum refllection amplitu ude of the gateed signaal of the indiv vidual waveforrm. In these experiments, th he gate iis placed just after a the initial scattering from m the surface of o the ssample by thee reason of surface s roughn ness and graiin scatteering. A An example off ultrasonic C--scan image frrom the surfacce wave scanning pro ocedure using three center frequencies, fr i.ee., M is shown n in Figure 3((a)-(c). In thesse 15, 110, and 7.5 MHz, o interest (0-210 degrees) haas been reduceed figurees, the range of from the original C-scan C image (0-360 ( degreess) for clarity. A nclusion signals threshhold has been applied to disstinguish the in from the grain scaattering. One inclusion i can be observed in i M while thrree inclusions found both in i Figurre 3(a) (15 MHz) Figurres 3 (b) (10 MHz) and (cc) (7.5 MHz).. The inclusio on locatiions and correesponding amp plitudes are lissted in Table 1. Compparing the images Figure 3 (a), (b), and d (c), the sam me inclussions are identtified although h slight differen nces in positio on and ssize are recogn nized due to po ositioning unceertainty and th he differrence of inspeection frequenccy. The consistency betweeen these results is a po ositive indicatiion regarding the presence of o he different insspection depth hs, which can be b the innclusions for th verifiied from the am mplitude in Tab ble 1.
Taable 1: Locatioons of high am mplitude indicaations from ultrassonic surface w wave scanningg. Freqquency
15 MHz
10 MHz
7.5 MHz
z (mm)
Amp. (%)
A
79.3588
15.675
30.469
B
13.3799
38.745
94.531
C
206.247
14.689
32.031
A
77.55
16.221
82.813
B
11.5633
39.73
100
C
204.769
16.227
82.031
A
77.6099
15.716
100
B
11.2333
39.84
100
C
204.447
15.717
98.438
The iinclusion founnd using all three frequenncies is in the detecttion range of 15 MHz, and thhe remaining tw wo appear to be close to the inspecction limitationn of 10 MHz.. For clarity, a matic diagram oof the suspecteed inclusion loocations for thiis schem exampple is shown inn Figure 4.
0 (a) 40 z (mm)
(Deg))
Locaation
30 0 20 0 10 0 0 0
50 0
100
150
200
100
150
200
o Figurre 4: The scheematic diagram of presumeed locations of hs in the samp ple. inclussions with the relative depth
200
ULATED SER RVICE LIFE TESTING RES SULTS SIMU F our cups witth high ampplitude subsurrface near-race o inclussions were sellected using thhis method annd subjected to mage initiation n simulaated service liife testing to verify the dam potenttial for such innclusions. The simulated servvice life testing g used ffour complete bbearings, whicch includes fouur selected cups and eiight clean connes whose nearr-race regions were inspected d and ffound to be ffree from anyy detectable inclusions. The assum mption behind the testing iss that a subsuurface near-race inclussion would ultiimately cause a spall to apppear on the cup p n. surfacce in the detectted area withinn 250,000 milees of operation
eg) (de
z (mm)
(b) 40 0 30 0 20 0 10 0 0 0
50 0
eg) (de
z (mm)
(c) 40 0 30 0 20 0 10 0 0 0
50 0
100
eg) (de
150
Figurre 3: C-Scan images from a cup using three differen nt centeer frequenciess, (a) one incllusion found using u 15 MHzz, (b) th hree inclusion n found using 10 MHz, (c) three inclusio on found d using 7.5 MH Hz.
3
Copyright © 2015 by ASME
The sspall can be deetected by the irregular i signatures of bearin ng operaations either fro om the temperrature or vibrattion [1-2]. Oncce such signatures aree detected, thee test is paused such that th he bearinngs can be insp pected visually y. T The ultrasonicc experimentall results of one o cup in th he simullated service liife testing are shown s in Figurre 5. Here, onlly the reesult of 15 MH Hz center freq quency is displayed in Figurre 5(a) because the locations l for these two incclusions on th he outbooard race are identical for all three centter frequencies. Howeever, the only subsurface inclusion found on the inboarrd race iis shown in Figure 5(b), wh hich was identtified only from m the 77.5 MHz insp pection. Furtheermore, detailled informatio on aboutt the inclusion locations and corresponding g amplitudes arre givenn in Table 2.
the suuccessive tearrdowns shows the destructiive potential of o such inclusions to lead ultimately to bearing failure during g servicce life. T The simulated sservice life testt was terminatted after 77,506 miles of operation ddue to the highh vibration noisse which began n g. to affeect the signalss from neighbooring bearings in the test rig The fiinal state of thee inside of the cup is shown iin Figure 7. The two loocations of spaalls are identicaal to the positioons found from m the ulttrasonic surfacce wave inspecttions.
z (mm)
(a) 40 4
2 20 0 0
z (mm)
(b)
n on an outbooard race (cup p) Figurre 6: The spalll deterioration 9 at loccation F, (a) mileage = 511,420 miles, aarea = 112.709 mm2, (b) mileage = 63,678 miless, area = 677..418 mm2, and d m 2. (c) miileage = 77,5066 miles, area = 2850.317 mm
D, E
90
18 80
(deg)
270 0
360
4 40
F
2 20
0
90
180
(deg)
27 70
360
Figurre 5: C-Scan n image from m the cup in the simulateed servicce life testing g, (a) two inclusions found using 15 MH Hz on th he outboard ra ace, (b) the on nly inclusion found f using 7..5 MHzz on the inboarrd race. Taable 2: Locatio ons of high am mplitude indiccations from u ultrasonic scan ns for the simu ulated service life testing. Freequency 155 MHz 7.55 MHz
g) (Deg
z (mm)
Amp. (%)
D
253.03 34
7.205
100
E
261.74 46
7.228
79.688
F
103.93 34
42.719
91.406
Locaation
urfaces of the Figurre 7: Spalls tthat developeed on the su board races (cup) at loccations which h outbooard and inb coinciide with thee subsurface inclusion sittes E and F, F respecctively.
T The initiated spall s was foun nd at location F after 51,42 20 miless of operation, and the area of o the spall was 112.709 mm m2. The ccorresponding deterioration of o this spall is shown s in Figurre 6. Affter an addition nal 26,086 milees of operation n, the spall grew w twentty-five times in i size with a comparison between b Figurre 6(a) aand Figure 6(cc). The develop pment of the sp pall observed in i
CLUSION CONC W With the verificcation of simuulated service llife testing, the ultrasoonic surface w wave results arre identical to the RCF spalll initiatiions, highlighhting the prredictive poteential of thiis approaach. More research is needeed to understannd why certain n
4
Copyright © 2015 by ASME
inclusions that are detected (location F in Figure 7) lead to a spall while other inclusions (e.g., location D) do not. Such differences are thought to be due to the intrinsic characteristics of the inclusion, which is one of the topics of future work. Therefore, future research will focus on the establishment of specific criteria needed for such predictions with respect to the inclusion location along the race, the depth from the race surface, the inclusion morphology and the inclusion mechanical properties. Although the work here is focused on tapered roller bearings, it is anticipated that this study can improve the understanding of RCF damage initiation for other applications within railroad operation such as wheel-rail contact.
[6] Dick, M. G. and Wilson, B. M., “Roller Loads and Hertzian Contact Stress Modeling in Railcar Bearings Using Finite Element Analysis,” Proceedings of the ASME RTD/TTCI Roller and Journal Bearing Symposium, Chicago, IL, Sept. 11–12, 2007. [7] L. W. Schmerr Jr., S.-J. Song, “Ultrasonic Nondestructive Evaluation Systems (Springer, NY, 2007),” pp. 537-539. [8] EN 12080 Annex A, 2010, “Railway Applications— Axleboxes—Rolling AQ3 Bearings,” European Committee for Standardization.
ACKNOWLEDGMENTS Amsted Rail, Inc. is gratefully acknowledged for their support of this research. REFERENCES [1] Tarawneh, C., W., Kypuros J. A., Fuentes, A. A., Wilson, B. M., Gonzalez, B. A., Rodriguez, G., and Maldonado, R. K., “Vibration Signatures of Temperature Trended Bearings in Field and Laboratory Testing,” ASME 2009 Rail Transportation Division Fall Technical Conference on October 19-21, 2009 in Fort Worth, TX; RTDF2009-18038, ASTM International. [2] Tarawneh, C., Koester, L., Fuller, A. J., Wilson, B. M., and Turner, J. A., “Service Life Testing of Components with Defects in the Rolling Contact Fatigue Zone,” Bearing Steel: Advances in Rolling Contact Fatigue Strength Testing and Related Substitute Technologies on November 17-18, 2011 in Tampa, FL; STP 1548, J. M. Beswick, Ed., ASTM International. [3] Koester, L., Turner, J. A., Zuhlke, C., Alexander, D., Wilson, B. M., Tarawneh, C., and Fuller, A. J., “Near-Race Ultrasonic Inspection of Tapered Roller Bearing Components for Non-Metallic Defects,” ASME 2009 Rail Transportation Division Fall Technical Conference on October 16-18, 2012 in Omaha, NE; RTDF2012-9437, ASTM International. [4] Koester, L., Zuhlke, C., Alexander, D., Fuller, A., Wilson, B. M., Turner, J. A., “Near-race Ultrasonic Detection of Subsurface Defects in Bearing Rings,” Bearing Steel: Advances in Rolling Contact Fatigue Strength Testing and Related Substitute Technologies on November 17-18, 2011 in Tampa, FL; STP 1548, J. M. Beswick, Ed., ASTM International. [5] Nielsen, C., 2007, “Bearing Steel Fatigue: Qualifying Inclusion Effects Using Ultrasound and Extreme Value Statistics,” M.S. thesis, University of Nebraska-Lincoln, Lincoln, NE.
5
Copyright © 2015 by ASME