Big-data Clinical Trial Column
Page 1 of 5
Multiple imputation with multivariate imputation by chained equation (MICE) package Zhongheng Zhang Department of Critical Care Medicine, Jinhua Municipal Central Hospital, Jinhua Hospital of Zhejiang University, Jinhua 321000, China Correspondence to: Zhongheng Zhang, MMed. 351#, Mingyue Road, Jinhua 321000, China. Email:
[email protected].
Author’s introduction: Zhongheng Zhang, MMed. Department of Critical Care Medicine, Jinhua Municipal Central Hospital, Jinhua Hospital of Zhejiang University. Dr. Zhongheng Zhang is a fellow physician of the Jinhua Municipal Central Hospital. He graduated from School of Medicine, Zhejiang University in 2009, receiving Master Degree. He has published more than 35 academic papers (science citation indexed) that have been cited for over 200 times. He has been appointed as reviewer for 10 journals, including Journal of Cardiovascular Medicine, Hemodialysis International, Journal of Translational Medicine, Critical Care, International Journal of Clinical Practice, Journal of Critical Care. His major research interests include hemodynamic monitoring in sepsis and septic shock, delirium, and outcome study for critically ill patients. He is experienced in data management and statistical analysis by using R and STATA, big data exploration, systematic review and meta-analysis.
Zhongheng Zhang, MMed.
Abstract: Multiple imputation (MI) is an advanced technique for handing missing values. It is superior to single imputation in that it takes into account uncertainty in missing value imputation. However, MI is underutilized in medical literature due to lack of familiarity and computational challenges. The article provides a step-by-step approach to perform MI by using R multivariate imputation by chained equation (MICE) package. The procedure firstly imputed m sets of complete dataset by calling mice() function. Then statistical analysis such as univariate analysis and regression model can be performed within each dataset by calling with() function. This function sets the environment for statistical analysis. Lastly, the results obtained from each analysis are combined by using pool() function. Keywords: Big-data clinical trial; multiple imputation (MI); multivariate imputation by chained equation (MICE) package; R; imputed complete dataset Submitted Nov 05, 2015. Accepted for publication Dec 15, 2015. doi: 10.3978/j.issn.2305-5839.2015.12.63 View this article at: http://dx.doi.org/10.3978/j.issn.2305-5839.2015.12.63
© Annals of Translational Medicine. All rights reserved.
www.atmjournal.org
Ann Transl Med 2016;4(2):30
Zhang. Multiple imputation with MICE package
Page 2 of 5
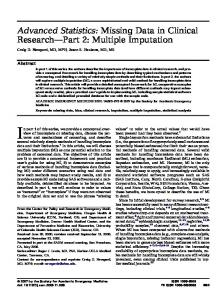
Introduction “I do not know what I may appear to the world, but to myself I seem to have been only like a boy playing on the seashore, and diverting myself in now and then finding a smoother pebble or a prettier shell than ordinary, whilst the great ocean of truth lay all undiscovered before me.”—Isaac Newton. Multiple imputation (MI) is an advanced method in handling missing values. In contrast to single imputation, MI creates a number of datasets (denoted by m) by imputing missing values. That is, one missing value in original dataset is replaced by m plausible imputed values. These values take imputation uncertainty into consideration. Statistics of interest are estimated from each dataset and then combined into a final one. While single imputation has been criticized for its bias (e.g., overestimation of precision) and ignorance of uncertainty about estimation of missing values, MI, if performed properly can give an accurate estimate of real result (1). However, MI is underutilized in medical literature due to lack of familiarity and computational challenges. To make clinicians become familiar to MI, the present article aims to provide a step-by-step tutorial to the use of R package to conduct MI for missing values. Before that, a brief description of basic ideas behind MI will be given. Fundamentals of multiple imputation (MI) MI procedure replaces each missing value with multiple possible values. Compared with single imputation, this procedure takes into account uncertainty behind missing value estimation. The procedure produces several datasets, from which parameters of interest can be estimated. For example, if you are interested in coefficient for a covariate in multivariable model, the coefficients will be estimated from each dataset resulting in m number of coefficients. Finally, these coefficients are combined to give an estimate of the coefficient, taking into account uncertainty in estimation of missing values. The variance of coefficient estimated in this way is less likely to be underestimated as compared to single imputation. The imputation procedure carried out by first creating a prediction model for target variable with missing values from all other variables (Figure 1). In other words, the variable under imputation is the response variable and other relevant variables are independent variables. By default, predictive mean matching is used for continuous variables and logistic regression is used for dichotomous variable (2). Variables included into imputation are advised to be (I)
© Annals of Translational Medicine. All rights reserved.
Mice() Data frame with missing values
Pool()
With()
Imputed datasets
Final results
Results of statistical analysis
Figure 1 Schematic illustration of how MICE package works with data frame with missing values. Note the sequential use of mice(), with() and pool() functions.
predictive of missingness, (II) associated with the variable being imputed and (III) the outcome variable of your analysis (3,4). Working example To establish a working example for illustration, I borrow the scenario from one of my recent research that investigated the relationship between lactate and mortality outcome (5). While the research was conducted by using MIMIC-II database involving >30,000 patients (6), the working example will artificially generate 150 patients with simulation. There are roughly 30% missing values in the lac variable. > set.seed(12365) > sex sex[sex==1] sex[sex==0] set.seed(123567) > sex.miss.tag sex.miss set.seed(124564) > map map lac lac set.seed(134567)
www.atmjournal.org
Ann Transl Med 2016;4(2):30
Annals of Translational Medicine, Vol 4, No 2 January 2016 > lac.miss.tag lac.miss set.seed(111) > mort mort[mort==1] mort[mort==0] data library(Rcpp) #Rcpp package is mandatory > library(mice) > imp predmatrix predmatrix[c(2,4),] predmatrix[1,4] predmatrix [1,]
[,1]
[,2]
[,3]
[,4]
0
1
1
0
> imp
[2,]
0
0
0
0
Multiply imputed data set
[3,]
1
1
0
1
Call:
[4,]
0
0
0
0
mice(data = data, seed = 12345)
Imputations for a particular variable can be viewed in the following way. I use the head() function to save space (otherwise there will be 47 rows).
Number of multiple imputations: 5 Missing cells per column: sex.miss
map
lac.miss
mort
43
0
47
0
Imputation methods: sex.miss
map
lac.miss
mort
"logreg"
""
"pmm"
""
> head(imp$imp$lac.miss)
VisitSequence: sex.miss
lac.miss
1
3
PredictorMatrix: sex.miss
map
lac.miss
mort
sex.miss
0
1
1
1
map
0
0
0
0
lac.miss
1
1
0
1
mort
0
0
0
0
Random generator seed value: 12345
© Annals of Translational Medicine. All rights reserved.
1
2
3
4
5
2
3.9
2.3
3.0
1.9
2.7
5
3.6
1.8
3.5
4.0
3.3
8
1.0
1.9
2.1
1.0
0.5
11
1.1
1.8
0.1
0.6
0.1
17
2.9
3.7
1.9
2.2
0.4
20
3.8
3.8
2.5
4.0
4.2
In this matrix you can have a look at what mice() has imputed in each imputation. Recall that you have not specified the number of imputations and the default is 5.
www.atmjournal.org
Ann Transl Med 2016;4(2):30
Zhang. Multiple imputation with MICE package
Page 4 of 5
The first row indicates the row number of missing values in original dataset. If the matrix contains negative values, you may need to review the imputation method. You can also view each of the five complete dataset by following code. Again head() is used to save space. The argument action=4 specifies that the forth imputation is visited. > head(complete(imp, action=4))
within data environment instead of the user’s workplace. In our example, the t.test() function takes place within imputed complete datasets contained in the object imp. Otherwise, if with() is not called the t.test() will use original incomplete dataset existing in the workplace. The above output only displays analysis of the first imputed dataset and other four are omitted to save space. Nest I want to find out variables associated with mortality outcome by using logistic regression model. Note that logistic regression model is specified glm() function.
sex.miss
map
lac.miss
mort
1
male
126
0.2
alive
2
male
55
1.9
alive
3
female
89
0.6
alive
> fit fit
5
female
63
4.0
alive
call :
6
female
48
2.5
alive
with.mids(data = imp, expr = glm(mort ~ sex.miss + map + lac.miss, family = binomial))
Statistical analysis after imputation Now that you have five complete datasets at hand, conventional statistical analysis can be performed. In observational studies, the first step is usually to perform univariate analysis to find out which variable is associated with outcome of interest. The following example illustrates how to perform t test and multivariable regression analysis.
call1 : mice(data = data, seed = 12345) nmis : sex.miss
map
lac.miss
mort
43
0
47
0
analyses : [[1]] Call: glm(formula = mort ~ sex.miss + map + lac.miss, family = binomial) Coefficients:
> ttest ttest
0.99982
-0.30750
-0.01772
call :
Degrees of Freedom: 149 Total (i.e. Null); 146 Residual
with.mids(data = imp, expr = t.test(lac.miss ~ mort))
Null Deviance:
call1 :
Residual Deviance: 162.1
165.3
mice(data = data, seed = 12345)
[…output deleted to save space…]
AIC: 170.1
nmis : sex.miss
map
lac.miss
mort
43
0
47
0
analyses : [[1]]
Welch Two Sample t-test
data: lac.miss by mort t = 0.61547, df = 59.653, p-value = 0.5406 alternative hypothesis: true difference in means is not equal to 0 95 percent confidence interval: -0.3059795 0.5779093
Now the list object fit contains results from five logistic regression analyses (note that there are five sets of logistic regression, and here I showed analysis from the first imputed dataset) and relevant information. In the first estimation, the coefficient for lac.miss is −0.33 for each one unit increase in lac.miss. Note there is a “2” behind sex.miss, which indicates level 1 is used as reference (recall that R treats sex.miss as factor variable). This is not the end of the story and you need to combine the five sets of results into one.
sample estimates: mean in group alive
> pooled round(summary(pooled),2) […output deleted to save space…]
est
se
t
df
Pr(>|t|) Lo 95 Hi 95 nmis fmi
(Intercept) 0.22 1.67 0.13 20.57 0.90
The generic form of with() function is with(data, expr). It allows an R expression to be executed in an environment from data. The assignments within expression take place
© Annals of Translational Medicine. All rights reserved.
-3.27 3.70 NA
lambda
0.44 0.39
sex.miss2 0.01 0.51 0.01 18.45 0.99
-1.07 1.08 NA
0.47 0.41
map
-0.01 0.01 -0.89 35.14 0.38
-0.04 0.02 0
0.31 0.27
lac.miss
-0.22 0.33 -0.69 16.09 0.50
-0.91 0.47 47
0.50 0.45
www.atmjournal.org
Ann Transl Med 2016;4(2):30
Annals of Translational Medicine, Vol 4, No 2 January 2016
The pool() function is shipped with MICE package. It combines the results of m imputed complete data analysis. The variance is computed by taking into account the uncertainty in missing value imputation. Summary This article introduces how to perform MI by using MICE package. The idea of MI is to take into account uncertainty in predicting missing values by creating multiple complete datasets. There are varieties of imputation methods and users can choose the most appropriate one. In practice, the default setting is usually satisfactory. The with() function sets the environment for the expression to be performed, and the argument for the environment is the imputed datasets. Varieties of expressions can be executed including univariate analysis and multivariable regression models. Next, the pool() function is employed to combine results from analysis of each imputed datasets. The variance obtained from pool() function takes uncertainty of missing values into account. Acknowledgements None.
Page 5 of 5
Footnote Conflicts of Interest: The author has no conflicts of interest to declare. References 1. Donders AR, van der Heijden GJ, Stijnen T, et al. Review: a gentle introduction to imputation of missing values. J Clin Epidemiol 2006;59:1087-91. 2. Morris TP, White IR, Royston P. Tuning multiple imputation by predictive mean matching and local residual draws. BMC Med Res Methodol 2014;14:75. 3. White IR, Royston P, Wood AM. Multiple imputation using chained equations: Issues and guidance for practice. Stat Med 2011;30:377-99. 4. Moons KG, Donders RA, Stijnen T, et al. Using the outcome for imputation of missing predictor values was preferred. J Clin Epidemiol 2006;59:1092-101. 5. Zhang Z, Chen K, Ni H, et al. Predictive value of lactate in unselected critically ill patients: an analysis using fractional polynomials. J Thorac Dis 2014;6:995-1003. 6. Zhang Z. Accessing critical care big data: a step by step approach. J Thorac Dis 2015;7:238-42. 7. Buuren SV, Groothuis-Oudshoorn K. mice: Multivariate Imputation by Chained Equations in R. Journal of Statistical Software 2011;45:1-67.
Cite this article as: Zhang Z. Multiple imputation with multivariate imputation by chained equation (MICE) package. Ann Transl Med 2016;4(2):30. doi: 10.3978/ j.issn.2305-5839.2015.12.63
© Annals of Translational Medicine. All rights reserved.
www.atmjournal.org
Ann Transl Med 2016;4(2):30