Multiple oscillatory rhythms determine the temporal organization of perception Luca Ronconia,1, Nikolaas N. Oosterhofa, Claudia Bonmassara, and David Melchera a
Center for Mind/Brain Sciences, University of Trento, 38068 Rovereto, Italy
oscillations
| vision | alpha | theta | MVPA
P
erception has the primary role of reducing the complexity of our environment, since sensory inputs cannot be processed with zero lag in an analog fashion. In the temporal domain, this is demonstrated by many examples whereby stimuli presented at specific temporal delays are sometimes faithfully perceived as separate entities, while they are integrated into a unified or “average” percept in other situations. For example, two flashes separated by a brief temporal delay of about ∼30–40 ms are often perceived as a single flash (1). Similarly, in the perception of apparent motion (2), two stimuli flashed in different spatial locations are often perceived as a single, continuously moving stimulus over a period of hundreds of milliseconds (3). Likewise, in forward- and backward-masking paradigms, a target and mask stimulus may be combined into a single percept, hiding the target, even when separated by around 100 ms (4). A long-standing hypothesis is that whether two stimuli are integrated or not depends on whether they fall within the same cycle of a neural oscillation (5–8). More recently, the phase of ongoing neural oscillations, especially in the theta and alpha bands (5–7 Hz and 8–12 Hz, respectively), has been found to be related to trial-by-trial fluctuations in threshold-level perception in the visual [theta (9–12) and alpha (9, 10, 13, 14)] and auditory [theta (15) and alpha (16)] domains. However, there is evidence that prestimulus oscillations do not only influence processing of near-threshold stimuli. The oscillatory phase also predicts reaction times [alpha (17, 18) and alpha/lower beta (19)] and is linked to spatial attention [theta (20–22) and beta (23)]. Moreover, the phase of oscillations in the time period before the stimulus www.pnas.org/cgi/doi/10.1073/pnas.1714522114
onset is correlated to large-scale signatures of stimulus processing, such as event-related potentials (ERPs), BOLD response, and connectivity [theta (12) and alpha (24–26)]. These findings connect to the idea that the phase of neural oscillations reflects the rapid time-scale modulation of cortical excitability (27, reviewed in refs. 28–31). Accordingly, studies in nonhuman primates show that spikes in sensory areas are more likely to occur at a specific phase of the local field potential oscillations relative to the opposite phase (32, 33). There is some preliminary support for the idea that temporal segregation/integration of visual stimuli depends on oscillatory phase (8, 34–37). However, as mentioned above, there are multiple temporal windows (TWs) in perception, ranging from tens of milliseconds (1) to 80–120 ms (3, 35), to a few hundred milliseconds (38), up to a TW of around 2 s (39–43). Here, we tested whether the TWs of different length reported in the literature map onto a single oscillatory frequency band, such as the fluctuation in cortical excitability linked to alpha (28– 31) or, rather, would be mapped into different, specific oscillatory rhythms. In theory, such a hierarchy of TWs could help to mask the presence of perceptual samples/cycles, which is important, given that the presence of discrete windows in sensory processing does not mean that conscious perception is typically discontinuous (44–46). To accomplish this goal, we measured electroencephalography (EEG) activity while subjects were performing a temporal integration/segregation task involving two different TWs. Then, we applied multivariate decoding analysis to test whether the perceptual outcome of a single trial could be predicted from the phase of the ongoing oscillations and whether Significance To reduce the complexity of our sensory environment, the perceptual system discretizes information in different ways. In the time domain, this is evident when stimuli that are presented very close in time are sometimes faithfully perceived as different entities, whereas they are integrated into a single event at other times. Using multivariate decoding of electroencephalography data, we show that integration and segregation of stimuli over different time scales (a few tens vs. a few hundreds of milliseconds) do not rely on a single sampling rhythm; instead, they depend on the phase of prestimulus oscillations at different frequency bands in right posteriorparietal channels. These findings suggest the existence of a specific mapping between oscillations and temporal windows in perception. Author contributions: L.R. and D.M. designed research; L.R. and C.B. performed research; L.R. and N.N.O. analyzed data; and L.R., N.N.O., and D.M. wrote the paper. The authors declare no conflict of interest. This article is a PNAS Direct Submission. This open access article is distributed under Creative Commons Attribution-NonCommercialNoDerivatives License 4.0 (CC BY-NC-ND). 1
To whom correspondence should be addressed. Email:
[email protected].
This article contains supporting information online at www.pnas.org/lookup/suppl/doi:10. 1073/pnas.1714522114/-/DCSupplemental.
PNAS Early Edition | 1 of 6
NEUROSCIENCE
Incoming sensory input is condensed by our perceptual system to optimally represent and store information. In the temporal domain, this process has been described in terms of temporal windows (TWs) of integration/segregation, in which the phase of ongoing neural oscillations determines whether two stimuli are integrated into a single percept or segregated into separate events. However, TWs can vary substantially, raising the question of whether different TWs map onto unique oscillations or, rather, reflect a single, general fluctuation in cortical excitability (e.g., in the alpha band). We used multivariate decoding of electroencephalography (EEG) data to investigate perception of stimuli that either repeated in the same location (two-flash fusion) or moved in space (apparent motion). By manipulating the interstimulus interval (ISI), we created bistable stimuli that caused subjects to perceive either integration (fusion/ apparent motion) or segregation (two unrelated flashes). Training a classifier searchlight on the whole channels/frequencies/times space, we found that the perceptual outcome (integration vs. segregation) could be reliably decoded from the phase of prestimulus oscillations in right parieto-occipital channels. The highest decoding accuracy for the two-flash fusion task (ISI = 40 ms) was evident in the phase of alpha oscillations (8–10 Hz), while the highest decoding accuracy for the apparent motion task (ISI = 120 ms) was evident in the phase of theta oscillations (6–7 Hz). These results reveal a precise relationship between specific TW durations and specific oscillations. Such oscillations at different frequencies may provide a hierarchical framework for the temporal organization of perception.
PSYCHOLOGICAL AND COGNITIVE SCIENCES
Edited by David J. Heeger, New York University, New York, NY, and approved November 7, 2017 (received for review August 17, 2017)
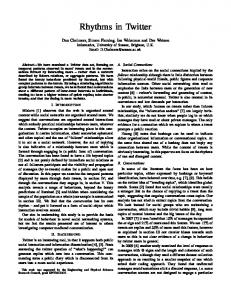
Fig. 1. Schematic representation of the task procedure with the two different types of trial employed. The two types of bistable stimuli used in the present study could appear randomly in the left or right visual hemifield. The stimuli were physically always the same, but their perceptual interpretation varied such that participants perceived one single flash (static or moving) in about half of the trials and they perceived two different flashes (in the same or different positions) in the other half.
the frequency of these oscillations changed as a function of the TW size. On each trial (Fig. 1), we presented two suprathreshold flashes that could appear randomly in the left or right visual hemifield and either repeated in the same position (two-flash fusion condition) or appeared in a different position (apparent motion condition), with these two conditions randomly intermixed across trials. We manipulated the interstimulus interval (ISI) between the two flashes in a way that induced a bistable perception for both types of visual discrimination, so that subjects integrated (fusion or apparent motion) or segregated (two distinct flashes in the same position or in different positions) the two visual stimuli in about half of the trials. We then used a naive Bayes classifier searchlight on the whole channels/frequencies/ times space to decode the perceptual interpretation of this bistable stimulus (segregation vs. integration) from the phase of ongoing oscillations on a trial-by-trial basis, confirming these results also with a more traditional phase-bifurcation analysis (9).
repeated-measure ANOVA on the N1 mean amplitude in the twoflash fusion condition revealed a main effect of ROIs [F(1,26) = 26.42, P < 0.001] and outcomes [F(1,26) = 17.15, P < 0.001] and, importantly, an outcomes × ROIs interaction [F(1,26) = 10.73, P = 0.003]. This two-way interaction, when further explored with post hoc comparisons (two-tailed t tests) revealed a more negative N1 mean amplitude in the segregation trials (i.e., two flashes perceived in the same position) for electrodes that were contralateral to the stimulus presentation [t(26) = −4.89, P < 0.001] (Fig. 2). For the similar ANOVA performed on the N1 mean amplitude elicited in the apparent motion condition, the main effect of hemifield [F(1,26) = 28.94, P < 0.001] and the hemifields × ROIs interaction [F(1,26) = 6.23, P = 0.019] were found to be significant. Importantly, a hemifields × outcomes interaction was also significant [F(1,26) = 4.83, P = 0.037]. When explored with post hoc tests, this interaction revealed a more negative N1 amplitude for segregation trials (i.e., two flashes perceived in different positions) only for stimuli displayed in the left [t(26) = −2.61, P = 0.015], but not right [t(26) = −0.49, P = 0.63], visual hemifield. The same ANOVA on the P1 mean amplitude did not reveal any significant effects. Decoding Segregation vs. Integration from Single-Trial Phase Information in the Prestimulus Period. The main analysis involved determining
whether prestimulus phase information could predict perceptual outcome in the two bistable stimulus conditions. The decoding accuracy for the different perceptual outcomes obtained with the naive Bayes classifier searchlight performed on single-trial phase values is shown in Fig. 3 A and B. The highest decoding accuracy was found in right posterior parietal channels for both experimental conditions (maximum effects were observed for channels P6, P8, PO8, and O2; Fig. 3 A and B). Cluster-corrected permutation tests revealed, however, that the time/frequency region in which the maximum decoding accuracy was observed was different between the two-flash fusion
Results Perceptual Outcome. Perceptual judgments of the stimuli, appearing randomly in the left or right visual hemifield, were almost perfectly bistable in both types of trial (two-flash fusion and apparent motion), which were randomly intermixed during the course of the experiment (Methods). Participants (n = 27) perceived two distinct flashes on average on 47.2% (SD = 13%) of trials in the two-flash fusion condition and 49.6% (SD = 14%) of trials in the apparent motion condition. The two trial types did not differ significantly in the rate of segregation/integration trials [t(26) = −0.7, P = 0.49]. These results suggest that ISI values employed here, which were chosen based on extensive pilot testing, effectively caused the two stimuli to be integrated on about half of the trials. ERPs of Perceptual Integration vs. Segregation in the Poststimulus Period.
First, electrophysiological signatures of integration and segregation of the two flashes in the poststimulus period were assessed by analyzing the mean amplitude of the P1 and N1 ERP components locked to the onset of the first stimulus. A 2 (outcomes: segregation vs. integration) × 2 (hemifields: left vs. right) × 2 [regions of interest (ROIs): left parieto-occipital vs. right parieto-occipital channels] 2 of 6 | www.pnas.org/cgi/doi/10.1073/pnas.1714522114
Fig. 2. Poststimulus neurophysiological signatures of integration/segregation over different TWs. ERPs locked to the onset of the first stimulus are shown for the two experimental conditions as a function of the stimulus presentation hemifield for the two-flash fusion trials (Upper) and the apparent motion trials (Lower). (Insets) Topographical maps depict the cluster of channels used for the analysis. The horizontal gray bar in the bottom part of each plot represents the time window used for the analysis of the N1 component (range: 180–220 ms).
Ronconi et al.
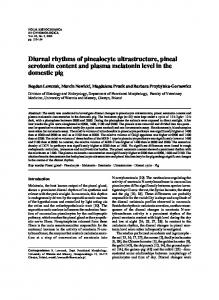
stimulus (Fig. 3A; group average maximum decoding accuracy was observed in channel P6, mean = 52.88%, SD = 3.83). On the contrary, the highest decoding accuracy in predicting the perceptual outcome for the apparent motion condition was found for frequencies spanning predominantly the upper theta band (∼6–7 Hz) at
NEUROSCIENCE
PSYCHOLOGICAL AND COGNITIVE SCIENCES
condition and the apparent motion condition. Indeed, the highest decoding accuracy in predicting subjects’ perceptual outcome from the phase of prestimulus oscillation in the two-flash fusion task was found for frequencies spanning predominantly the alpha band (∼8– 10 Hz) and around −400/−300 ms relative to the onset of the first
Fig. 3. Prestimulus/ongoing phase at different oscillatory rhythms predicts the temporal integration/segregation over different TWs. (A and B) Time frequency plots showing phase-decoding accuracy obtained with a naive Bayes classifier searchlight for the two types of trial (randomly appearing in the left or right visual hemifield). Color-coded t values represent the group-level difference against the chance level (50% decoding accuracy) as a function of the type of trial. The outlined areas of the plots delimit the intersection of time/frequency points in which a significant difference was obtained, with cluster-corrected permutation tests in the four right parieto-occipital channels showing maximum decoding accuracy (the channels are highlighted in the topographical maps above the time/frequency plots). (C and D) PBI data in which color-coded t values represent the group-level differences against PBI = 0 (no phase opposition). Also, in this case, the intersection of significant time/frequency points is outlined. (E and F) Phase-angle data averaged across trials and participants as a function of the perceptual outcome reported, which was either segregation (two flashes in the same or different positions) or integration (one single or moving flash). (G) Histogram showing the percentage of data points with a decoding accuracy significantly above chance for the entire time period of interest (−600/0 ms relative to the stimulus onset), expressed in terms of the number of cycles before the stimulus onset as a function of frequency. Note that the plots in all panels (except H) are related to the same right parieto-occipital cluster of channels showing the highest decoding accuracy in the prestimulus period. (H) Area plot showing the percentage of data points for the two types of trials showing a decoding accuracy significantly above chance in the entire time period of interest (−600/0 ms) as a function of frequency (on a logarithmic scale) in all EEG channels recorded.
Ronconi et al.
PNAS Early Edition | 3 of 6
around −500/−400 ms relative to the onset of the first stimulus (Fig. 3B; group average maximum decoding accuracy was observed in channel O2, mean = 53.17%, SD = 4.75). This pattern of results was not limited to the right parieto-occipital channels, but was a general pattern emerging also when looking at all recorded channels (Fig. 3H). To control that these time/frequency effects were not contaminated by poststimulus ERP, we ran a simulation in which we applied a time/frequency transformation to a synthetic signal (i.e., sinusoidal wave mimicking an ERP with an onset time of 0 ms). As explained by Tallon-Baudry et al. (47), to determine the extent of temporal contamination caused by the wavelet, we calculated for each frequency the wavelet’s temporal resolution σ t, which is defined as twice the SD of the Gaussian envelope at a particular frequency. Using the same parameters that we used for our wavelet analysis (Methods), we found that the earliest contamination from poststimulus data points was at −210 ms for a signal at 5 Hz (i.e., the lowest frequency that was taken into account in our study). Since our significant results were found outside this time/frequency limit, we can be confident that no contamination from poststimulus data was present (Fig. S1). Moreover, as evident in the histogram in Fig. 3G, when equating the time and frequency information and expressing the decoding accuracy instead in terms of number of cycles before the stimulus onset in which the ongoing phase was predictive of the perceptual outcome, we find substantial overlap between the two distributions. Most of the time/frequency points showing significantly accurate phase decoding were concentrated at around three cycles before the stimulus onset, a result that is examined further in Discussion. Confirmation of these findings was also evident when looking at the results of the phase bifurcation index (PBI) (9) analyses (Fig. 3 C and D), where differences in phase were evaluated based on the intertrial coherence of the two different groups of trials (segregation vs. integration) as described in Methods. In the same cluster of channels, we found comparable results, with a PBI that was significantly above 0 (meaning significant phase opposition/ difference between the two possible perceptual outcomes: segregation vs. integration) for time/frequency points that substantially overlapped those found with the naive Bayes classifier searchlight. Again, the two-flash trials showed significant results in the alpha range and apparent motion in the phase of the theta band. It is worth noting that the analyses conducted so far are inappropriate for revealing effects that would systematically occur contralateral (or, possibly, ipsilateral) to the stimulus. This is because, for any EEG channel, these potential lateralized effects would only be present on half of the trials (when the stimulus is on the contralateral side). To overcome this issue, we performed a complementary analysis that involved “mirroring” all channels on half of the trials. Specifically, we mirrored channels for all trials containing stimuli appearing on the right hemifield. In this way, the effects that systematically occur contralaterally would map on the right electrodes and the ipsilateral effects would map on the left electrodes. We performed the same phase-decoding analyses described above, but no significant results emerged (two-flash fusion trials: all corrected P > 0.142, apparent motion trials: all corrected P > 0.099; Fig. S2). Lastly, we ran a naive Bayes classifier searchlight on single-trial power values to check whether difference in power could partially explain the differences in the phase-decoding accuracy found for two-flash fusion and apparent motion trials. Results revealed only small differences in power in the cluster of right parieto-occipital channels, where phase-related differences emerged, which, importantly, did not overlap with the differences that emerged from the phase-decoding analysis (Fig. S3). This result confirms that phase-related differences were independent of power-related differences present in the ongoing oscillations. 4 of 6 | www.pnas.org/cgi/doi/10.1073/pnas.1714522114
Discussion Perception simplifies the nature of the incoming sensory input in many different ways, such that information can be represented and stored in an optimized but more abstracted format. This process is well studied in the spatial domain (48, 49), but the way in which information is grouped together in the temporal domain is less clear. In the present study, we took advantage of different analysis methods, particularly of single-trial, multivariate EEG decoding of the subjects’ perceptual outcome, to understand the relationship between the phase of the ongoing neural oscillation and temporal integration/segregation of stimuli over different TWs. Indeed, mounting evidence shows that the ongoing oscillations in the theta/alpha bands are not only related to trial-by-trial fluctuations in threshold-level perception in different sensory modalities (9, 10, 12, 14–16) but also predict temporal segregation/ integration of visual stimuli over time (8, 34–37). These findings are in agreement with the idea that the phase of neural oscillations reflects modulation of cortical excitability (28–31). In the present study, we show that the way in which ongoing neural oscillations determine whether visual information is temporally integrated or segregated does not depend on a single, general sampling rhythm. On the contrary, different ongoing oscillatory rhythms determine the temporal integration/segregation of stimuli over time according to the TW involved. We found that when participants were presented with a bistable stimulus comprising two distinct flashes in the same spatial position and separated by an ISI of 40 ms (two-flash fusion trials), the subjective interpretation of this bistable stimulus (one flash vs. two flashes perceived) could be accurately decoded from the phase of the ongoing oscillation within the alpha band (maximum decoding accuracy at around 8–10 Hz). On the other hand, when participants were presented with a bistable stimulus comprising two distinct flashes appearing in different spatial positions and separated by an ISI of 120 ms (apparent motion trials), the subjective interpretation of this bistable stimulus (motion vs. alternation) could be accurately decoded from the phase of the ongoing oscillation within the theta band (maximum decoding accuracy at around 6–7 Hz). These results renewed previous evidence (8, 35) of a relationship between the alpha phase and timing in perception. In particular, a previous study examining the “flash-lag” effect (50), a spatiotemporal illusion where a continuously moving object is incorrectly perceived ahead of its true location when an event (e.g., flash) appears, found that the magnitude of the effect varied along with the ongoing 5- to 20-Hz EEG phase. Those results suggested that neural periodicity is involved in the flash-lag illusion. Additionally, the present results are in agreement with recent studies from our own and other laboratories providing evidence for a causal link between neural oscillations and spatiotemporal aspects of perception (51, 52). In a recent study, we employed sensory entrainment in the prestimulus interval to align ongoing oscillations to a theta, alpha, or beta rhythm. We found that the frequency of temporal segregation was modified by sensory entrainment at the theta and alpha (but not beta) rhythms (52). Another recent study employing an illusory jitter perception termed the “motion-induced spatial conflict” showed that the illusory visual vibrations mirror the intrinsic peak alpha frequency of the participants. Moreover, a temporary shift of the individual alpha peak due to alternate current stimulation altered the perceived jitter frequency (51). The phase effect we found could not be dependent on variations in oscillatory amplitude, as our analyses demonstrated, thus suggesting that at least for the alpha/theta band, the phase of ongoing neural oscillations could impact stimulus processing independently from amplitude variations, in agreement with previous evidence (35). Multivariate decoding revealed also that the topography of the effect was comparable for the two types of trial, with the highest decoding accuracy visible in right parietooccipital channels, suggesting a common area/network responsible for temporal sampling across different time periods. Although EEG Ronconi et al.
1. Hirsh IJ, Sherrick CE, Jr (1961) Perceived order in different sense modalities. J Exp Psychol 62:423–432. 2. Wertheimer M (1912) Experimentelle studium uber das sehen von bewegung. Z Psychol Z Angew Psychol 61:161–265. German. 3. Finlay D, von Grünau M (1987) Some experiments on the breakdown effect in apparent motion. Percept Psychophys 42:526–534. ˘ 4. Breitmeyer B, Ögmen H (2006) Visual Masking: Time Slices Through Conscious and Unconscious Vision (Oxford Univ Press, Oxford, UK). 5. Bishop GH (1932) Cyclic changes in excitability of the optic pathway of the rabbit. Am J Physiol 103:213–224.
Ronconi et al.
Methods Participants. Twenty-seven adult participants (mean age = 24 y, SD = 3, 11 males) recruited at the University of Trento took part in the present study as paid volunteers. From this original sample of participants, three subjects were removed for the EEG analysis because of noisy data in the prestimulus period, leaving 24 participants for the full analysis. All participants provided informed consent, had normal or corrected-to-normal vision, and reported normal hearing. They reported no history of neurological disorders. The study was approved by the Ethics Committee of the Center for Mind/Brain Sciences at the University of Trento and conforms to the principles elucidated in the Declaration of Helsinki of 2013. Stimuli, Procedure, and Data Analysis. Detailed information can be found in SI Methods. ACKNOWLEDGMENTS. This research was supported by a European Research Council grant, “Construction of Perceptual Space-Time” (StG Agreement 313658). 6. Lansing RW (1957) Relation of brain and tremor rhythms to visual reaction time. Electroencephalogr Clin Neurophysiol 9:497–504. 7. Stroud JM (1967) The fine structure of psychological time. Ann N Y Acad Sci 138: 623–631. 8. Varela FJ, Toro A, John ER, Schwartz EL (1981) Perceptual framing and cortical alpha rhythm. Neuropsychologia 19:675–686. 9. Busch NA, Dubois J, VanRullen R (2009) The phase of ongoing EEG oscillations predicts visual perception. J Neurosci 29:7869–7876. 10. Fiebelkorn IC, Saalmann YB, Kastner S (2013) Rhythmic sampling within and between objects despite sustained attention at a cued location. Curr Biol 23:2553–2558.
PNAS Early Edition | 5 of 6
PSYCHOLOGICAL AND COGNITIVE SCIENCES
flow despite discrete sensory sampling mechanisms. Moreover, the presence of multiple sampling frequencies would help to balance the needs of temporal integration (i.e., to improve perceptual decision making by combining information over time) and sensitivity to changes in input that reflect new events in a dynamic environment. In the case of language, it is clear that auditory processing takes place for different TWs ranging from phonemes (tens of milliseconds) to syllables (hundreds of milliseconds), to words and phrases (seconds). Recent studies have linked these auditory TWs to oscillatory behavior, with shaping and entrainment of these frequencies to the specific speech patterns of speakers (60). Likewise, visual events occur over different time periods, which might require multiple visual TWs in a sort of language of vision. A number of oscillatory frequencies have been linked to different, specific aspects of perceptual processing. For example, thetaband rhythms have been linked to the grouping of sensory inputs into meaningful, temporal chunks that incorporate information across multiple brain regions (36, 61, 62), whereas gamma oscillations may reflect more local, bottom-up processing and beta oscillations may reflect more feedback and top-down control (63, 64). The current results would be consistent with distinct roles for alpha in determining temporal resolution (8, 58, 65, 66) and for thetafrequency sampling in generating more complex, meaningful percepts of objects and events (36, 62). In terms of the mechanisms by which these two frequencies diverge, one possibility could be that when perception depends on higher order areas or larger networks (e.g., networks involving primary visual areas, but also motion processing and attentional control areas), a slower rhythm would emerge as a result of stronger feedback projections and longer interareal communication time among these regions (61). To conclude, in the present study, we took advantage of a method using phase information for multivariate decoding of the perceptual outcome, and we demonstrate within a single study that the perceptual sampling of visual events over different temporal scales does not rely on a single sampling mechanism but, instead, on the phase of different oscillatory rhythms. The presence of multiple TWs and their mapping into different oscillatory rhythms may help to explain why discrete sensory processing does not result in discontinuity of perception.
NEUROSCIENCE
does not allow for the definition of exact underlying neural sources, the right parieto-occipital topography revealed by our multivariate decoding analysis is in agreement with mounting evidence showing that the neural sources underlying the modulation of the ongoing theta/alpha phase are linked to the activity of the right posterior parietal cortex (PPC) (12, 53–55). Hanslmayr et al. (12), for example, show that the underlying modulation of perception operated by the phase of ongoing oscillations reflects the bidirectional information flow between the occipital cortex and right PPC, suggesting that the oscillatory phase reflects the periodic gate of perception by opening transient time periods in which long-distance cortical information transfer can take place. Similarly, the tendency to either integrate or segregate two visual stimuli in time has been linked to right parieto-occipital sources (36). Overall, the present findings suggest a precise mapping between oscillatory activity at a specific frequency and the temporal organization of sensory input into coherent percepts. Variations in the theta and alpha (and maybe other) oscillatory rhythms, reflecting periods of increased/decreased excitability, would determine if subsequent stimuli are perceived in their “real” nature, and thus as distinct events, or if they are subjected to some forms of temporal averaging that lead to a relatively “poorer” quality of processing (i.e., perception of a single flash in the case of the two-flash fusion trials and perception of a single moving flash in apparent motion trials). It is interesting to observe that the number of oscillatory cycles from which subjective perception can be efficiently decoded largely converges around three cycles before the onset of the stimulus, independent of the specific oscillatory rhythms involved. This timing is consistent with the idea that the presence of targetevoked ERPs and signal filtering involved in commonly used time/ frequency analyses (e.g., wavelet) causes a shift of the maximum phase difference toward earlier time points (56). That result suggests that the phase modulation found in this study may have its true latency around the time of the stimulus presentation. Although a direct link between the temporal organization of perception (into discrete units) and oscillations has been suggested for some time (5–8, 57, 58), this idea has remained controversial theoretically and has been repeatedly challenged empirically. The current findings may provide some assistance in resolving this controversy. The finding of two different perceptual TWs mapping onto two different frequency bands may help to explain the lack of consistent evidence for a single, master frequency of temporal resolution. Indeed, in addition to the alpha band, neural correlates of TWs have been reported in theta and beta frequencies (reviewed in ref. 58). On a more theoretical level, there is a long-standing debate between “perceptual moment” and “continuous perception” descriptions of the phenomenology of visual perception, as captured by James’ idea of a stream of conscious awareness (59). It has been argued that the presence of discrete TWs in sensory processing does not necessarily signify that perception is discontinuous (44–46). A hierarchy of different TWs would potentially mask the discontinuities of TWs at a lower stage. For example, the Nyquist–Shannon theorem shows how discrete samples can be transformed back into a continuous function through the use of multiple sampling frequencies, such as a combination of theta and alpha frequencies. Such a hierarchy of TWs may contribute to the intuitive impression of a continuous
11. Fiebelkorn IC, et al. (2013) Cortical cross-frequency coupling predicts perceptual outcomes. Neuroimage 69:126–137. 12. Hanslmayr S, Volberg G, Wimber M, Dalal SS, Greenlee MW (2013) Prestimulus oscillatory phase at 7 Hz gates cortical information flow and visual perception. Curr Biol 23:2273–2278. 13. Nunn CM, Osselton JW (1974) The influence of the EEG alpha rhythm on the perception of visual stimuli. Psychophysiology 11:294–303. 14. Mathewson KE, Gratton G, Fabiani M, Beck DM, Ro T (2009) To see or not to see: Prestimulus alpha phase predicts visual awareness. J Neurosci 29:2725–2732. 15. Ng BS, Schroeder T, Kayser C (2012) A precluding but not ensuring role of entrained low-frequency oscillations for auditory perception. J Neurosci 32:12268–12276. 16. Strauß A, Henry MJ, Scharinger M, Obleser J (2015) Alpha phase determines successful lexical decision in noise. J Neurosci 35:3256–3262. 17. Callaway E, 3rd, Yeager CL (1960) Relationship between reaction time and electroencephalographic alpha phase. Science 132:1765–1766. 18. Dustman RE, Beck EC (1965) Phase of alpha brain waves, reaction time and visually evoked potentials. Electroencephalogr Clin Neurophysiol 18:433–440. 19. Drewes J, VanRullen R (2011) This is the rhythm of your eyes: The phase of ongoing electroencephalogram oscillations modulates saccadic reaction time. J Neurosci 31: 4698–4708. 20. Busch NA, VanRullen R (2010) Spontaneous EEG oscillations reveal periodic sampling of visual attention. Proc Natl Acad Sci USA 107:16048–16053. 21. Landau AN, Schreyer HM, van Pelt S, Fries P (2015) Distributed attention is implemented through theta-rhythmic gamma modulation. Curr Biol 25:2332–2337. 22. Dugué L, Marque P, VanRullen R (2015) Theta oscillations modulate attentional search performance periodically. J Cogn Neurosci 27:945–958. 23. Buschman TJ, Miller EK (2009) Serial, covert shifts of attention during visual search are reflected by the frontal eye fields and correlated with population oscillations. Neuron 63:386–396. 24. Jansen BH, Brandt ME (1991) The effect of the phase of prestimulus alpha activity on the averaged visual evoked response. Electroencephalogr Clin Neurophysiol 80: 241–250. 25. Scheeringa R, Mazaheri A, Bojak I, Norris DG, Kleinschmidt A (2011) Modulation of visually evoked cortical FMRI responses by phase of ongoing occipital alpha oscillations. J Neurosci 31:3813–3820. 26. Gruber WR, et al. (2014) Alpha phase, temporal attention, and the generation of early event related potentials. Neuroimage 103:119–129. 27. Dugué L, Marque P, VanRullen R (2011) The phase of ongoing oscillations mediates the causal relation between brain excitation and visual perception. J Neurosci 31: 11889–11893. 28. Klimesch W, Sauseng P, Hanslmayr S (2007) EEG alpha oscillations: The inhibitiontiming hypothesis. Brain Res Brain Res Rev 53:63–88. 29. Jensen O, Mazaheri A (2010) Shaping functional architecture by oscillatory alpha activity: Gating by inhibition. Front Hum Neurosci 4:186. 30. Jensen O, Bonnefond M, VanRullen R (2012) An oscillatory mechanism for prioritizing salient unattended stimuli. Trends Cogn Sci 16:200–206. 31. Jensen O, Gips B, Bergmann TO, Bonnefond M (2014) Temporal coding organized by coupled alpha and gamma oscillations prioritize visual processing. Trends Neurosci 37: 357–369. 32. Haegens S, Nácher V, Luna R, Romo R, Jensen O (2011) α-Oscillations in the monkey sensorimotor network influence discrimination performance by rhythmical inhibition of neuronal spiking. Proc Natl Acad Sci USA 108:19377–19382. 33. Haegens S, et al. (2015) Laminar profile and physiology of the α rhythm in primary visual, auditory, and somatosensory regions of neocortex. J Neurosci 35:14341–14352. 34. Mathewson KE, et al. (2012) Making waves in the stream of consciousness: Entraining oscillations in EEG alpha and fluctuations in visual awareness with rhythmic visual stimulation. J Cogn Neurosci 24:2321–2333. 35. Milton A, Pleydell-Pearce CW (2016) The phase of pre-stimulus alpha oscillations influences the visual perception of stimulus timing. Neuroimage 133:53–61. 36. Wutz A, Muschter E, van Koningsbruggen MG, Weisz N, Melcher D (2016) Temporal integration windows in neural processing and perception aligned to saccadic eye movements. Curr Biol 26:1659–1668.
6 of 6 | www.pnas.org/cgi/doi/10.1073/pnas.1714522114
37. Wutz A, Weisz N, Braun C, Melcher D (2014) Temporal windows in visual processing: “Prestimulus brain state” and “poststimulus phase reset” segregate visual transients on different temporal scales. J Neurosci 34:1554–1565. 38. Drewes J, Zhu W, Wutz A, Melcher D (2015) Dense sampling reveals behavioral oscillations in rapid visual categorization. Sci Rep 5:16290. 39. Pöppel E (1997) A hierarchical model of temporal perception. Trends Cogn Sci 1: 56–61. 40. Pöppel E (2009) Pre-semantically defined temporal windows for cognitive processing. Philos Trans R Soc Lond B Biol Sci 364:1887–1896. 41. Hasson U, Yang E, Vallines I, Heeger DJ, Rubin N (2008) A hierarchy of temporal receptive windows in human cortex. J Neurosci 28:2539–2550. 42. Fairhall SL, Albi A, Melcher D (2014) Temporal integration windows for naturalistic visual sequences. PLoS One 9:e102248. 43. Wang L, et al. (2016) Scanning the world in three seconds: Mismatch negativity as an indicator of temporal segmentation. PsyCh J 5:170–176. 44. van de Grind W (2002) Physical, neural, and mental timing. Conscious Cogn 11: 241–264, discussion 308–313. 45. van Wassenhove V (2009) Minding time in an amodal representational space. Philos Trans R Soc Lond B Biol Sci 364:1815–1830. 46. Busch N, VanRullen R (2014) Is visual perception like a continuous flow or a series of snapshots. Subjective Time: The Philosophy, Psychology, and Neuroscience of Temporality (MIT Press Cambridge, MA), pp 161–178. 47. Tallon-Baudry C, Bertrand O, Delpuech C, Pernier J (1996) Stimulus specificity of phase-locked and non-phase-locked 40 Hz visual responses in human. J Neurosci 16: 4240–4249. 48. Alvarez GA (2011) Representing multiple objects as an ensemble enhances visual cognition. Trends Cogn Sci 15:122–131. 49. Whitney D, Yamanashi Leib A (September 11, 2017) Ensemble perception. Annu Rev Psychol, 10.1146/annurev-psych-010416-044232. 50. Chakravarthi R, Vanrullen R (2012) Conscious updating is a rhythmic process. Proc Natl Acad Sci USA 109:10599–10604. 51. Minami S, Amano K (2017) Illusory jitter perceived at the frequency of alpha oscillations. Curr Biol 27:2344–2351.e4. 52. Ronconi L, Melcher D (2017) The role of oscillatory phase in determining the temporal organization of perception: Evidence from sensory entrainment. J Neurosci 37: 10636–10644. 53. van Dijk H, Schoffelen JM, Oostenveld R, Jensen O (2008) Prestimulus oscillatory activity in the alpha band predicts visual discrimination ability. J Neurosci 28:1816–1823. 54. Thut G, et al. (2011) Rhythmic TMS causes local entrainment of natural oscillatory signatures. Curr Biol 21:1176–1185. 55. Jaegle A, Ro T (2014) Direct control of visual perception with phase-specific modulation of posterior parietal cortex. J Cogn Neurosci 26:422–432. 56. Brüers S, VanRullen R (2017) At what latency does the phase of brain oscillations influence perception? eNeuro 4:e0078-17.2017. 57. VanRullen R, Koch C (2003) Is perception discrete or continuous? Trends Cogn Sci 7: 207–213. 58. VanRullen R (2016) Perceptual cycles. Trends Cogn Sci 20:723–735. 59. James W (1890) Principles of Psychology (Holt, New York). 60. ten Oever S, Sack AT (2015) Oscillatory phase shapes syllable perception. Proc Natl Acad Sci USA 112:15833–15837. 61. Dugué L, VanRullen R (2017) Transcranial magnetic stimulation reveals intrinsic perceptual and attentional rhythms. Front Neurosci 11:154. 62. Schroeder CE, Lakatos P (2009) Low-frequency neuronal oscillations as instruments of sensory selection. Trends Neurosci 32:9–18. 63. Engel AK, Fries P (2010) Beta-band oscillations–Signalling the status quo? Curr Opin Neurobiol 20:156–165. 64. Buschman TJ, Miller EK (2007) Top-down versus bottom-up control of attention in the prefrontal and posterior parietal cortices. Science 315:1860–1862. 65. Cecere R, Rees G, Romei V (2015) Individual differences in alpha frequency drive crossmodal illusory perception. Curr Biol 25:231–235. 66. Samaha J, Postle BR (2015) The speed of alpha-band oscillations predicts the temporal resolution of visual perception. Curr Biol 25:2985–2990.
Ronconi et al.