Multiple Region Categorization for Scenery Images Tamar Avraham, Ilya Gurvich, and Michael Lindenbaum Computer Science Department, Technion - I.I.T., Haifa 32000, Israel
[email protected],
[email protected],
[email protected]
Abstract. We present two novel contributions to the problem of region classification in scenery/landscape images. The first is a model that incorporates local cues with global layout cues, following the statistical characteristics recently suggested in [1]. The observation that background regions in scenery images tend to horizontally span the image allows us to represent the contextual dependencies between background region labels with a simple graphical model, on which exact inference is possible. While background is traditionally classified using only local color and textural features, we show that using new layout cues significantly improves background region classification. Our second contribution addresses the problem of correct results being considered as errors in cases where the ground truth provides the structural class of a land region (e.g., mountain), while the classifier provides its coverage class (e.g., grass), or vice versa. We suggest an alternative labeling method that, while trained using ground truth that describes each region with one label, assigns both a structural and a coverage label for each land region in the validation set. By suggesting multiple labels, each describing a different aspect of the region, the method provides more information than that available in the ground truth. Keywords: region annotation, multiple categorization, exact inference, scenery/landcape, boundary shape, contextual scene understanding
1
Introduction
The incorporation of context into object detection and region labeling has recently come into the mainstream of computer vision (e.g., [2–7]). In these methods the identity of an image region depends both on its local properties and on the labels and appearance of the neighboring regions. To solve the region labeling problem generally, approximation methods (e.g., loopy belief propagation) are required. In our work we focus on context based region annotation for scenery images. It turns out that this more simple problem can be modeled by a rather simple graphical model on which exact inference is possible. We follow [1], where statistical properties of scenery images were analyzed. It was observed that background regions in scenery images tend to horizontally span the image, making it possible to define a one-dimensional top-bottom order of the background regions. Moreover, it was observed that the label of a
background region correlates with the shape of the upper part of its boundary. It was shown that by using only those two layout properties, it is possible to capture the general appearance variability of scenery images: those cues enabled the generation of semantic sketches of scenes. However, [1] left an open question about whether those cues can assist in region annotation. In the first part of this work we answer this question; see Fig. 1(a). We suggest an exact inference model for annotating background regions that combines layout cues with texture and color cues. We show that this combination significantly improves classification over methods that rely only on local color and texture, as each type of cue contributes to a different dichotomy. The second part of this paper considers a related but different problem. We observe that results counted as errors are not always wrong. Often, regions are associated with different labels which correspond to different aspects of them, while annotators usually provide only one label corresponding to one of these aspects. For instance, a mountain with trees may be classified by the ground truth as mountain and classified by our algorithm as trees, or vice versa. That is, a land region’s annotation can either describe its structure (mountain, plain, valley) or the overlying land-cover (trees, grass, sand, rocks, etc.) This relates to recent work on problems with large numbers of categories [8, 9]. In order to get a more informative accuracy score, it was suggested that the cost of misclassification be associated with the relative location of the true classification and the estimated classification in the wordnet tree [10]. This solution is good for foreground objects for which the categorization can be for different semantic details (e.g., crow, bird or animal). However, we found this method unsuitable for background categories, as the structural descriptors and the coverage descriptors do not appear in close wordnet sub-trees. Another recent related work [11] suggests that data can be organized by several non-redundant clustering solutions, each providing a different facet. To support multiple categorization of land regions, we suggest an alternative labeling method that, while trained using ground truth that describes each region with one label, assigns two types of annotation for test data; see examples in Fig. 3. The annotations in the training data allow us to generalize both the appearance of land coverage categories (using the regions in the training set that are labeled by their coverage) and to generalize the appearance of land structure categories (learning from regions labeled by their structure). Given a new test image, each of its land regions can now be classified by both characteristics. Sec. 2 overviews background region classification cues. Sec. 3&4 discuss the region classification algorithm and its results. Sec. 5&6 discuss the multiple labeling algorithm and its results. Sec. 7 concludes.
2 2.1
Cues for Background Region Classification Color and Texture
The most natural choice for classifying a background region is by its color and textural attributes. In [12], such attributes were used for classifying patches
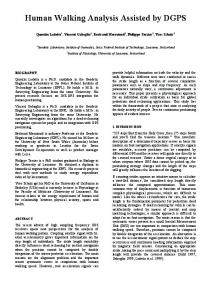
trees
H1 H2
ground
mountain sand
(a)
T2
H3 T 3
OR sky mountain sea rocks
T1
H4
?
H5
S2 S3 S4
T4
T5
l1
li −1
li
ln
S5 T1
(b)
H1
Ti −1 Si−1 Hi−1 Ti Si H i
Tn S n H n
(c)
Fig. 1. (a) Demonstrating the contribution of ‘layout’: given this general image layout (without the texture), we can easily decide between the two suggested annotations. (b) The image is divided into n horizontal background regions, R = (R1 , ..., Rn ). Each region Ri = (Hi , Ti , Si , Oi ) is described by its average height Hi , its texture&color descriptor Ti , by the curve separating it from the region above it, Si , and by its relative location (order), Oi = i. (c) the HMM (Hidden Markov Model) representing the ORC model. The regions’ labels, l1 , ..., ln , are the hidden variables/states. The observed variables are H1 , ..., Hn , T1 , ..., Tn , and S2 , ..., Sn .
of images, as a first step in a method for scene categorization. We adapt the description suggested there and describe each region by: 1. Color histograms: a histogram for each of the components of the HSV color representation (36, 32, 16 bins for H, S, and V, respectively). 2. Edge direction histograms: we apply a Canny edge detector and collect the gradient directions in the edge locations (72 bins). 3. GLCM (Gray Level Co-occurrence Matrix [13]): the region is quantized to 32 gray levels. A GLCM is computed for 4 offsets (-1,1), (0,1), (1,1) and (1,0). For each, we compute the contrast, energy, entropy, homogeneity, inverse difference moment, and the correlation, for a total of 24 additional components.
2.2
Relative Location Statistics
In [1] it was shown that types of background regions tend to have typical relative locations. For example, a sand region will usually appear below a sea region, mountains are usually higher in the image than fields, and of course the sky is usually above all. These top-bottom relations were modeled by a Markov network. Let {L1 , ..., Lm } be the possible background labels. The network has m + 2 nodes. The first m are associated with the m labels. In addition, there is a starting status denoted ‘top’ and a sink status denoted ‘bottom’. M (Li , Lj ) is the probability that a region labeled Li appears above a region labeled Lj in an image. M (‘top’, Li ) and M (Li , ‘bottom’) are the probabilities that a region with label Li is at the top/bottom of an image, respectively. The transition probabilities are estimated from the training image set 1 . 1
We specify the top-bottom order by the height of the highest pixel in each region. Therefore, the background regions do not always have to horizontally span the image.
2.3
Boundary Shape Characteristics
In [1], the characteristics of a contour separating two background regions were shown to correlate with the lower region’s identity. The boundary on top of a sea, grass or field region is usually smooth and horizontal, resembling a DC signal. The boundary on top of a region of trees or plants can be considered as a high frequency 1D signal. The boundary on top of a mountain region usually resembles 1D signals of rather low frequency and high amplitude. Following this observation, it was suggested that a signal representation be adopted. For each background labeled region, the upper part of its contour is extracted and cut to chunks of 64-pixel length. Each such chunk is actually a descriptor vector of length 64. In the model described in Sec. 3 we use these descriptor vectors as cues for region annotation, and use an SVM that provides probability estimates [14]. Let Si describe the boundary above a region indexed i with identity l ∈ {L1 , ..., Lm }. Si is cut to Ki chunks, Si1 , ..., SiKi . Ki = b |S64i | c. When the region belongs to a training image, the Ki chunks, each labeled l, are members of the training set. When the region is being classified, the SVM classifier returns a probability estimate for each of the Ki chunks, p(l = Lj |Sik ), k = 1, ..., Ki , j = 1, ..., m. The class probability for the whole signal (boundary) QKi is then p(l = Lj |Si ) = z11 k=1 p(l = Lj |Sik ), where z1 is a normalizing factor.
3
Background Region Classification: The ORC Algorithm
In [1], it was shown that it is possible to capture the general appearance variability of scenery images using only the cues described in sections 2.2&2.3. Those cues enabled the generation of semantic sketches of scenes. However, [1] left an open question about whether those cues can assist in region annotation. In this section we answer this question by proposing a mechanism for combining all the cues described in Sec. 2: the ORC (Ordered Region Classification) algorithm. Let R = (R1 , ..., Rn ) be n background regions in an image I, ordered by their top-bottom location. Each Ri = (Hi , Si , Ti , Oi ) is characterized by its size, Hi 2 , its color&texture, Ti , the ‘1D signal’ Si describing the boundary separating it from Ri−1 (S1 = ∅), and by its order in the image, Oi = i; see Fig. 1(b). Taking a contextual approach, the identity li of region Ri depends on its appearance, its location, and on the appearance and relative location of the other image regions. Therefore, the probability for li to be Lj is a marginalization over all joint assignments (l1 , ..., ln ) in which li = Lj : pORC (i, Lj ) = p(li = Lj |R) =
X
p(l1 = Lk1 , ..., li = Lj , ..., ln = Lkn |R) .
(k1 ,...ki−1 ,ki+1 ,...,kn ) ∈{1,...,m}n−1
We use the Markovian property described in Sec. 2.2, i.e., the identity of region Ri directly depends only on the identity of region Ri−1 . Also, we ignore 2
Since we are discussing horizontal patches that usually span the image from side to side, their size is described only by their average height.
the direct dependency between the color, texture, and height of the different regions inside an image, and between the appearance of separating boundaries inside an image. The probability for a joint assignment is then p(l1 = Lk1 , ..., ln = Lkn |R) = p(l1 = Lk1 |R1 )
n Y
p(li = Lki |li−1 = Lki−1 , Ri ) .
i=2
(1) Assuming Ti , Si , Hi , and Oi are independent, and that Ti , Si , Hi are independent in Ri−1 , every term in the product can be expressed as pTi pSi pHi p(li = Lki |li−1 = Lki−1 , Oi ) = p(Ti , Si , Hi ) p(li = Lki |Ti )p(li = Lki |Si )pHi p(li = Lki |li−1 = Lki−1 , Oi ) , z2 [p(li = Lki )]2
p(li = Lki |li−1 = Lki−1 , Ri ) =
(2)
where
= p(Ti |li = Lki ), pSi = p(Si |li = Lki ), pHi = p(Hi |li = Lki ) and z2 = . Since z2 is not a function of the labels, we can infer it by normalization. Given a label, the distribution p(Hi |li = Lki ) is modeled by a simple Gaussian distribution (as suggested in [1]). For modeling the dependency of the label in the color and texture, p(li = Lki |Ti ), and in the boundary shape, p(li = Lki |Si ), we use an extension of SVM that provides probability estimates [14] (the SVMs used for color&texture and for boundary shapes are separate). The prior probability p(li = Lki ) is computed from the occurrences of labels in the training set. Finally, pTi p(Ti ,Si ,Hi ) p(Ti )p(Si )
p(li = Lki |li−1
M (‘top’, li ) = Lki−1 , Oi ) = M (li−1 , li ) M (li−1 , li )M (li , ‘bottom’)
i=1 1