related stimulus (time-out) when other stimuli were switched from reinforcement to extinction. (hitherto, positive behavioral contrast had been observed only in ...
Animal Learning & Behavior 1981,9 (1),115-126
Multiple-schedule interactions and discrimination DAVID W. ROWE and JOHN C. MALONE, JR. University of Tennessee, Knoxville, Tennessee 37916 Pigeons received variable-interval (VI)reinforcement for keypecking during randomized presentations of seven line-orientation stimuli forming a continuum ranging from horizontal (0 deg) to vertical (90 deg). Each line presentation lasted for 30 sec and was preceded and followed by 30-sec time-outs. After responding stabilized, only responding in the two extreme stimuli (0and 90 deg) was reinforced. As discrimination training proceeded, strong behavioral contrast and dimensional contrast effects appeared. However, only marginal local effects (local contrast and local dimensional effects), exerted by one line-orientation component upon a second, appeared, indicating that behavioral and dimensional contrast may be independent of parallel local effects. An attempt was made to apply Blough's (1975) quantitative model of operant generalization and discrimination to the present discrimination procedure. However, this model did not predict the generalization gradient shape that was experimentally obtained. This experiment also yielded two serendipitous findings: (1) Positive behavioralcontrast appeared in an extinctionrelated stimulus (time-out) when other stimuli were switched from reinforcement to extinction (hitherto, positive behavioral contrast had been observed only in responding to a reinforcementrelated stimulus when other stimuli were switched from reinforcement to extinction), and (2) final responding was higher in the presence of an extinction stimulus that had always been an extinction stimulus than it was in the presence of other extinction stimuli that had previously been paired with VI reinforcement. At one time, it appeared that performance during the various components of a multiple schedule were independent (cf. Ferster & Skinner, 1957). This belief, coupled with the fact that discriminations are readily demonstrated with this type of schedule, made it reasonable to argue that discrimination formation need not be accompanied by interactions among components. However, during the past two decades, it has become clear that a number of interactions among the multiple schedule's components do occur, and that these interactions usually accompany the development of a discrimination. In fact, it has been suggested (Malone & Rowe, in press) that such interactions may determine the outcome of discrimination training. Therefore, interest in the detailed analysis of these interactions is warranted. At least six types of interactions have been described. These six types can be divided logically into two major categories: (1) local effects, and (2) overall effects.
LocalInteraction Effects The two major classes of interaction effects differ according to the nature of the data that demonstrate their presence. Local effects, as defined here, are shown when response rates during various presentaReprints may be obtained from David W. Rowe, Department of Psychology, University of Tennessee, Knoxville, Tennessee
37916.
Copyright 1981 Psychonomic Society, Inc.
tions of a stimulus (i.e., components) systematically vary as a function of a specific preceding stimulus. For example, in a situation involving two stimuli (A and B), there exist two local response rates for A: (l) the rate associated with occurrences of A when it immediately followed an occurrence of A, and (2) the rate associated with A when it immediately followed B. If response rates are consistently higher (or lower) for one average local response rate than for others, we call this a local interaction effect, because response rates during individual presentations of A vary as a function of the specific stimulus immediately preceding it. There are three specific types of local interaction effects. These are local induction, local contrast, and local dimensional effects. The term "induction," as interpreted by Skinner (1938), refers to a convergence of two response rates that are correlated with stimuli signaling different rates of reinforcement. Specifically, local induction refers to a change in the response rate correlated with a specific stimulus (relative to that stimulus' overall average) in the direction toward the rate associated with the preceding component. For example, assume that Stimulus A, an S-, is associated with nonreinforcement and with low overall rates of response, whereas Stimulus B, an S+, is associated with reinforcement and with high overall rates of response. If local response rates for A following B are consistently higher than those for A following itself, this is induction, because the rate
115
00904996/81/010115-12$01.45/0
116
ROWE AND MALONE
in A rises above its average and toward the average rate in B. Likewise. local induction is present when local response rates for B following A are consistently lower than those for B following itself. because the response rate in B falls below its average and toward the average in A. Local induction is an interaction effect that is commonly found in discrimination studies only at the outset of discriminationtraining and after the discrimination is very well learned (cf. Malone. 1976; Malone & Rowe. in press; Pavlov, 1927-although none of these authors called their effects by this name). Opposed to local induction is the interaction effect labeled local contrast by Malone and Staddon (1973).1 Local contrast refers to a change in the response rate associated with a specific stimulus (relative to that stimulus' overall average) in the direction opposite to the rate associated with the preceding component. Thus, applied to the above example, local contrast describes the situation in which the local response rates in A (the S-) following B (the S+) are consistently lower than those in A following itself. and the situation in which local response rates in B following A are consistently higher than they are in B following itself. Local contrast appears at the time a discrimination begins to develop (i.e., overall response rates diverge) and usually persists until the discrimination is well learned (i.e.• response rates stabilized). It then fades away as local induction replaces it. (For some pertinent research. see Boneau & Axelrod. 1962; Malone, 1976; Malone & Rowe. in press; Nevin & Shettleworth, 1966;Pavlov, 1927.) A third type of local interaction effect has recently been reported (Hinson & Malone, 1980; Malone, 1976;Malone & Rowe. in press), which can be called a local dimensional effect. This effect exists when local response rates in a specific stimulus vary as a function of the degree of similarity between that stimulus and whatever stimulus preceded it (e.g., their relative positions along a common stimulus dimension), even when the various preceding stimuli were associated with identical reinforcement schedules. To illustrate, first assume a three-stimulus (A. B. and C) discrimination situation in which A is presented in extinction and Band C are presented with identical schedules of reinforcement that produce approximately the same rates of response. Also. assume that A lies closer to B on the stimulus dimension than it does to C. Local dimensional effects would exist if response rates to A following B were consistently higher (or lower) than to A following C. Research indicates that local dimensional effects appear at the time discriminative responding begins to develop (Malone & Rowe. in press). It should be noted that this is about the same time that local contrast appears. However, local dimensional effects
tend to disappear before local contrast. When present. local dimensional effects often take the form of a "contrast." That is, as similarity between one stimulus and an immediately preceding stimulus associated with different reinforcement frequency increases. the difference between their local response rates increases.
Overall Interaction Effects The overall interaction effects are defined as systematic variations in overall response rates in one component due to the presence of other components. An overall response rate is the rate associated with a given stimulus averaged across all of its presentations during an experimental session. It is, therefore, the average of all local response rates correlated with a specific stimulus. There are at least three types of overall interaction effects; these are induction, behavioral contrast, and dimensional contrast. Overall induction refers to a change in responding in one stimulus as a result of. and in the same direction as. a change in responding in another stimulus. Thus. induction could describe the situation in which several similar stimuli are not originally associated with reinforcement, but subsequent responses to one are reinforced, and as a result, the response rates for all of the stimuli increase. Behavioral contrast is an interaction effect that was first studied extensively by Reynolds (1961a, 1961b. 1961c) and by Reynolds and Catania (1961). This effect is opposite in direction to induction. That is, it involves a change in the response rate in one stimulus as a result of, and in a direction opposite to, a change in response rate in another stimulus. For example, Reynolds (1961b) reported that response rates in a variable-interval (VI) component increased when the reinforcement schedule in another component was shifted from VI reinforcement to extinction (EXT).
Behavioral contrast frequently accompanies successive discriminations. although Terrace (1963) showed that behavioral contrast may not accompany discriminations trained with his specific "learning without errors" procedure. When behavioral contrast does accompany successive discriminations. it first appears as the discrimination begins to develop, and it persists even after the discrimination is firmly established. Because of its relative permanence, behavioral contrast is occasionally referred to as a "sustained contrast" (e.g., Mackintosh. 1974) in order to distinguish it from local contrast, which is impermanent under some conditions (Malone, 1976) and therefore a "transient contrast. " Several researchers (Blough, 1975; Catania & Gill, 1964; Farthing, 1974; Hinson & Malone, 1980; Malone & Rowe, in press) have reported the overall interaction effect that Blough (1975) has called "di-
MULTIPLE·SCHEDULE INTERACTIONS mensional contrast." This effect is observed in discrimination training situations that use components associated with a number of stimuli from a single stimulus dimension. For example, Catania and Gill (1964) used a vertical column of 16 lights as a stimulus continuum. Each of the top eight lights (S+) was associated with fixed-interval reinforcement; each of the remaining eight lights (S-) was associated with extinction. This type of procedure often results in lower responding at S- values close to the S+ set as compared with other S- values somewhat farther removed from the S+ set (negative dimensional contrast); also, it shows higher responding at S+ values close to the S- set as compared with other S+ values somewhat farther removed from the S- set (positive dimensional contrast). Following another procedure, in which the extreme values of a stimulus dimension are S+s and all other values are S-s, negative dimensional contrast effects associated with each S+ region may appear in a W-shaped overall gradient (Hinson & Malone, 1980; Malone & Rowe, in press). Dimensional contrast appears during the early stages of discrimination formation (Catania & Gill, 1964; Hinson & Malone, 1980) and fades away as training continues. However, dimensional contrast (and local contrast) can be restored by changing the sequence of stimuli or by making the stimuli less discriminable (Catania & Gill, 1964;Malone, 1976). Spence's (1937) model of discrimination and generalization has considerable difficulty accounting for dimensional contrast. Blough (1975) has noted this and, in reaction, has offered an alternative model. He has shown that his model effectively deals with some of these problematic data. One objective of the following experiment was to extend a thorough application of Blough's model to data obtained from an additional dimensional contrast situation.
Overall andLocal Effects Local contrast and behavioral contrast are usually produced by the same experimental manipulations, and, as indicated above, they tend to appear at about the same stages in discrimination training. These facts suggest that the changes in overall responding (i.e., behavioral contrast) may simply be the sum of parallel changes in local responding (i.e., local contrast). Along these lines, Mackintosh (1974)has speculated that the initial appearance of behavioral contrast depends upon the concurrent appearance of local contrast. The new overall response rates, which were produced by local contrast and which comprise behavioral contrast, then become "conditioned." Finally, the underlying local effects disappear, but the behavioral contrast effect persists because of the conditioning. The research of Mackintosh, Little, and Lord (1972) provided a test of Mackintosh's position. This
117
research showed that inserting long (60-sec) time-outs between all stimulus presentations prevented local contrast from appearing, and when this was done, behavioral contrast did not appear either. But when local effects were allowed to appear, behavioral contrast effects appeared also. Mackintosh et al. took these observations to mean that the appearance of behavioral contrast depends upon the occurrence of local contrast. Although not elaborated upon, Mackintosh et al. 's data also revealed that when both interaction effects occurred, the magnitude of the behavioral contrast effect was substantially greater than (more than double) the maximal local contrast effect. This suggests that behavioral contrast may be more than the sum of concurrent, or previously occurring, local contrast effects (cf. Malone & Staddon, 1973). Therefore, it appears that interpretation of Mackintosh et aI.' s results is difficult, and that more data will be necessary to determine whether or not behavioral contrast is an epiphenomenon. The experiment below provides some of this additional information. In designing the present experiment, we assumed. that 30-sec time-outs placed between all stimulus presentations would be sufficient to eliminate local effects. Consequently, these were added to a successive discrimination that would ordinarily be expected to produce both behavioral contrast and local contrast. If local contrast were indeed eliminated, and if it is essential for the production of behavioral contrast, then neither should appear in this experiment. But, if behavioral contrast is independent of local contrast, then it should appear even without local contrast. Finally, if local contrast is not eliminated, then behavioral contrast's independence can still be indicated by a behavioral contrast effect considerably larger than the effects on overall response rates produced by the local effects. Along similar lines, dimensional contrast often appears in conjunction with local contrast and local dimensional effects (Malone & Rowe, in press). In addition, these interactions (particularly local contrast and dimensional contrast) tend to disappear under similar conditions and tend to be restored by the same methods. These observations suggest that dimensional contrast may also be determined by local effects. The third purpose of this experiment was to test this possibility; this, too, can be done by inserting time-outs to remove local effects. In this experiment, seven stimuli from a common stimulus dimension (a line tilt continuum) were presented in pseudorandom order. The stimulus at each extreme of the continuum was associated with reinforcement, whereas the five other stimuli were associated with extinction. It has previously been reported (Hinson & Malone, 1980; Malone & Rowe, in press) that the dimensional contrast effect produced by this procedure (without time-outs) appears in the
118
ROWE AND MALONE
form of a W-shaped overall gradient. This gradient, which is a maintained generalization gradient (cf. Rilling, 1977), is extremely stable from one day to another. If local effects are prevented in the present experiment by the insertion of time-outs, and if dimensional contrast depends upon local effects, then dimensional contrast will also be prevented from appearing. If so, responding in an S- that lies close on the continuum to an S+ would not be lower than responding in other S - s that are more distant from the S+. As a result, the overall gradient could not be W-shaped, but would instead be Ll-shaped or possibly V-shaped. Therefore, in the following experiment, U-shaped (or V-shaped) gradients will indicate that dimensional contrast is dependent upon local effects. But the occurrence of W-shaped gradients (when local effects have been eliminated) will indicate that dimensional contrast is independent of local effects.
Method Subjects Three Silver King (Birds 53,81, and 83) and two White Carneaux (Birds 62 and 55) pigeons were maintained at approximately 80lllo of their free-feeding weights. All of the birds had a long and varied experimental history. However, only two birds had had any previous exposure to line-orientation discriminations; this exposure ended about 4 years prior to the present experiment. Apparatus The experimental chamber was 41.5 x 34.5 x 38 em. The box was constructed of wood and Plexiglas and opened from the top. A 1.12-W houselight, which was situated in the center of the top panel. provided illumination throughout most of the experimental session. The houselight was extinguished during reinforcement (3 sec access to mixed grain). Located on one wall, 6.5 em above the floor. was a 5.5 x 5.5 em food aperture. Immediately above the food hopper was a 6-W light, which illuminated the feeder area during reinforcement deliveries. A transparent response key was fixed 12 cm above the top of the food aperture and 24 cm above the floor. A force of approximately .3 N was required to depress the key. A 6.3-V Grason-Stadler stimulus projector (equipped with 1.6-W bulbs), mounted behind the key, displayed line-orientation stimuli. Each of these stimuli consisted of a black bar on a white background. To eliminate extraneous noise. the operant chamber was enclosed in a soundproofed box. Also, a ventilation fan and a Gerbrands white noise generator operated throughout the experimental session. All programming and recording equipment was housed in an adjacent room.
Procedure Seven line-orientation stimuli [0 (horizontal), 15, 30, 45, 60, 75, and 90 deg (verticalj] were back-projected onto the transparent response key during 30"sec components. A 30-sec no-stimulus period. or time-out. followed each line-orientation presentation. During the time-out period, the houselight remained on, the response key was unlit, and reinforcement was never delivered. In all, there were 98 time-out periods within each experimental session. Line orientations appeared in a pseudorandom order, with each one being presented 14 times [except for the stimulus (0 deg) that began and ended the session, and was thus presented 15 times during the experimental session). Each stimulus followed every possible stimulus equally often (twice). The experiment consisted of two conditions. In the first condition (VII ALL), responses associated with any of the line orienta-
tions were reinforced according to a variable-interval (VI) 30-sec schedule. Once all of the birds were responding at a relatively stable rate (after 21 days), conditions were changed. The second condition (VI/EXT) was identical to the first, except that only responses associated with 0 and 90 deg (the S+s) were reinforced. Responses correlated with 15, 30, 45, 60, and 75 deg (the S-s) no longer led to reinforcement. The VI/EXT condition continued for approximately 50 sessions.
RESULTS
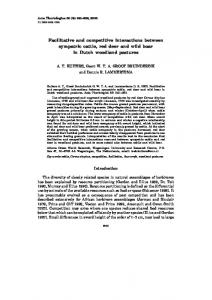
Dimensional Contrast and Local Effects Maintained generalization gradients for Days 1-3, 4-6, 10, 15, 20, 30, and 40 of the VI/EXT condition are shown in Figure 1. These gradients represent the pigeons' average response rates as a function of line orientation. The group average (which is shown) is representative of the data for the individual birds (which are not shown here). During the first day of VI/EXT, the group's overall gradient was relatively flat. By Day 2, however, a W-shaped gradient appeared in spite of the 30-sec time-outs. Between Days 3 and 6, the gradients became progressively sharper and the W-shape became more obvious. The W-shaped gradients persisted throughout the VI/EXT condition; however, it appeared that the form was gradually becoming a Ushape at the condition's end. Dimensional contrast shoulders thus appeared throughout the VI/EXT condition. Further analysis showed that response rates in 30 and 60 deg declined faster than was true of the other extinction stimuli. In particular, responding during these stimuli showed major declines on Days 2 and 3, while responding during 15,45, and 75 deg remained relatively unchanged. From Day 4 on, however, response rates in 15,45, and 75 deg gradually decreased to levels close to (but still above) 30 and 60 deg, Of the five S-s, responding was usually highest during 45 deg. It was this relatively high response rate in 45 deg that primarily accounted for the W-shaped appearance of the maintained gradient after the first few sessions. Furthermore, it was the slow but continuous decline in the response rates associated with 45 deg from Day 20 to Day 40 that accounted for the apparent trend toward a U-shaped gradient. While response rates in each S- declined over the first few days of VI/EXT, response rates to each S+ (i.e., 0 and 90 deg) increased. From Day 1 to Day 4, responding in 0 and 90 deg increased by about 70 responses/min. This large increase in responding illustrates positive behavioral contrast. After Day 15, response rates during 0 and 9O-deg presentations remained steady. Figures 2 and 3 and Table 1 allow an assessment of the effect that the 30-sec time-outs had in eliminating local effects among line-orientation stimuli. In particular, Figure 2 shows the effect that each line-
MULTIPLE-SCHEDULE INTERACTIONS DAYS: 4-6
1-3 200
Z
30
20
15
10
r
119
40
r
160
~