Multiple sclerosis in time and space ± geographic clues to cause. John F Kurtzke*,1,2. 1Neuroepidemiology Section, Veterans Affairs Medical Center, ...
Journal of NeuroVirology (2000) 6, Suppl 2, S134 ± S140
ã 2000 Journal of NeuroVirology, Inc.
www.jneurovirol.com
Multiple sclerosis in time and space ± geographic clues to cause John F Kurtzke*,1,2 1
Neuroepidemiology Section, Veterans Affairs Medical Center, Washington DC, USA and 2Department of Neurology, Georgetown University School of Medicine, Washington DC, USA Geographically MS describes three frequency zones. High frequency areas (prevalence 30+ per 100 000) now comprise most of Europe, Israel, Canada, northern US, southeastern Australia, New Zealand, and easternmost Russia. Medium frequency areas include southern US, most of Australia, South Africa, the southern Mediterranean basin, Russia into Siberia, the Ukraine and parts of Latin America. Prevalence rates under 5 per 100 000 are found in the rest of Asia, Africa and northern South America. Migrants from high to lower risk areas retain the MS risk of their birth place only if they are at least age 15 at migration. Those from low to high increase their risk even beyond that of the natives, with susceptibility extending from about age 11 to 45. Thus MS is ordinarily acquired in early adolescence with a lengthy latency before symptom onset. MS occurred in epidemic form in North Atlantic islands: probably in Iceland and the Shetland-Orkneys; clearly in the Faroe Islands. In the Faroes ®rst symptom onset was in 1943, heralding the ®rst of four successive epidemics at 13 year intervals. The disease was presumably introduced by occupying British troops during World War II, with the postwar occurrences representing later transmissions to and from consecutive cohorts of Faroese. What was transmitted is thought to be a speci®c, widespread, persistent infection called PMSA (the primary multiple sclerosis affection) which only rarely leads years later to clinical MS. Search for PMSA is best attempted on the Faroes where there are regions still free of MS after 50 years. Journal of NeuroVirology (2000) 6, S134 ± S140. Keywords: multiple sclerosis; prevalence; migration; epidemics; transmission
Introduction In recent years research into multiple sclerosis has included many epidemiologic inquiries. One de®nition of this ®eld is that epidemiology is the study of the natural history of disease (Figure 1). The epidemiologic unit is a person with a diagnosed disorder. The basic question, after diagnosis, is how common is the disease, and this in turn is delineated by measures of the number of cases (numerator) within de®ned populations (denominator). These ratios, with the addition of the time factor to which they pertain, are referred to as rates (Kurtzke, 1977). The population-based rates in common use are the incidence rate; the mortality rate, and the prevalence `rate'. The incidence or attack rate is
*Correspondence: JF Kurtzke, Neurology Service (127), Veterans Affairs Medical Center, 50 Irving Street, NW, Washington, DC, 20422, USA
de®ned as the number of new cases of the disease beginning clinically in a unit of time within the speci®ed population. This is usually given as an annual incidence rate in cases per 100 000 population per year. The mortality or death rate refers to the number of deaths with the disease as the underlying cause of death occurring within a unit of time and population, and thus an annual death rate per 100 000 population. The point prevalence `rate' is more properly called a ratio, and it refers to the number of the affected within the community at one point in time, again expressed per unit of population.
Prevalence rates in MS Prevalence studies provide our best information on the distribution of disease. However, they are expensive in time, people and money. Despite this,
Geographic clues to cause of multiple sclerosis JF Kurtzke
S135
Figure 1 Epidemiology. Content and uses. From Kurtzke 1974.
there are now well over 300 such surveys for MS. Almost all of them have been performed since World War II. To epitomize distributions, prevalence rates of 30 or more per 100 000 population were considered high frequency, those of 5 to 29 medium frequency, and rates under 5 per 100 000 were classed as low frequency MS. This trichotomy, made in the early 1960s, still seems to provide a valid overview. Prevalence in Europe Prevalence rates for Europe and the Mediterranean basin as of 1980 are shown in Figure 2, correlated with geographic latitude. This distribution then comprised of two clusters, one for high prevalence rates and one for medium rates. Taking only the best studies, the high prevalence band extended from 448 to 648 north latitude. The medium prevalence zone extended from 328 to 478 north, plus two sites (nos. 11, 12) from the west coast of southern Norway. The only high rate below 448 was that for a small survey of Enna, Sicily (no. 51j). However, as detailed elsewhere (Kurtzke, 1997), southern Europe and much of southwestern Norway are now high frequency regions. Figure 3 from Lauer (1994) summarizes the recent situation. In fact, both Portugal and Greece are also now high with prevalence rates in the 40s (Kurtzke and Wallin, 2000). Boiko (1994) of Moscow University has recently summarized a large literature on the distribution of MS in the former USSR which was unavailable in the west. Much of northwestern Russia down past Kiev and Moscow appears to be high prevalence, surrounded to the north, east and south by medium prevalence areas. Overall, the Ukraine and the Caucasus seemed to average in the medium prevalence range. Worldwide distribution The general worldwide distribution of MS still seems well described by a division into high,
Figure 2 Prevalence rates per 100 000 population as of 1980 for probable MS in Europe and the Mediterranean area, correlated with geographic latitude. Numbers identify studies in Kurtzke (1980). Solid circles represent best (Class A) surveys; open circles good (Class B); open diamonds poor (Class C); and solid diamonds estimates from ALS: MS case ratios (Class E). From Kurtzke (1980).
Figure 3 Prevalence rates per 100 000 population for MS in Europe and the Mediterranean basin from publications 1980 ± 94, modi®ed from Lauer (1994), with permission. From Kurtzke (1997).
medium and low regions, as proposed years ago. A `super high' class for prevalence of, say, 90+ seems not yet indicated. Figure 3 indicates how scattered such regions would be in Europe. The most recent distribution is shown in Figure 4. High frequency Journal of NeuroVirology
Geographic clues to cause of multiple sclerosis JF Kurtzke
S136
Figure 4 Worldwide distribution of MS as of 1998 with high (prevalence 30+; solid), medium (prevalence 5 ± 29; dotted), and low (prevalence 0 ± 4; dashed) regions de®ned. Blank areas are regions without data, or people. From Kurtzke and Wallin (2000).
areas comprise most of Europe into the former USSR, Israel, Canada and northern US, New Zealand and southeastern Australia. This also seems to include the easternmost part of Russia, as indicated by Boiko (1994). These high regions are bounded by areas of medium frequency with the prevalence rates of 5 ± 29 and mostly 15 ± 25 per 100 000, which then comprise most of Australia, southern US, the edge of southwestern Norway, northernmost Scandinavia, the southern Mediterranean basin, probably Russia from the Urals into Siberia as well as the Ukraine, South Africa, and perhaps much of the Caribbean region and parts of South America. All other known areas of Asia and Africa and possibly northern South America have prevalence rates under 5 per 100 000 population. A number of nationwide prevalence studies in Europe provide evidence for geographic clustering of the disease, which is stable over time, but with evidence of diffusion over time. This last seems also likely on an international basis as well.
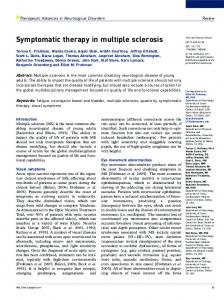
population of all ages, was 13 per 100 000 for immigration under age 15, which is the same medium prevalence rate as for the native-born English-speaking white South Africans (Kurtzke et al, 1970). But for age groups older at immigration, the prevalence was some 30 to 80 per 100 000, the same as expected from their high-risk homelands. This change was sharp and occurred exactly at age 15 (Figure 5). This indicates that natives of high risk areas are not susceptible to MS acquisition much before age 15, and that there is a long incubation period between acquisition and onset of symptoms. Inferences as to the opposite migration, low to high, were afforded by North African migrants to France (Kurtzke et al, 1998). Among some 7500 respondents with known place of birth who had completed a nationwide questionnaire survey for multiple sclerosis (MS) in France in 1986, there were 260 born in former French North Africa (Algeria, Morocco, Tunisia). They had migrated to France between 1923 and 1986, but 66% came between 1956 and 1964. Two-thirds were from Algeria, where virtually the entire European population had emigrated in 1962 at the end of the Algerian war for independence (Figure 6). Eight patients had unknown time or age at immigration or onset. The 225 migrants with onset more than 1 year after immigration provided an ageadjusted (US 1960) MS prevalence rate 1.54 times that for all France. If the latter is taken at 50 per 100 000 population, their estimated adjusted rate is 76.8 with 95% con®dence interval of 67.1 to 87.5.
Migration The fate of migrants who move into regions of differing risk of MS is critical to our understanding of the nature of this disease. If migrants retain the risk of their birthplace, then either the disease is innate, or it is acquired early in life. However, if upon moving they do change their risk, then clearly there is a major environmental cause or precipitant active in this disorder. And if such altered risk is also dependent upon age of migration, then we can de®ne not only external but also internal (personal) susceptibility. Further, if an age of susceptibility can be delineated in this manner, there may also be found a duration of exposure needed for acquisition. In a study of European immigrants to South Africa, the MS prevalence rate, adjusted to a Journal of NeuroVirology
Figure 5 Multiple sclerosis in migrants from northern Europe to South Africa by age at immigration (Y axis) and years between immigration and clinical onset (X axis) who were ascertained in 1960 MS prevalence survey of South Africa. Each patient is represented by a bar whose locus on Y axis+years from immigration on X axis indicates age at clinical onset. Diagonal re¯ects mean age at onset for this series. Modi®ed from Kurtzke et al (1970).
Geographic clues to cause of multiple sclerosis JF Kurtzke
S137
Figure 6 Multiple sclerosis in migrants from French North Africa (2/3 from Algeria) by age at immigration (Y axis) and years between immigration and clinical onset of MS (X axis). Each patient is represented by a solid circle whose locus re¯ects age at onset as the algebraic sum of age at immigration and years from immigration to onset. From Kurtzke et al (1998).
The other 27 with presumed acquisition in North Africa gave an estimated adjusted prevalence of 16.6 per 100 000 (95% CI 10.9 ± 24.1). For those migrants with acquisition in France there was a mean interval of 13 years between immigration or age 11 and clinical onset, with a minimum of 3 years. The oldest patient at immigration (age 48) was the only one to enter France in the ®fth decade of life. This series provides further support for the theses: (1) that MS is primarily an environmental disease acquired after childhood; and (2) that acquisition requires prolonged or repeated exposure (here 3 years for these medium-to-high MS risk migrants), followed by a prolonged latent or incubation period between acquisition and symptom onset (here 10 years).
Epidemics An epidemic may be de®ned as disease occurrence clearly in excess of normal expectancy and derived from a common or propagated source. Epidemics are divisible into two types: Type I epidemics occur in susceptible populations, exposed for the ®rst time to a virulent infectious agent. Type 2 epidemics occur in populations within which the virulent organism is already established (Paul, 1966). If the entire populace is exposed to a Type I epidemic, the ages of those affected clinically will de®ne the age range of susceptibility to the infection. Type 2 epidemics will tend to have a young age at onset, as the effective exposure of the patients will be greatest for those then reaching the age of susceptibility. Epidemics can of course be due to toxins and de®ciency states as well as infections, and allegorically may describe any
sudden increase in adverse health effects (auto accidents, myocardial infarction). If the causative agent of a `true' epidemic is persistent in an area, the epidemic will end when the number of susceptibles within the populace is exhausted. Any further cases would then be dependent on the arrival of new susceptibles ± by birth, age or immigration. If the agent is transient in occurrence, then new cases can arise after its disappearance only by transmission from those affected to new cohorts of the unaffected, so that successive epidemics in such an instance are limited de facto to the action of infectious agents. The occurrence of MS in the Faroe Islands was described as an epidemic in our ®rst presentation (Kurtzke and Hyllested, 1975). Iceland After our earlier work on the Faroes, an obvious question was what had happened with MS in Iceland. The same Norse Vikings had settled in Iceland at about the same time as the Faroes. Like the Faroes, Iceland had been a county of Denmark, but it had attained semi-independence in 1918. Also like the Faroes, it was occupied in World War II ± not only by the British, but also by Canadians and Americans. All known MS patients in Iceland with onset 1900 ± 1975 were collected, numbering 168 native resident Icelanders. Annual incidence rates reveal that there does seem to have been at least one de®nite Type 2 epidemic of MS in Iceland beginning in 1945. The average annual incidence rate from 1923 to 1944 was 1.6 per 100 000. For 1945 ± 54 it was signi®cantly higher at 3.2, and then it declined signi®cantly to 1.9 for 1955 ± 74. Most of the individual 5-year intervals from 1900 on had incidence rates signi®cantly below those of 1945 to 1949 or 1950 to 1954, and by ten-year intervals all showed the signi®cant difference (Figure 7). Furthermore, age at onset in the 1945 to 1949 interval (23 years) was signi®cantly lower than for any other quinquennium 1935 to 1969 (Kurtzke et al, 1982). The Shetland-Orkney Islands These islands off northern Scotland were once possessions of Denmark, and earlier in the Viking era had considerable occupations from Norway, as with Iceland and the Faroes. The islands have been formally surveyed as to the occurrence of MS ®ve times, as detailed elsewhere (Kurtzke, 1997). Incidence rates for each of Shetland and the Orkneys for 1911 ± 1985 have been presented (Kurtzke, 1997), and are summarized in Figure 8 for the both combined; the 1981 ± 1985 period was incomplete for the Orkneys. The occurrence after 1970 is signi®cantly lower than that for the prior 30 or 35 years. The individual annual incidence rates show considerable ¯uctuations, and do apparently differ in peaks and valleys somewhat between the Journal of NeuroVirology
Geographic clues to cause of multiple sclerosis JF Kurtzke
S138
Figure 8 Multiple sclerosis in the Shetland and Orkney Islands combined: average annual incidence rates per 100 000 population with 95% con®dence intervals, for consecutive 5 year periods 1911 ± 1980. From Kurtzke and Wallin (2000).
Figure 7 Multiple sclerosis in Iceland: average annual incidence rates per 100 000 population with 95% con®dence intervals on the rates for consecutive 10 year periods 1900 ± 1974. From Kurtzke et al (1982).
islands, but the overall impression of at least one epidemic between 1941 and 1970 seems valid, as does the clear decline after 1970 ± at least up to 1983 or 1986. The Faroe Islands The Faroe Islands comprise a group of 18 major volcanic islands lying in the North Atlantic Ocean at 78 west longitude and 628 north latitude. First settled by Norse Vikings in the ninth century, they had long been a standard county (amt) of Denmark. In 1948, the Faroes achieved semi-independence, though remaining part of the Kingdom of Denmark, which is still responsible for their health and welfare services. The population numbered over 44 000 in 1998. Cases of MS among the Faroese were subdivided according to their residence history, based on criteria ®rst de®ned in 1974. In order to avoid attributing to the Faroes the occurrence of disease that had in fact been acquired elsewhere, we had then decided to exclude from the resident series those we had a priori decided had lived `too long' off the islands before clinical onset: Persons off the Faroes for 3+ years before onset were thus to be Journal of NeuroVirology
excluded (group C); those not off (group A) or off less than 2 years (group B) were to be included. In the recent analyses, requirements for new exclusions (group C) have been made more stringent because of the potential for exposure to this disease in both Denmark and the Faroes for the latest cases. Almost all the foreign residences had been in Denmark. The foreign residences for group B showed little consistency in time to MS onset. On the other hand, the group C residences clustered within 10 years or so before clinical onset. From this we concluded that residence in a high risk MS area by a susceptible but virgin (as to MS) population for a period of 2 years from age 11 on, could result in clinical MS beginning after a further period of some 7 years (group C). Additionally, residence need not have been maintained in that endemic area for the entire interval. Thus, 7 years is a true incubation or latent interval between disease acquisition and symptom onset. Further, short periods of residence in the same place and at the same age did not result in MS (group B). By 1991 we had ascertained 42 cases of MS among native-born resident Faroese. We could not ®nd one single resident patient with clinical onset of MS in this century until July 1943. Then there were 16 patients with onset 1943 ± 49 and another 26 with onset thereafter (Kurtzke et al, 1993). Annual incidence rates per 100 000 population showed an early and dramatic rise and fall, followed by three irregular secondary peaks (Figure 9, top). The rate exceeded 10 per 100 000 in 1945. The ®rst question was whether this was a single epidemic with a very irregular tail, or whether the
Geographic clues to cause of multiple sclerosis JF Kurtzke
S139
Figure 9 MS in native resident Faroese. Annual incidence rates per 100 000 population calculated as 3-year centered moving averages as of June 1991. Upper panel: total series; lower panel: incidence rates by epidemic. From Kurtzke et al (1993).
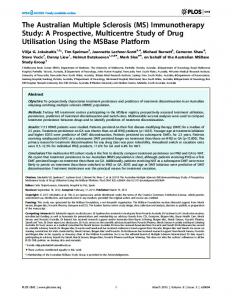
incidence rate curve in fact re¯ected separate epidemics. The migrant series considered above suggested that MS was acquired by Faroese only if they were at least 11 years of age at ®rst exposure, and only if the exposure was then for at least 2 years duration. Hence, we classi®ed the resident series according to the calendar time when the patients had attained age 11, whether by 1941 (2 years before ®rst clinical onset) or thereafter. In this fashion the material provided separation into four signi®cantly discrete subsets ± or epidemics. Annual incidence rates for the separate epidemics are drawn in Figure 9, bottom. The Faroes were occupied by British troops for 5 years from April 1940. During 1941 ± mid-1944 there were at least 1500 troops stationed on the islands. The most rigid and unbiased criterion for exposure of Faroese to British troops is that Faroese MS patients lived where the troops were billeted (Figure 10). It was clear the locations of troop encampments were strongly correlated with the place of residence of all MS patients,
Figure 10 British troop encampments in the Faroes in World War II (cross-hatched areas) and residence of Faroese MS patients in 1941 or at age 11 if then younger for patients known as of 1986, subdivided by epidemic: I (solid circles), II (triangles); III (squares). Numbers identify the patients in Kurtzke and Hyllested (1987). From Kurtzke and Hyllested (1987).
regardless of epidemic, including the fourth (not shown). Our conclusion was that British troops brought MS to the Faroese in the Faroe Islands during 1941 ± 1944. It was also clear the disease had not spread throughout the islands. In formal testing of troop locations versus residence of patients of epidemics I ± IV an odds ratio (OR) of 20.43 was calculated (P50.001); versus epidemics II ± IV the OR was 9.00 (P50.01). There was also a highly signi®cant association between residence of patients of epidemics II ± IV and that of epidemic I: OR=32.63 (P50.001) (Kurtzke et al, 1993). Therefore, this disease has remained geographically stable on the Faroes for half a century, and the MS risk areas remain in essence those de®ned by British troop occupation sites of World War II. The principal conclusion from the Faroes work, and one compatible with other epidemiologic evidence, is that clinical neurologic MS (CNMS) is Journal of NeuroVirology
Geographic clues to cause of multiple sclerosis JF Kurtzke
S140
the rare late manifestation of infection with what we call PMSA ± the primary MS affection. In this concept PMSA is transmissible; CNMS is not. Evidence as to the characteristics of PMSA derives entirely from the epidemiologic features of CNMS. Among Faroese, these indicate that some 2 years of exposure to PMSA are necessary before its acquisition; Faroese under age 11 are not susceptible; and once PMSA is acquired, those Faroese who develop CNMS do so after an average incubation period of some 6 or 7 years (Kurtzke et al, 1993). Transmission models were ®rst devised to explain three separate consecutive epidemics of CNMS: there must have been separate consecutive cohorts of the population who acquired PMSA (Kurtzke and Hyllested, 1987). The ®rst Faroese cohort (F1) would have acquired PMSA from the British troops during the occupation of World War II. However, since the troops had left the islands by then, the second (F2) Faroese cohort with epidemic II must have acquired the disease from the F1 cohort, and then in turn transmitted PMSA to a third (F3) Faroese population cohort for epidemic III. If this were true, then the expectation was that the F3 cohort would transmit PMSA to a fourth cohort, and this would be demonstrated by the occurrence of a fourth epidemic of CNMS ± which is what happened (Kurtzke et al, 1993). The way in which we were able to construct separate cohorts out of the continuum, which is the
Faroese population over time, was to de®ne an age beyond which PMSA would not be transmissible, and we took this age to be the average age of symptom onset of CNMS in general, age 27. This permitted the formation of new cohorts over time for Faroese: age 11 ± 12 susceptible to PMSA; age 13 ± 26 affected and transmissible. If these ®ndings are valid, these studies would indicate the de®nition of MS as not only an acquired disease but also a transmissible one. What we believe is transmissible is a widespread speci®c (but unknown) persistent infection of adolescents and young adults called PMSA, which only rarely leads to clinical neurologic MS after years of incubation. Further, prolonged exposure (at least 2 years) is required to acquire PMSA. Our best guess as to its nature at this time is an unde®ned (retro) virus, for which the best place to seek it is in the Faroes, since there is in those islands a unique control group: there are parts of the Faroes which are still free of CNMS, even after 50 years of disease.
Acknowledgments Supported by Neuroepidemiology Research Program, VAMC Washington DC
References Boiko AN (1994). Multiple sclerosis prevalence in Russia and other countries of the USSR. In: Multiple Sclerosis in Europe. An Epidemiological Update. Firnhaber W, Lauer K (eds). LTV Press: Darmstadt, pp 219 ± 230. Kurtzke JF (1974). Neurologic needs of the community. In: Neuroepidemiology. American Academy of Neurology Special Course 1974. Kurtzke JF (ed). Education Marketing Corp: Minneapolis, MN, pp 61 ± 65+tape cassette. Kurtzke JF (1977). Multiple sclerosis from an epidemiological viewpoint. In: Multiple Sclerosis: A Critical Conspectus. Field EJ (ed). Medical and Technical Publishing Press Ltd: Lancaster, England, pp 83 ± 142. Kurtzke JF (1980). Geographic distribution of multiple sclerosis: An update with special reference to Europe and the Mediterranean region. Acta Neurol Scand 62: 65 ± 80. Kurtzke JF (1997). The epidemiology of multiple sclerosis. In: Multiple Sclerosis: Clinical and Pathogenetic Basis. Raine CS, McFarland H, Tourtellotte WW (eds). Chapman and Hall: London, pp 91 ± 139. Kurtzke JF, Hyllested K (1975). Multiple sclerosis. An epidemic disease in the Faeroes. Trans Am Neurol Assoc 100: 213 ± 315. Kurtzke JF, Hyllested K (1987). Multiple sclerosis in the Faroe Islands. III. An alternative assessment of the three epidemics. Acta Neurol Scand 76: 317 ± 339. Journal of NeuroVirology
Kurtzke JF, Wallin MT (2000). Epidemiology. In: Multiple Sclerosis: Diagnosis, Medical Management and Rehabilitation. Burks JS, Johnson KB (eds). Demos Medical Publishing Inc: New York, in press. Kurtzke JF, Dean G, Botha DPJ (1970). A method of estimating age at immigration of White immigrants to South Africa, with an example of its importance. S Afr Med J 44: 663 ± 669. Kurtzke JF, Gudmundsson KR, Bergmann S (1982). Multiple sclerosis in Iceland: 1. Evidence of a postwar epidemic. Neurology 32: 143 ± 150. Â (1993). Kurtzke JF, Hyllested K, Heltberg A, Olsen A Multiple sclerosis in the Faroe Islands. 5. The occurrence of the fourth epidemic as validation of transmission. Acta Neurol Scand 88: 161 ± 173. Kurtzke JF, Delasnerie-LaupreÃtre N, Wallin T (1998). Multiple sclerosis in North African migrants to France. Acta Neurol Scand 98: 302 ± 309. Lauer K (1994). Multiple sclerosis in the old world: the new old map. In: Multiple Sclerosis in Europe. An Epidemiological Update. Firnhaber W, Lauer K (eds). LTV Press: Darmstadt, pp 14 ± 27. Paul JR (1966). Clinical Epidemiology. Revised Edition. University of Chicago Press: Chicago, p. 60.