MULTIPLE SCLEROSIS: WHERE DO WE GO FROM HERE? *Marta Tejera-Alhambra,1 Lidia Fernández-Paredes,2 Clara de Andrés,3 Silvia Sánchez-Ramón2 1. Medical Department, Inmunotek, S.L., Madrid, Spain 2. Department of Clinical Immunology, Hospital Clínico San Carlos, Madrid, Spain 3. Department of Neurology, Hospital General Universitario Gregorio Marañón, Madrid, Spain *Correspondence to
[email protected] Disclosure: The authors have declared no conflicts of interest. Received: 07.01.16 Accepted: 05.04.16 Citation: EMJ Neurol. 2016;4[1]:84-95.
ABSTRACT Multiple sclerosis (MS) is the most common cause of neurological disability in young populations after trauma and represents a significant personal, social, and economic public health burden. The clinical course and response of MS to therapy is highly heterogeneous, but most patients progress from a relapsing-remitting disease course, in which patients may respond to immunomodulatory drugs, to a steady progression and neurodegeneration that is unresponsive to any currently available treatment. In the last few years, novel disease-modifying therapies for MS have become available but the aetiology of the disease remains an enigma. The search for clinical biomarkers that are able to stratify MS patients and allow the personalisation of treatment strategies, has developed greatly in recent years though only a few have been integrated into routine clinical practice. Keywords: Multiple sclerosis (MS), biomarkers, clinical activity.
HISTORICAL PERSPECTIVE OF MULTIPLE SCLEROSIS The first description of multiple sclerosis (MS) dates back to the 14th Century, but it was not until the 19th Century that the first anatomopathological descriptions were made. In 1838, the first report associating the presence of demyelinating lesions with clinical features was published. This discovery was published following an 1835 report of clinical findings, which would subsequently become associated with MS, in a patient who later developed demyelination.1 Some decades later, in 1868, the French pathologist and founder of modern neurology Jean-Martin Charcot formally described the disease entity as ‘sclérose en plaques’ and first detailed the correlation between clinical and post mortem findings.1 By 1955, descriptions of the disease had expanded, due to the discovery of the ‘disseminated’ expansion of lesions in the central nervous system (CNS), and due to the ‘multiple’ lesions and episodes of neurological dysfunction.1 While the French still conserve the original name given by Charcot, the most commonly used label
84
NEUROLOGY • July 2016
for the disease is multiple sclerosis. Thomas Rivers was the first to induce experimental autoimmune encephalomyelitis (EAE), the animal model of MS; in 1933, Rivers repeatedly injected brain emulsions and extracts from rabbits into primates, inducing the development of CNS demyelinating lesions. This finding, an immune response in the CNS myelin of mammals, suggested an autoimmune aetiology, with a mechanism of injury relating to chronic inflammation as a result of the presence of self-antigens. In 1948, Elvin Kabat described ‘increments’ in the oligoclonal immunoglobulins (Ig) within the cerebrospinal fluid (CSF) of patients with MS, sustaining a local inflammatory nature of the disease.2 The aetiology of MS remains elusive, though several immunomodulatory disease-modifying therapies (DMTs) have shown efficacy in altering the course of the relapsing form of MS, and delaying neurological deterioration, although the mechanisms of action of these drugs are not fully understood. Unfortunately, there is still no effective therapy for the progressive forms of MS.
EMJ EUROPEAN MEDICAL JOURNAL
EPIDEMIOLOGY OF MULTIPLE SCLEROSIS MS can be defined as a chronic inflammatory demyelinating disease of the CNS in which repeated episodes result in the formation of persistently demyelinated plaques of glial scar tissue, associated with varying degrees of axonal loss.3 Anatomopathologically, it is characterised by the loss and disruption of the myelin sheath that surrounds the axons in the brain and spinal cord, producing multifocal lesions in the CNS white matter,4 which can lead to axonal degeneration and progressive neurological dysfunction. Common symptoms include visual disturbances, loss of balance and co-ordination, spasticity, sensory disturbances, bladder and bowel incontinence, pain, weakness, fatigue, and paralysis. MS therefore severely compromises the quality of life of the patient and their family and has a large adverse socioeconomic impact on MS patients, their families, and society as a whole.
Incidence and Prevalence MS is the most common neurological disease that causes disability in young adults.5 The disease has an increasing prevalence worldwide, which may be attributable to environmental factors or to increasing awareness and more accurate diagnosis. According to the Atlas of MS, updated in 2013 by the Multiple Sclerosis International Federation, the number of people with MS has increased from 2.1 million in 2008 to 2.3 million in 2013. The median estimated prevalence worldwide is 33 per 100,000 inhabitants,6 and median estimated incidence is 2.5 per 100,000 inhabitants.7 Prevalence varies greatly; North America and Europe have the highest prevalence with 140 and 108 per 100,000, respectively, whereas in SubSaharan Africa and East Asia the figures are 2.1 and 2.2 per 100,000, respectively.6 Data from this atlas generally confirm the observation by John Kurtzke in 1975, stating that MS prevalence increases the further a country is from the equator. A North-to-South gradient of declining prevalence of MS seems to be present in Europe, but there are several exceptions to this rule. For instance, Southern European countries like Spain and Italy have recently seen an increase in MS prevalence (>100 per 100,000).6
NEUROLOGY • July 2016
Age of Onset and Sexual Dimorphism in Multiple Sclerosis Although the age of onset varies widely within the disease, clinical manifestations normally start at childbearing age, ~30 years of age.6 Children can also suffer from MS; ~3% of MS patients experience their first symptom prior to age 18 years.8 As observed in other autoimmune diseases,9 MS more frequently affects young women than men (ratio 2:1).6,7 This female predominance is thought to be due to environmental rather than genetic factors. Potential factors underlying the sexbias in MS are the effects of sex hormones on immune responses10,11 and the differential distribution of sex hormone receptors in immune cell subsets.12,13 Interestingly, the disease course of MS is modified by pregnancy and decreases after menopause.14 During pregnancy the frequency of MS relapses clearly decreases, with a subsequent surge postpartum.15
NATURAL HISTORY OF MULTIPLE SCLEROSIS Clinical Course MS is a clinically heterogeneous disease, which varies according to the location of plaques in the CNS. Eighty percent of MS patients present with an acute attack, known as clinically isolated syndrome (CIS), which can affect one or several CNS sites.16 The most commonly affected sites in CIS include the optic nerve, spinal cord, brainstem, and cerebellum; in some rare cases the cerebral hemisphere may be affected.17 Thus, the most common symptoms include unilateral optic neuritis with visual disturbances; with paraesthesias in the extremities, and weakness in the feet or hands reflecting sensory and motor dysfunction of the spinal cord, respectively. When white matter lesions are detected by magnetic resonance imaging (MRI), the risk of suffering a second relapse increases.18 New attacks occur with different frequencies, but on average rarely exceed 1.5 episodes per year.19 Most patients with CIS develop relapsing–remitting multiple sclerosis (RRMS) within 5 years of onset, and a majority of patients with RRMS (~65%) develop secondary progressive multiple sclerosis (SPMS) after a median of 10–15 years from disease onset.16,20 RRMS is characterised by recurrent relapses with total or partial recovery and an inflammatory course that can be modified with therapy. Around 20% of patients have a progressive onset
EMJ EUROPEAN MEDICAL JOURNAL
85
without relapses, known as primary progressive multiple sclerosis (PPMS).19 Some MS patients present a milder form of the disease and are defined as ‘benign MS’ patients. Due to the difficulty in predicting disease progression, it takes decades after the initial diagnosis to know if a course is benign. The term ‘benign MS’ is somewhat controversial since it has classically been based mainly on changes in motor functions.21 These patients may have normal employment and domestic activities for some decades, however studies have shown that over a number of years, their cognitive function deteriorates and they suffer fatigue, pain, and depression that negatively impacts their quality of life.22-24 RRMS and PPMS show different clinical courses. RRMS patients traditionally display a ‘twostage’ disease: a first stage in which there is a predominance of inflammation (relapses and remissions) compared with SPMS, and a second stage with predominant neurodegeneration and progression (demyelination and axonal loss). However, this classical timeline view is no longer so clearly demarcated, as neuroimaging studies have shown the coexistence of inflammation and neurodegeneration from the onset of the disease.25 In addition, recent studies indicate that inflammation is abundant in PPMS and correlates with axonal damage and disease progression,26 involving follicular T helper (Th) cells, Th17, and activated B cells.27 The presence of meningeal inflammation is associated with an increased rate of clinical progression in PPMS.28,29 Therapeutic strategies differ depending on the target phase of the disease: immunomodulatory therapies combat inflammation in the inflammatory phase and neuroprotective agents fight against myelin/neural degeneration in the progressive phase. By contrast, PPMS patients present with a steady progression and degeneration from the onset of disease. Acute inflammation occurs during relapses with partial or complete remyelination during remissions, but progressive neurodegeneration leads to a higher brain volume loss and clinical disability. For the SPMS and PPMS clinical forms, treatments available to date are unable to stop the progression of the disease.
Prognosis A review of large long-term studies in MS has identified different prognostic factors associated
86
NEUROLOGY • July 2016
with MS disability and progression.30 For RRMS patients, negative prognostic factors identified were a higher initial relapse rate, a shorter interval to the second relapse, a higher level of disability in the first 5 years, and the involvement of more systems. A shorter time-to-progression is typical in SPMS, while PPMS demonstrates a faster rate to disability in the first 2 and 5 years and the involvement of more than three systems. The presence of these prognostic factors does not necessarily imply disability as there is a large variability in patient outcomes.30 A recent study by Tintore et al.31 that included 1,015 CIS patients with a mean follow-up of 6.8 years, identified that the number of lesions (≥10) detected by MRI and the presence of oligoclonal bands (OCB) are prognostic factors for the development of MS and early disability. The life expectancy and prognosis for MS patients is highly variable. Recently a large study32 identified that life expectancy is reduced by 7 years in MS patients compared with matched healthy controls, and that mortality from both infectious diseases and diseases of the respiratory system is higher in MS patients. The symptoms of MS are lifelong, painful, and debilitating; the treatment and prevention of comorbidities in MS should therefore be considered in the management of these patients to improve their condition, survival, and quality of life.
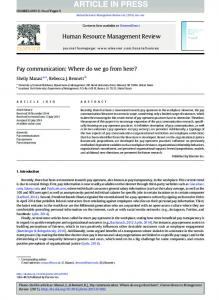
AETIOPATHOLOGY The aetiology of MS is still unresolved. A number of theories have been proposed as to the nature of the disease, including origins of autoimmune, infectious, genetic, metabolic, dietary, or neurodegenerative nature. None of these hypotheses alone can explain the clinical heterogeneity of the disease, therefore it is more probable that all of these factors contribute to the generation and maintenance of the disease to some extent. The major aetiopathogenic factors known to be involved in MS disease are summarised in Figure 1 and Table 1. MS is currently considered a complex disorder, which is triggered in genetically susceptible individuals by different environmental and stochastic factors.33 Environmental factors, such as vitamin D levels, excessive hygiene during childhood, and neurotropic viruses have all previously been widely associated with MS aetiology. Different pieces of evidence suggest that the disease might be
EMJ EUROPEAN MEDICAL JOURNAL
triggered by an infectious agent and evolve into an immune-mediated chronic disease, however to date no virus has been isolated or directly linked with MS. The immune system also plays an important role in MS pathophysiology. This is supported by diverse facts: • Susceptibility to MS is linked to important genes of the immune response • MS lesions are crowded with inflammatory lymphocytes and macrophages • OCB of Ig are present in the CSF of most MS patients • Available DMTs target inflammation in the CNS, reducing the number of relapses and lesions detected by MRI, although they are not effective in attenuating the neural damage observed in disease progression The most accepted theory for MS is that autoreactive T lymphocytes directed against myelin peptides reach the CNS by crossing the blood brain barrier (BBB), and triggering the pathological events that lead to demyelination and axonal damage. This insult to axons can be mild and reversible or severe and irreversible, with transection and likely loss of neuronal function. The contribution of the target organ, the CNS, has been almost completely ignored in the literature.33 Pathological and imaging studies,34 as well as research on the molecular aspects of the disease, in EAE and MS patients, now provide further evidence that CNS-specific factors are important.35 In summary, MS is a complex autoimmune disease with multiple intrinsic and extrinsic factors
• • •
• •
Familial history of MS HLA association: HLA-DR15 and HLA-DR4 Other risk genes: IL-2RA, IL-7RA, CD58
Sexual dimorphism (affects incidence and severity) Pregnancy (relapse rate is decreased during pregnancy)
that may trigger autoreactivity to self-antigens in the CNS.33
RISK FACTORS ASSOCIATED WITH MULTIPLE SCLEROSIS Environmental risk factors include, among others, infections, smoking, and vitamin D status (Table 1). Smoking or exposure to cigarette smoke contributes to both increased disease susceptibility and more rapid disease advancement. The relative risk for MS development is approximately 1.5-times higher for smokers compared with nonsmokers.36 Epstein–Barr virus (EBV) infection is considered a risk factor for MS; higher rates of EBV infection have been observed in children with MS compared with age-matched controls.37 Individuals who acquired EBV in adulthood had a 2 to 3-fold higher risk of MS.38 The geographical distribution of MS also correlates with the duration and intensity of sun exposure;39 some large longitudinal studies support an inverse association between vitamin D and risk of MS.40,41
DIAGNOSIS OF MULTIPLE SCLEROSIS The cornerstone of MS diagnosis is based on clinical evidence from a detailed neurological history and physical examination. Symptoms and signs of disorder in the motor, sensory, visual, and autonomic systems, as well as many others may be observed. The diagnosis of MS relies on the demonstration of disease dissemination in space (at least two independent CNS lesions) and time (two or more episodes of neurological dysfunction separated by at least 30 days).19
Enviromental factors
Genetic factors
CNS-specific factors Immunoregulatory defects
Hormonal factors
• • •
Migration Infectious triggers Vitamin D
•
Suppression defect of regulatory T lymphocytes Oligoclonal B cell activation T cell activation defects
• • MS
Figure 1: Factors affecting the development of multiple sclerosis. HLA: human leukocyte antigen; IL: interleukin; CNS: central nervous system; MS: multiple sclerosis.
NEUROLOGY • July 2016
EMJ EUROPEAN MEDICAL JOURNAL
87
Table 1: Aetiopathology of multiple sclerosis. Environmental factors Migration
MS development risk is associated with the place of residence in childhood42
Hygiene hypothesis
Sanitation level of the surrounding environment during childhood may affect the risk of later developing MS43 An increase in MS incidence is associated with a reduction in intestinal parasitic infections44
Neurotropic viruses
HHV-6 is only expressed in the oligodendrocytes from MS plaques45 HHV-6 DNA seems to correlate with exacerbations in the RRMS phase46 Children with MS with EBV seem to be infected at higher rates than their age-matched controls47 Molecular mimicry between myelin basic protein and an EBV peptide may be a pathophysiological mechanism to induce demyelination48 IgG against other neurotropic viruses as measles, rubella, and varicella zoster have been reported in the CSF of MS patients49
Vitamin D
The geographical distribution of MS correlates with the duration and intensity to sun exposure39 Large studies have found that taking vitamin D supplements and having high serum levels of 25(OH)D protects against MS40,41
Genetics Familial studies
Twin studies have reported concordance rates of MS of ~25% for monozygotic twins and ~5% for dizygotic twins.50 Non-twin-siblings have a 20 to 40-fold increased risk
MHC II risk alleles DRB1*1501 allele: strongest and most replicated genetic association with MS51 Being heterozygous for the DRB1*1501 allele increases the risk of MS by 3-fold and homozygosity by over 6-fold52 DR3 and DR4 haplotypes: present in Sardinian and other Mediterranean MS patients53,54 Non-MHC II risk alleles
IL-2RA,55 CD58,56 STAT3,57 IL-7RA58
Immunoregulatory defects Treg cells
Defective suppressive function of Treg cells59 Natural Treg cell thymic output is diminished compared to that of healthy controls59,60 Decreased expression of FoxP3 levels in Treg cells from MS patients, with decreased function61
Oligoclonal B cell B cells abnormally activated in meningeal follicles differentiate to plasma cells that produce activation intrathecal immunoglobulins detected as OCB in most MS patients62
MS: multiple sclerosis; HHV-6: human herpes virus 6; RRMS: relapsing–remitting multiple sclerosis; EBV: Epstein–Barr virus; MBP: maltose-binding protein; IgG: immunoglobulin G; CSF: cerebrospinal fluid; 25(OH)D: 25-hydroxy vitamin D; MHCII: major histocompatibility complex class II; STAT3: signal transducer and activator of transcription 3; IL: interleukin; OCB: oligoclonal bands; Treg: regulatory T cells.
The introduction of Poser criteria63 for diagnosis divided MS patients in two major groups: ‘definite’ and ‘probable’. These groups are defined by either a clinical or laboratory-supported diagnosis. The criteria also allowed the classification of MS patients according to the number of attacks, clinical and paraclinical evidence, and CSF OCB or increased IgG index. The Poser criteria were developed before MRI scans and were superseded by the McDonald criteria,64 which underline the importance of MRI in the diagnosis of MS and allow earlier diagnosis of patients with CIS. The McDonald criteria were published in 2001 and
88
NEUROLOGY • July 2016
were revised in 2005 and 2010.65,66 The revision from 2005 included changes focussing on demonstrating dissemination of lesions in time, clarification of the use of spinal cord lesions, and simplification of PPMS diagnosis.65 The 2010 revision was written with the objective of simplifying and accelerating diagnosis; the criteria relating to use of imaging techniques for demonstrating the dissemination of CNS lesions in space and time was simplified, and the applicability allowed an earlier diagnosis and more uniform use in populations other than Western Caucasian adults.66
EMJ EUROPEAN MEDICAL JOURNAL
Clinical The cornerstone of the MS diagnosis continues to be based on clinical evidence from a detailed neurological history and physical examination, but paraclinical tests are useful in establishing an accurate MS diagnosis. Some symptoms and signs of dysfunction to the motor, sensory, visual, and autonomic systems can be observed, but many others can occur. There are two characteristic clinical symptoms of MS: Lhermitte’s sign (electrical sensation that runs down the spine or limbs on neck flexion) and Uhthoff’s phenomenon (transient worsening of symptoms when the body temperature increases, for instance following exercise or a hot bath).19 Although these symptoms are considered MSspecific they may be present in other diseases. Because MS shares clinical manifestations with other conditions, the differential diagnosis and exclusion of other diseases is an integral part of MS diagnosis.67 Paraclinical features can help establish diagnosis.
Magnetic Resonance Imaging MRI is one of the main tools for supporting and accelerating MS diagnosis due to its availability and sensitivity. White matter abnormalities are characteristic and demonstrated in >95% of MS patients. MRI shows the anatomical dissemination of lesions and if used serially over time, can highlight newly developed plaques in the absence of clinical episodes.19 MRI provides information about the histopathology of MS lesions. The pathological hallmark of MS is focal demyelination in the lesions, with variable degrees of inflammation, demyelination, gliosis, and axonal injury.68 The site of the lesion is very important for MS diagnosis, as MS lesions are commonly located in the brainstem, spinal cord, cerebellum, and periventricular white matter.69 Typical MRI protocols include T1-weighted (T1) imaging with and without gadolinium (Gd) administration, T2-weighted (T2 imaging), protondensity (PD), diffusion-weighted imaging and calculation of the apparent diffusion coefficient, in which active plaques may demonstrate restricted diffusion,70 and fluid-attenuated inversion recovery techniques (FLAIR).71 In T2 scans lesions are highlighted by hyperintense regions whereas in T1 scans lesions are highlighted by hypointense regions. T2, PD, and FLAIR demonstrate the most severely demyelinated lesions well.71 In the acute
NEUROLOGY • July 2016
phase, T1 hypointensity reflects oedema and demyelination, which disappears when inflammation attenuates. On the contrary, chronic foci of T1hypointensity (known as black holes) reflect persistent axonal loss.72 Typically, several T2-hyperintense lesions are commonly observed in MS patients; characteristic abnormalities on T2 images occur in >95% of patients with clinically definite MS, and in 50–70% with a CIS.73 MRI positivity alone cannot provide a correct diagnosis because lesions are not exclusively characteristic of MS disease, and also appear in people without clinical signs of disease and in people >50 years old. However, lesions detected in the spinal cord are abnormal at any age.19 Gd enhancement in T1 imaging indicates active lesions, inflammation, and evidence of breakdown of the BBB.68 Cortical atrophy may also be prominent and correlates with cognitive impairment. Active white matter lesions are classified according to the four observable distinct patterns that originate from different pathophysiological mechanisms.74 Pattern IV lesions, for instance, are found in ~5% of PPMS patients.74 Some authors have recently stated that patients with one pattern of lesion conserve it throughout their disease course, while others have described a progression from heterogeneity in lesions to homogeneity over the disease course.74 Despite controversies concerning lesion heterogeneity, it is clear that as the disease progresses, active lesions become fully demyelinated and convert to an inactive morphology.74 Recent guidelines recommend the use of MRI for prognostic and therapy monitoring tasks.75 New MRI techniques such as volumetric MRI and magnetisation transfer ratio (MTR) are now available. Volumetric MRI allows measurement of brain and spinal cord atrophy in MS and progressive atrophy may have potential as a marker of progression in the monitoring of MS patients.76 MRI cannot effectively detect cortical demyelination in MS patients but recent studies have shown that MTR imaging is sensitive to cortical lesions in these patients.77,78
Cerebrospinal Fluid A lumbar puncture can be performed to better elucidate the aetiology of a clinical episode. The detection of two or more OCB of IgG in the CSF (and not in the serum of MS patients) is the
EMJ EUROPEAN MEDICAL JOURNAL
89
most important CSF test finding, and is a red flag in MS diagnosis, as OCB are seen in most patients (>90%).19 OCB reflect intrathecal Ig synthesis, however the detection of OCB is not exclusive to MS and has diagnostic value only once other causes of CNS inflammation have been excluded.19 Complementary tests are available, such as the IgG index (IgG index = [IgG (CSF) / IgG (serum)] / [Albumin (CSF) / Albumin (serum)]), which is increased in 80% of patients (ratio >0.7), and measures of cell count (50% with >4 white cells/µL, but only 1% with cell counts >35/µL);19 these complementary tests are useful in the differential diagnosis of MS.
BIOMARKERS IN MULTIPLE SCLEROSIS DISEASE MS is not only heterogeneous in its clinical manifestations and forms, but also in disease course and response to therapy. The search for reliable biomarkers that help in the diagnosis, stratification, treatment response, and prediction of MS clinical disability has developed greatly in recent times. The number of available DMTs for MS has increased sharply in recent years, but biomarkers monitoring treatment response, adverse effect risk, and disease progression, and classifying clinical forms of MS, are still lacking. These biomarkers would enable more personalised treatment, something that is urgently needed.
Table 2: Actual and promising novel body fluid biomarkers for diagnosis, prognosis, subtyping, and therapeutic response evaluation of multiple sclerosis. Biomarkers
Source
MS findings
IgG OCB
CSF
Increased in MS but with low specificity
IgG index
CSF/Blood
Increased ratio (>0.7) in MS
MBP-MOG antibodies
Blood
Increased levels in MS patients
Vitamin D
Blood
Decreased levels in MS
Neurofilament light chain
CSF
Increased levels in MS patients
Anti-aquaporin-4
Blood
Differential diagnosis: Present in patients affected by NMO, absent in MS
CSF/serum albumin ratio
CSF/blood
Differential diagnosis: Increased in NMO
N-acetylaspartate
Blood/CSF
Differential diagnosis: Increased in MS in respect to NMO
Diagnostic
Prognostic
90
MBP and MOG antibodies Blood
Increased levels in patients developing MS after the first CIS episode
Chitinase-3-like protein 1
CSF
Increased levels in patients developing MS after the first CIS episode
Kappa-free light chains
CSF
Increased levels in patients developing MS after the first CIS episode
IgM OCB
CSF
Increased levels in patients developing MS after the first CIS episode Correlation with disability progression: aggressive course
MRZ-specific IgG antiviral antibodies
CSF
Increased levels in patients developing MS after the first CIS episode (higher specificity than IgG OCBs)
Chemokine ligand 13
CSF
Increased levels in patients developing MS after the first CIS episode, but not specific
Epstein–Barr virus antibodies
Blood/CSF
Increased specific IgG antibodies in MS patients with an early disease onset
VEGF-A
Blood monocytes
Diminished mRNA expression in SPMS compared with RRMS
NO metabolites
CSF
Increments correlate with high disability progression
Neurofilament heavy chain
CSF
Increased in progressive forms of MS
Tubulin/actin
CSF
Increased in progressive disease forms
Glial fibrillary acidic protein
CSF
Increased in SPMS patients with respect to RRMS
Brain-derived neurotrophic factor
CSF
Decreased in SPMS patients with respect to RRMS
NEUROLOGY • July 2016
EMJ EUROPEAN MEDICAL JOURNAL
Table 2 continued. Biomarkers
Source
MS findings
miR-223, miR-23a, miR-15b
Blood
Decreased in PPMS
HGF, CCL11
Blood
Increased in progressive forms of MS
EGF, CCL4
Blood
Decreased in progressive forms of MS
bFGF
Blood
Decreased in PPMS patients
VEGF
Blood
Increased in SPMS patients
MBP-MOG antibodies
Blood
Good responders to B cell target therapy
Vitamin D
Blood
Increased in IFN-β responders
Neurofilament light chain
CSF
Levels raise to normal in natalizumab responders
Brain-derived neurotrophic factor
Cell culture
Increased levels in glatiramer acetate treated patients
Neutralising antibodies against IFN-β
Blood
Present in IFN-β non-responders
Neutralising antibodies against natalizumab
Blood
Present in natalizumab non-responders
VZV antibodies
Blood
Recurrence risk of infection in previously VZV-infected MS patients receiving fingolimod treatment
Anti-JCV
Blood
Risk of developing progressive multifocal leukoencephalopathy in patients infected by JCV receiving natalizumab treatment
Subtype specific
Therapeutic response
Ig: immunoglobulin; MRZ: measles, rubella, and varicella zoster viruses; CSF: cerebrospinal fluid; MS: multiple sclerosis; MBP: myelin basic protein; MOG: myelin oligodendrocyte glycoprotein; NMO: neuromyelitis optica; CIS: clinically isolated syndrome; MR2: mouse monoclonal receptor; VEGF-A: vascular endothelial growth factor A; mRNA: messenger RNA; SPMS: secondary progressive multiple sclerosis; RRMS: relapsing–remitting multiple sclerosis; PPMS: primary progressive multiple sclerosis; NO: nitric oxide; HGF: hepatocyte growth factor; EGF: epidermal growth factor; bFGF: basic fibroblast growth factor; IFN: interferon; VZV: varicella zoster virus; JCV: John Cunningham virus; OCB: oligoclonal band.
The multiplicity of putative biomarkers, limited information on their independent diagnostic/ prognostic value, and the lack of validation in independent patient cohorts are major hurdles for their application in routine clinical practice.
response evaluation have been detailed elsewhere80 and are summarised in Table 2.
The ideal biomarker for MS should have the following characteristics:79
Currently there is a scarcity of biomarkers that can be used in clinical practice; these are limited to CSF IgG OCB,81 IgG index,81 neutralising antibodies against interferon (IFN)-β82 and natalizumab,83 varicella zoster virus (VZV) antibodies,84 anti-John Cunningham virus (JCV) antibodies,85 and antiaquaporin-4 (AQP4) antibodies.
• Measures clinically relevant MS outcomes • Preferably reflects a causal association • Detected in an easily accessible biological sample with minimal pre-analytical perturbations • The assay for its identification is simple, affordable, and stable, and can be validated independently Promising novel body fluid biomarkers for diagnosis, prognosis, MS subtyping, and therapeutic
NEUROLOGY • July 2016
Multiple Sclerosis Biomarkers Used in Clinical Practice
Diagnostic Biomarkers Detection of two or more CSF IgG OCB in a patient with clinical signs of MS provide very useful diagnostic value.81 OCB can be detected from disease onset and persist during disease course
EMJ EUROPEAN MEDICAL JOURNAL
91
regardless of disease activity. An increased IgG index (ratio >0.7, reflecting intrathecal IgG production) supports MS diagnosis but has no effect on clinical decision making.81
lymphocytes within the lymph organs, inhibiting their migration to the CNS),93 teriflunomide (inhibits de novo synthesis of pyrimidine, preventing clonal expansion of activated lymphocytes),94
AQP4-IgG are highly specific autoantibodies that target the astrocytic water channel AQP4 and are present in the serum of patients with neuromyelitis optica. These antibodies have become the first clinically useful diagnostic biomarker that allows the classification of a subgroup of patients with inflammatory demyelinating disorders that selectively affect the spinal cord and the optic nerves. The prognosis and treatment is different between these diseases,86 making differential diagnosis all the more necessary.
and dimethyl fumarate (with immunomodulatory and antioxidative properties).95
Treatment Response Biomarkers The presence of IFN-β neutralising antibodies has been found in patients with relapse, and therefore physicians might consider stopping treatment with IFN-β in these cases as it may be ineffective.82 Recent DMTs such as natalizumab and fingolimod (sphingosine 1-phosphate receptor modulator) have shown unexpected fatal adverse reactions. Around 5% of MS patients treated with natalizumab (anti-α4-integrin monoclonal antibody) will develop anti-natalizumab antibodies, which are associated with reduced therapeutic efficacy of natalizumab and infusion-related adverse events.87 Patients on natalizumab are at increased risk for progressive multifocal leukoencephalopathy (PML) caused by reactivation of the JCV.88 This risk for PML can be calculated with an algorithm that includes three risk factors: anti-JCV antibody status, previous use of immunosuppressants, and duration of natalizumab treatment.89 Thus, anti-JCV antibody measurement is a useful biomarker in the stratification of patient risk.85 Patients on oral fingolimod are at increased risk for developing herpetic infections,90 and it is advisable that physicians test for VZV antibodies and consider vaccinating seronegative patients at least 1 month before starting treatment with fingolimod.84 The DMTs available for MS include: injectable treatments with immunomodulatory properties such as IFN-β formulations, glatiramer acetate and mitoxantrone; two monoclonal antibodies: natalizumab (anti-α4-integrin, which inhibits lymphocyte migration through the BBB)91 and alemtuzumab (anti-CD52 with immunosuppressive properties);92 and three oral drugs: fingolimod (an immunosuppressive metabolite that recruits
92
NEUROLOGY • July 2016
Potential Cerebral Spinal Fluid Biomarkers to Support Early Multiple Sclerosis Diagnosis CSF is the body fluid in direct contact with the CNS, the target organ of MS, and the measurement of biomarkers in the CSF may shed light on the pathological processes occurring. CSF is obtained through an invasive procedure and therefore its collection can only be justified for initial diagnosis, and exceptionally for monitoring the disease. Some CSF biomarkers identifying CIS patients likely to covert to MS have been validated in independent patient cohorts and are closer to clinical implementation. Increased chitinase-3-like protein 1, secreted by activated macrophages, may define those patients with CIS that later convert to clinically definite MS.96 Increased CSF kappa-free light chains, secreted by the plasma cells, might further support MS diagnosis.97 CIS patients with IgM CSF OCB have an increased risk of converting to clinically definite MS and show a more aggressive disease course.98 An intrathecal polyspecific reaction to neurotropic viruses such as measles, rubella, and VZV (MRZ-specific IgG) is associated with an increased risk of conversion to MS.49 Chemokine ligand 13(CXCL13), involved in B cell recruitment to the CNS during inflammation, has a relevant role in B cell activation. CXCL13 levels in MS are increased in CIS ‘converters’ compared with ‘non-converters’,99 although CXCL13 is not specific to MS and appears in other inflammatory or infectious diseases of the CNS.99
Potential Peripheral Blood Biomarkers of Multiple Sclerosis Peripheral blood biomarkers represent a much less invasive procedure (compared with CSF testing) and their integration, from bench to bedside, would be better for patients and more practical, as these samples can be more easily collected. The number of MS biomarkers in the diagnosis phase is large49,80,89 and beyond the scope of this review. Biomarkers for the differentiation between the progressive (SPMS and PPMS) forms and the RRMS form are still lacking. Recently, it has been shown that the levels of non-coding RNAs, such as serum microRNAs (miRNAs) miR-223,
EMJ EUROPEAN MEDICAL JOURNAL
miR-23a, and miR-15b are decreased in PPMS and are strongly correlated with the Expanded Disability Status Scale. Therefore, they can be considered candidate biomarkers for differentiating PPMS from RRMS.100 Our group recently published a study with two independent observational cohorts of different biomarkers for the classification of MS clinical subtypes. We found that a combination of four plasma proteins: hepatocyte growth factor (HGF), eotaxin, epidermal growth factor (EGF), and macrophage inflammatory protein (MIP)-1β, serve as an effective tool in the clinical subtyping of MS patients. HGF and eotaxin were risk factors for developing a progressive form of MS (SPMS or PPMS), while EGF and MIP-1β were protective factors of progression.101 The combination of these four plasma levels by multivariate logistic regression provided a higher sensitivity and specificity than when the proteins were considered independently. This approach of combining
analytes might be clinically useful and its practical application should be replicated and validated in larger cohorts. We also found that plasma fibroblast growth factor levels were decreased in PPMS patients, and that vascular endothelial growth factor was increased in SPMS patients.
CONCLUSIONS MS remains a heterogeneous and complex disease. Despite recent advances in DMTs, the progressive and neurodegenerative forms of the disease remain incurable. The aetiology of MS remains an enigma and there is an urgent need to recognise and predict outcomes in individual MS patients that could enable more personalised treatment strategies. Therefore, the identification and development of targeted therapies and biomarkers has moved to the forefront of MS translational research.
Acknowledgements Our acknowledgment to Fundación Mapfre, Fundación Salud 2000, Fondo de Investigación Sanitaria, and the European Research Council Starting Award for their support.
REFERENCES 1. Pearce JM. Historical descriptions of multiple sclerosis. Eur Neurol. 2005;54(1):49-53.
9. McCombe PA et al. Sexual dimorphism in autoimmune disease. Curr Mol Med. 2009;9(9):1058-79.
2. Kabat EA et al. A study of the crystalline albumin, gamma globulin and total protein in the cerebrospinal fluid of 100 cases of multiple sclerosis and in other diseases. Am J Med Sci. 1950;219(1):55-64.
10. Sanchez-Ramon S et al. Pregnancyinduced expansion of regulatory T-lymphocytes may mediate protection to multiple sclerosis activity. Immunol Lett. 2005;96(2):195-201.
3. Steinman L. Multiple sclerosis: a two-stage disease. Nat Immunol. 2001;2(9):762-4.
11. de Andres C et al. Short-term sequential analysis of sex hormones and helper T cells type 1 (Th1) and helper T cells type 2 (Th2) cytokines during and after multiple sclerosis relapse. Eur Cytokine Netw. 2004;15(3):197-202.
4. Trapp BD et al. Axonal transection in the lesions of multiple sclerosis. N Engl J Med. 1998;338(5):278-85. 5. Noseworthy JH et al. Multiple sclerosis. N Engl J Med. 2000;343(13):938-52. 6. Federation MSI. Atlas of MS. 2013. Available at: www.msif.org/wp-content/ uploads/2014/09/Atlas-of-MS.pdf. Last accessed: 13 January 2016. 7. World Health Organization. Atlas multiple sclerosis resources in the world. 2008. Available at: http://www.who.int/ mental_health/neurology/Atlas_MS_ WEB.pdf. Last accessed: 13 January 2016. 8. Chitnis T et al. Demographics of pediatric-onset multiple sclerosis in an MS center population from the Northeastern United States. Mult Scler. 2009;15(5): 627-31.
NEUROLOGY • July 2016
12. Aristimuno C et al. Sex-hormone receptors pattern on regulatory T-cells: clinical implications for multiple sclerosis. Clin Exp Med. 2012;12(4):247-55. 13.Valor L et al. Estradiol-dependent perforin expression by human regulatory T-cells. Eur J Clin Invest. 2011;41(4): 357-64. 14. Whitaker JN. Effects of pregnancy and delivery on disease activity in multiple sclerosis. N Engl J Med. 1998;339(5): 339-40. 15. Salemi G et al. The relapse rate of multiple sclerosis changes during pregnancy: a cohort study. Acta Neurol Scand. 2004;110(1):23-6.
16. Scalfari A et al. The natural history of multiple sclerosis: a geographically based study 10: relapses and long-term disability. Brain. 2010;133(7):1914-29. 17. Miller DH et al. Clinically isolated syndromes. Lancet Neurol. 2012;11(2): 157-69. 18. Fisniku LK et al. Disability and T2 MRI lesions: a 20-year follow-up of patients with relapse onset of multiple sclerosis. Brain. 2008;131(3):808-17. 19. Compston A, Coles A. Multiple sclerosis. Lancet. 2008;372(9648): 1502-17. 20. Ciccarelli O, Thompson A. Multiple sclerosis in 2015: Managing the complexity of multiple sclerosis. Nat Rev Neurol. 2016;12(2):70-2. 21. Correale J et al. Benign multiple sclerosis: does it exist? Curr Neurol Neurosci Rep. 2012;12(5):601-9. 22. Correale J et al. Benign multiple sclerosis: a new definition of this entity is needed. Mult Scler. 2012;8(2):210-8. 23. Chiaravalloti ND, DeLuca J. Cognitive impairment in multiple sclerosis. Lancet Neurol. 2008;7(12):1139-51. 24. Amato MP et al. Benign multiple sclerosis: Cognitive, psychological and
EMJ EUROPEAN MEDICAL JOURNAL
93
social aspects in a clinical cohort. J Neurol. 2006;253(8):1054-9. 25. Charil A, Filippi M. Inflammatory demyelination and neurodegeneration in early multiple sclerosis. J Neurol Sci. 2007;259(1-2):7-15. 26. Frischer JM et al. The relation between inflammation and neurodegeneration in multiple sclerosis brains. Brain. 2009; 132(Pt 5):1175-89. 27. Romme Christensen J et al. Systemic inflammation in progressive multiple sclerosis involves follicular T-helper, Th17and activated B-cells and correlates with progression. PLoS One. 2013;8(3):e57820. 28. Choi SR et al. Meningeal inflammation plays a role in the pathology of primary progressive multiple sclerosis. Brain. 2012;135(Pt 10):2925-37. 29. Howell OW et al. Meningeal inflammation is widespread and linked to cortical pathology in multiple sclerosis. Brain. 2011;134(Pt 9):2755-71. 30. Degenhardt A et al. Clinical prognostic factors in multiple sclerosis: a natural history review. Nat Rev Neurol. 2009;5(12):672-82. 31. Tintore M et al. Defining high, medium and low impact prognostic factors for developing multiple sclerosis. Brain. 2015;138(Pt 7):1863-74. 32. Marrie RA et al. A systematic review of the incidence and prevalence of comorbidity in multiple sclerosis: overview. Mult Scler. 2015;21(3):263-81. 33. Sospedra M, Martin R. Immunology of multiple sclerosis. Annu Rev Immunol. 2005;23:683-747. 34. McFarland HF. Correlation between MR and clinical findings of disease activity in multiple sclerosis. AJNR Am J Neuroradiol. 1999;20(10):1777-8. 35. John GR et al. Multiple sclerosis: reexpression of a developmental pathway that restricts oligodendrocyte maturation. Nat Med. 2002;8(10):1115-21. 36. Wingerchuk DM. Smoking: effects on multiple sclerosis susceptibility and disease progression. Ther Adv Neurol Disord. 2012;5(1):13-22. 37. Pohl D et al. High seroprevalence of Epstein-Barr virus in children with multiple sclerosis. Neurology. 2006;67(11):2063-5. 38. Ramagopalan SV et al. Association of infectious mononucleosis with multiple sclerosis. A population-based study. Neuroepidemiology. 2009;32(4):257-62. 39. Handel AE et al. Environmental factors and their timing in adult-onset multiple sclerosis. Nat Rev Neurol. 2010;6(3): 156-66. 40. Munger KL et al. Vitamin D intake and incidence of multiple sclerosis. Neurology. 2004;62(1):60-5. 41.
94
Munger
KL
et
al.
NEUROLOGY • July 2016
Serum
25-hydroxyvitamin D levels and risk of multiple sclerosis. JAMA. 2006; 296(23):2832-8.
for multiple sclerosis reveals associated variants in STAT3 gene. Am J Hum Genet. 2010;86(2):285-91.
42. Elian M et al. Multiple sclerosis among United Kingdom-born children of immigrants from the Indian subcontinent, Africa and the West Indies. J Neurol Neurosurg Psychiatry. 1990;53(10):906-11.
58. Hafler DA et al. Risk alleles for multiple sclerosis identified by a genomewide study. N Engl J Med. 2007;357(9):851-62.
43. Leibowitz U et al. Epidemiological study of multiple sclerosis in Israel. II. Multiple sclerosis and level of sanitation. J Neurol Neurosurg Psychiatry. 1966; 29(1):60-8. 44. Fleming JO, Cook TD. Multiple sclerosis and the hygiene hypothesis. Neurology. 2006;67(11):2085-6. 45. Challoner PB et al. Plaque-associated expression of human herpesvirus 6 in multiple sclerosis. Proc Natl Acad Sci U S A. 1995;92(16):7440-4. 46. Berti R et al. Increased detection of serum HHV-6 DNA sequences during multiple sclerosis (MS) exacerbations and correlation with parameters of MS disease progression. J Neurovirol. 2002;8(3): 250-6. 47. Banwell B et al. Clinical features and viral serologies in children with multiple sclerosis: a multinational observational study. Lancet Neurol. 2007;6(9):773-81.
59. Viglietta V et al. Loss of functional suppression by CD4+CD25+ regulatory T cells in patients with multiple sclerosis. J Exp Med. 2004;199(7):971-9. 60. Venken K et al. Natural naive CD4+CD25+CD127 low regulatory T cell (Treg) development and function are disturbed in multiple sclerosis patients: recovery of memory Treg homeostasis during disease progression. J Immunol. 2008;180(9):6411-20. 61. Huan J et al. Decreased FOXP3 levels in multiple sclerosis patients. J Neurosci Res. 2005;81(1):45-52. 62. Obermeier B et al. Related B cell clones that populate the CSF and CNS of patients with multiple sclerosis produce CSF immunoglobulin. J Neuroimmunol. 2011;233(1-2):245-8. 63. Poser CM et al. New diagnostic criteria for multiple sclerosis: guidelines for research protocols. Ann Neurol. 1983; 13(3):227-31.
48. Lang HL et al. A functional and structural basis for TCR cross-reactivity in multiple sclerosis. Nat Immunol. 2002;3(10):940-3.
64. McDonald WI et al. Recommended diagnostic criteria for multiple sclerosis: guidelines from the International Panel on the diagnosis of multiple sclerosis. Ann Neurol. 2001;50(1):121-7.
49. Teunissen CE et al. Body fluid biomarkers for multiple sclerosis-the long road to clinical application. Nat Rev Neurol. 2015;11(10):585-96.
65. Polman CH et al. Diagnostic criteria for multiple sclerosis: 2005 revisions to the “McDonald Criteria”. Ann Neurol. 2005;58(6):840-6.
50. Hansen T et al. Concordance for multiple sclerosis in Danish twins: an update of a nationwide study. Mult Scler. 2005;11(5):504-10.
66. Polman CH et al. Diagnostic criteria for multiple sclerosis: 2010 revisions to the McDonald criteria. Ann Neurol. 2011; 69(2):292-302.
51. Schmidt H et al. HLA-DR15 haplotype and multiple sclerosis: a HuGE review. Am J Epidemiol. 2007;165(10):1097-109.
67. Miller DH al. Differential diagnosis of suspected multiple sclerosis: a consensus approach. Mult Scler. 2008;14(9):1157-74.
52. Sadovnick AD. Genetic background of multiple sclerosis. Autoimmun Rev. 2012;11(3):163-6.
68. Filippi M et al. Association between pathological and MRI findings in multiple sclerosis. Lancet Neurol. 2012;11(4): 349-60.
53. Marrosu MG et al. Dissection of the HLA association with multiple sclerosis in the founder isolated population of Sardinia. Hum Mol Genet. 2001;10(25):2907-16. 54. Marrosu MG et al. HLA-DQB1 genotype in Sardinian multiple sclerosis: evidence for a key role of DQB1 *0201 and *0302 alleles. Neurology. 1992;42(4):883-6. 55. Maier LM et al. IL2RA genetic heterogeneity in multiple sclerosis and type 1 diabetes susceptibility and soluble interleukin-2 receptor production. PLoS Genet. 2009;5(1):e1000322. 56. De Jager PL et al. The role of the CD58 locus in multiple sclerosis. Proc Natl Acad Sci U S A. 2009;106(13):5264-9. 57. Jakkula E et al. Genome-wide association study in a high-risk isolate
69. Fazekas F et al. The contribution of magnetic resonance imaging to the diagnosis of multiple sclerosis. Neurology. 1999;53(3):448-56. 70. Nusbaum AO et al. Quantitative diffusion measurements in focal multiple sclerosis lesions: correlations with appearance on TI-weighted MR images. AJR Am J Roentgenol. 2000;175(3):821-5. 71. Keegan BM, Noseworthy JH. Multiple sclerosis. Annu Rev Med. 2002;53: 285-302. 72. van Waesberghe JH et al. Axonal loss in multiple sclerosis lesions: magnetic resonance imaging insights into substrates of disability. Ann Neurol. 1999;46(5):747-54.
EMJ EUROPEAN MEDICAL JOURNAL
73. Miller DH et al. Role of magnetic resonance imaging within diagnostic criteria for multiple sclerosis. Ann Neurol. 2004;56(2):273-8.
for clinical use of data on neutralising antibodies to interferon-beta therapy in multiple sclerosis. Lancet Neurol. 2010;9(7):740-50.
74. Mallucci G et al. The role of immune cells, glia and neurons in white and gray matter pathology in multiple sclerosis. Prog Neurobiol. 2015;127-128:1-22.
83. Lundkvist M et al. Characterization of anti-natalizumab antibodies in multiple sclerosis patients. Mult Scler. 2013;19(6):757-64.
75. Wattjes MP et al. Evidence-based guidelines: MAGNIMS consensus guidelines on the use of MRI in multiple sclerosis--establishing disease prognosis and monitoring patients. Nat Rev Neurol. 2015;11(10):597-606.
84. Loebermann M et al. Vaccination against infection in patients with multiple sclerosis. Nat Rev Neurol. 2011;8(3):143-51.
76. Fox NC et al. Progressive cerebral atrophy in MS: a serial study using registered, volumetric MRI. Neurology. 2000;54(4):807-12. 77. Chen JT et al. Clinically feasible MTR is sensitive to cortical demyelination in MS. Neurology. 2013;80(3):246-52. 78. Abdel-Fahim R et al. Improved detection of focal cortical lesions using 7T magnetisation transfer imaging in patients with multiple sclerosis. Mult Scler Relat Disord. 2014;3(2):258-65. 79. Rajasekharan S, Bar-Or A. From bench to MS bedside: challenges translating biomarker discovery to clinical practice. J Neuroimmunol. 2012;248(1-2):66-72. 80. Katsavos S, Anagnostouli M. Biomarkers in Multiple Sclerosis: An Up-to-Date Overview. Mult Scler Int. 2013;2013:340508. 81. Link H, Huang YM. Oligoclonal bands in multiple sclerosis cerebrospinal fluid: an update on methodology and clinical usefulness. J Neuroimmunol. 2006;180(12):17-28. 82. Polman CH et al. Recommendations
NEUROLOGY • July 2016
85. Bloomgren G et al. Risk of natalizumab-associated progressive multifocal leukoencephalopathy. N Engl J Med. 2012;366(20):1870-80. 86. Wingerchuk DM, Weinshenker BG. Neuromyelitis optica: clinical predictors of a relapsing course and survival. Neurology. 2003;60(5):848-53. 87. Calabresi PA et al. The incidence and significance of anti-natalizumab antibodies: results from AFFIRM and SENTINEL. Neurology. 2007;69(14): 1391-403. 88. Clifford DB et al. Natalizumabassociated progressive multifocal leukoencephalopathy in patients with multiple sclerosis: lessons from 28 cases. Lancet Neurol. 2010;9(4):438-46. 89. Comabella M, Montalban X. Body fluid biomarkers in multiple sclerosis. Lancet Neurol. 2014;13(1):113-26. 90. Uccelli A et al. Primary varicella zoster infection associated with fingolimod treatment. Neurology. 2011;76(11):1023-4. 91. Stüve O et al. Immune surveillance in multiple sclerosis patients treated with natalizumab. Ann Neurol. 2006;59(5): 743-7. 92. Minagar A et al. Alemtuzumab and
multiple sclerosis: therapeutic application. Expert Opin Biol Ther. 2010;10(3):421-9. 93. Ingwersen J et al. Fingolimod in multiple sclerosis: mechanisms of action and clinical efficacy. Clin Immunol. 2012;142(1):15-24. 94. Claussen MC, Korn T. Immune mechanisms of new therapeutic strategies in MS: teriflunomide. Clin Immunol. 2012; 142(1):49-56. 95. Bomprezzi R. Dimethyl fumarate in the treatment of relapsing-remitting multiple sclerosis: an overview. Ther Adv Neurol Disord. 2015;8(1):20-30. 96. Hinsinger G et al. Chitinase 3-like proteins as diagnostic and prognostic biomarkers of multiple sclerosis. Mult Scler. 2015;21(10):1251-61. 97. Senel M et al. Cerebrospinal fluid immunoglobulin kappa light chain in clinically isolated syndrome and multiple sclerosis. PLoS One. 2014;9(4):e88680. 98. Ferraro D et al. Cerebrospinal fluid oligoclonal IgM bands predict early conversion to clinically definite multiple sclerosis in patients with clinically isolated syndrome. J Neuroimmunol. 2013;257(12):76-81. 99. Khademi M et al. Cerebrospinal fluid CXCL13 in multiple sclerosis: a suggestive prognostic marker for the disease course. Mult Scler. 2011;17(3):335-43. 100. Fenoglio C et al. Decreased circulating miRNA levels in patients with primary progressive multiple sclerosis. Mult Scler. 2013;19(14):1938-42. 101. Tejera-Alhambra M et al. Plasma biomarkers discriminate clinical forms of multiple sclerosis. PLoS One. 2015;10(6):e0128952.
EMJ EUROPEAN MEDICAL JOURNAL
95


![[PDF BOOK] Where Do We Go from Here - Google Sites](https://m.moam.info/img/260x300/pdf-book-where-do-we-go-from-here-google-sites_647755e8097c47a9708b98c0.jpg)


![[PDF] Where Do We Go from Here - Google Sites](https://m.moam.info/img/260x300/pdf-where-do-we-go-from-here-google-sites_6477fb97097c47a9708c51e6.jpg)