CHEMICAL GEOLOGY INCLUDING
ELSEVIER
ISOTOPE GEOSCIENCE
Chemical Geology 142 (1997) 175- 192
Multiple source components in gas manifestations from north-central Italy Angelo Minissale a,*, Williams C. Evans b, Gabriella Magro c, Orlando Vaselli d a C.N.R. - Centro di Studio per la Minerogenesi e la Geochimica Applicata, Via La Pira 4, 50121 Firenze, Italy b U.S. Geological Survey, 345 MiddlefieldRoad, Menlo Park, CA 94025, USA c C.N.R. - Istituto di Geocronologia e Geochimica lsotopica, Via Cardinal Maffi 36, 56100 Pisa, Italy d Dipartimento di Scienze della Terra, Universith di Firenze, Via La Pira 4, 50121 Firenze, Italy
Accepted 2 July 1997
Abstract
Gas manifestations in north-central Italy consist of CO2-rich gases with minor N2-rich emissions and discharge either along with thermal springs or into cold and stagnant waters. 'Cold' gases are prevalently CO2-dominated ( > 90%) while gases related to the thermal waters have variable composition: from CO 2 > 99.5% to N2 > 90%. The variable composition of 'thermal' gases is caused by differences in the thermal regime and lithology of the ascent paths, where there is mixing of gases from multiple sources, such as N2-rich atmospheric and deep CO2-rich metamorphic end-members. Elevated concentrations of CH 4 and H 2 in these gases are generally related to the presence of active geothermal systems at shallow depth, such as the Larderello-Travale field in Tuscany. The 613C values between coexisting CH 4 and CO 2 in all samples analyzed suggest that CH 4 originates abiogenically in 200-400°C hydrothermal systems. Far from geothermal areas, where the thermal gradient i,; lower or the water/gas ratio is high because of large inflow of meteoric waters, H 2 and CH 4 are usually lower. In some cases, they can be scrubbed or oxidized (especially H2), while the residual rising gas becomes indirectly enriched in N 2 and CO 2. Carbon dioxide is also enriched in some discharged gases because it is produced at shallow depth in lower temperature conditions ( < 150°C). Heavy 6 tSN values for N 2 to near + 7.0%0 suggest that, for some gas samples that contain excess nitrogen (e.g. where N2/Ar >> 83), this component probably derives from ammonia-rich feldspars and micas within the Palaeozoic schist basement rocks. However, other samples show evidence of a shallow component of CH 4 and N 2 from Neogene basin sediments. The areal distribution of the 3He/4He ratio points to a general prevalence of atmospheric and crustal 4He in the gas discharges in central Italy. A significant component of mantle 3He is only found in the geothermal areas of Larderello where the large regional thermal anomaly suggests the presence of a deep magmatic body. © 1997 Elsevier Science B.V. Keywords." geochemistryof gases; isotopes; carbon dioxide; 3He/4He ratio; central Italy; stable isotopes in gases
* Correspondingauthor. Fax: + 39 (55) 284-571; e-mail:
[email protected] 0009-2541/97/$17.00 ~ 1997 Elsevier Science B.V. All rights reserved. PH S0009-2541 (97)13,008 1-8
176
A. Minissale et al. / Chemical Geology 142 (1997) 175-192
1. Introduction Plate boundaries are characterized by the presence of seismic, volcanic, ore deposition and geothermal activity. These dynamic processes are enhanced by the circulation of hydrothermal fluids in the crust, which help transport volatiles from the deep crust or mantle to the surface. The release of primordial gases at the surface is confirmed by high 3 H e / n H e signatures in gas discharges in volcanic arcs (Craig et al., 1978; Giggenbach et al., 1993). In continental areas where the crust is thickened through the piling up of several PalaeozoicQuaternary sedimentary units, such as in north-central Italy (Abbate et al., 1970), the signature of mantle components in the gas phase may eventually be largely obliterated by the admixture of crustal gases (e.g. nile, 4°Ar, and methane). The resulting composition of such gases, therefore, would be a function of parameters such as: residence time in the crust, lithology, bacterial activity, temperature, and the type of buffer system controlling equilibrium conditions among single gas phases. Nevertheless, admixtures of 3He-rich mantle-derived gas and crustal-originated volatiles have been recently reported within the continents by many authors (Poreda et al., 1986; Matthews et al., 1987; Hiyagon and Kennedy (1992). To study relationships between geothermal anomalies, volcanism, and deep geological structures in the crust, 60 selected gas manifestations with different chemical compositions in a complex continental environment from north-central Italy have been sampled. Bulk chemical composition and isotopic composition of carbon in C H 4 and CO 2, nitrogen in N 2, helium, and argon, have been determined and related, tentatively, to their many potential sources in the crust and different physico-chemical processes during their ascent. We place particular emphasis on the mixing processes between the crustal, mantle, and atmospheric components.
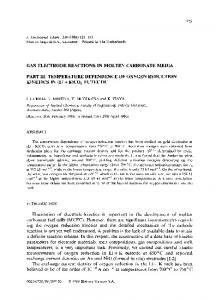
2. Geological setting Central Italy (Fig. 1) is located between the African and Eurasian plates and is characterized by the presence of thick piles of thrusted Ercinian and
Alpine sedimentary units. The area is tectonically active and big earthquakes have been recorded in the past. Besides ore deposits of Alpine age and PlioQuaternary volcanics, four geothermal areas (Larderello, Mt. Amiata, Latera, Cesano) are known where a temperature > 200°C has been measured at < 1000 m depth (Carella et al., 1985). All these active systems are associated with exposed or buried volcanics. The Mesozoic limestones ('Tuscanids'), which represent the main geothermal reservoir, are overlain by thick sequences of allochthonous flysches ('Ligurids'), and in turn overlie a Palaeozoic metamorphic basement. In the basement, temperatures > 350°C have been measured in < 3500 m deep geothermal wells (Allegrini et al., 1995). Due to the post-orogenic tectonics, many MioPliocene N W - S E basins formed (Fig. 1). At the boundaries of these basins the Mesozoic limestones may outcrop in structural highs, with > 3000 m total thickness (Buonasorte et al., 1991). Since these outcrops coincide with the main elevations, they are areas of high rainfall infiltration. As a consequence, a regional circulation of N2-rich meteoric waters is well developed in the carbonates (Minissale et al., 1995). The thickness of this aquifer, in an area characterized by the presence of high heat flow, favours the heating up of waters that emerge as Ca-SO n thermal springs at the boundaries of the carbonate series (Minissale and Duchi, 1988). The gas phase associated with these springs sometimes consists of CO 2 vigorously bubbling from the water, sometimes of small gentle N2-rich bubbles (Minissale et al., 1995). Setting aside thermal springs, many other gas discharges are scattered around central Italy (Duchi and Minissale, 1995). Sometimes they are associated with cold springs, but more often they emerge in dry conditions or bubbling from stagnant waters that gather only during the rainy seasons (spring and fall). The gas manifestations sampled in the present survey are shown in Fig. 1. The map, just to give an idea of the westwards circulation of waters from the main Apennine range, also shows thermal springs that emerge in the low topographic areas near the Tyrrhenian sea. The 60 samples here considered have been carefully selected on the basis of their closeness to geothermal areas, regional faults, a n d / o r
A. Minissale et al. / Chemical Geology 142 (1997) 175-192
177
®
FIRENZE
~®
® ®
\
~
~Paleozoic
® ®
Mesozoic limestones
schists
• A
Siena
gas t h e r m a l spring
0
"A.® "~
25Kin
I
I
@~,,~,
®
)~_vic. O ,-,J i ~
,,
\
@
CESANO
(~)
~.~ 4A
®
l,"
®\
Fig. 1. Gas sample locations and main outcrops of Mesozoic limestone and Palaeozoic basement from central Italy.
118 119 132 133 2 8 13 24 26 29 30 40 53 54 58 59
il7
35 14 15 18 22 57 60 69 75 90 103 105
Sample No.
Acqua Borra Viterbo Saturnia San Filippo Olivo Borgo Pantano Palagio Petriolo Rapolano S. Casciana Bagni Tivoli S. Giovanni d'Asso Asciano Doccio Bagni dell'Osa Pereta Roselle Venturina Acqua Agra Acqua Puzza Baccano Caldara Castelletto Latera (Puzzolaie) Frattocchie M. te Bischero Monterozzi Muralto Palazzo al Piano Parco della Mola
Name 37 65 37 51 40 22 36 27 40 23 27 17 34 32 30 36 36 18 16 22 15 10 14 24 22 11 14 11 25
te 0.0005 < 0.0002 0.0024 0.0009 0.0002 < 0.0002 < 0.0002 < 0.0002 0.0031 0.0023 0.0011 0.0737 0.0002 0.0211 0.0004 0.0012 0.0005 < 0.0002 0.0105 0.0007 0.0004 0.0024 0.0013 0.0004 0.0007 0.0002 0.0010 0.0046 0.0007
He 0.0053 0.0093 0.6616 0.0006 0.0154 0.0196 0.0103 0.0133 1.2111 0.1250 0.1899 0.7844 0.0332 0.9506 0.3126 1.0999 0.9947 0.0206 0.2582 0.0738 0.0152 0.0167 0.0082 0.0149 0.0204 0.0152 0.0011 0.0311 0.0094
Ar 0.0002500 nd 0.0018750 0.0000095 0.0002105 nd nd nd 0.0020667 0.0003286 nd nd nd 0.0002114 0.0013333 0.0019672 0.0017857 nd 0.0003387 0.0000476 0.0004706 0.0000350 0.0000213 nd nd 0.0000143 0.0000403 0.0000975 nd
Ne 0.0712 0.1570 0.2246 0.0019 0.0185 0.3178 0.1384 0.0555 0.7326 < 0.001 0.7872 5.9042 0.0231 0.2288 2.8615 4.7112 19.8840 0.4319 < 0.001 0.9296 0.2036 0.2101 0.0015 0.2530 0.1276 0.0022 0.0049 0.0021 0.0947
O2 0.6490 0.3619 63.8039 2.0027 1.3276 0.8253 0.4428 0.6500 91.1875 7.6500 10.2061 55.1921 1.7264 80.0605 25.6326 89.3408 78.5826 1.5388 26.6901 4.8922 2.3254 2.7962 1,3500 0.8164 2.6844 1.4012 2.3641 6.7445 1.7599
N2 98.440 99.705 33.327 95.308 96.917 98.893 99.474 99.640 6.948 91.600 88.062 37.120 97.084 16.577 62.772 5.388 2.085 98.163 73.247 93.525 98.038 92.777 97.730 97.330 96.965 98.407 97.962 85.784 96.841
CO 2
Table 1 Chemical composition (in percent by vol. on H20-free basis) of gas manifestations in north-central Italy
0.000011 0.000038 0.000063 0.000064 nd nd 0.000136 nd nd nd 0.000102 nd 0.000021 0.000096 0.000274 nd nd 0.000007 ~ nd nd 0.000007 a nd 0.000048 nd 0.000005 ~ nd 0.00005 ~ nd 0.000131 ~
CO
< 0.0001 0.0002 0.0002 < 0.0001 0.0028 0.0003 0.0001 < 0.0001 < 0.0001 < 0.0001 0.0023 < 0.0001 0.0002 < 0.0001 0.0003 < 0.0001 < 0.0001 < 0.0001 < 0.0001 0.0004 0.0013 < 0.0001 0.0001 0.0004 0.0293 < 0.0001 < 0.0001 0.0454 < 0.0001
H2
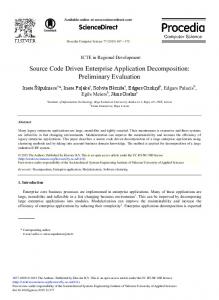
< 0.0005 0.1457 0.2290 0.1417 0.2863 < 0.0005 < 0.0005 0.0140 < 0.0005 0.5500 < 0.0005 < 0.0005 0.3020 0.3044 0.0020 < 0.0005 < 0.0005 83 and, for comparison, some samples from thermal springs with N2/Ar < 83, the ~515N in N 2 has been measured (Table 2) to help determine the origin of N 2. Fig. 8 p l o t s t~lSN in N 2 v e r s u s A r / N 2 (corrected for air contamination by assuming all O 2 is from air). The results show that many samples with the 'excess' N 2 in Fig. 7 are strongly enriched in 15N, reaching values close to +7.0%o for samples from the Larderello area (samples 77 and 99). Although the isotopic composition ,of nitrogen degassing from the mantle is controversial (Javoy et ai., 1984; Javoy and Pineau, 1991), nitrogen strongly enriched in ~SN generally comes from metasedimentary rocks (Haendel et al., 1986; Jenden et ai., 1988), as they may contain organic nitrogen and ammonium in micas and feldspars (Klein and Juntgen, 1972; Honma and Itihara, 1981). We favour this origin of the excess N 2 in north-central Italy. In fact, by plotting 6~5N values versus sample distance from the basement rocks or Mesozoic limestones (Fig. 9), two groups of samples are clearly recognisable. The first, with 6~5N ranging from - 2 . 0 to +2.5%o, is related to gas samples from > 15 km from the basement,
~
•
e-
a
24
21-
i====~e, ioeola*lw ~ t.=rint~ fum=,al
i
.i
Z
io._._..,i
.. . .
~o ~-.. ....
4; z3-
6. Origin of nitrogen
rr
185
i~
;
0;
~
O
15 2
...a.tr.r.aq.o. ...........
118
•
ii:i ...............................
~;i
119
[]
-1 ~ ,~ -2
'
l
'
I
'
I
I
'
l
'
I
0,000 0,004 0,008 0,012 0,016 0,020 0,024 0,028
Ar/N a (corr.) Fig. 8. Plot of t~lSN in N 2 versus the A r / N 2 ratio (corrected for air contamination). Samples with N 2 / A r ratio ranging between air and ASW have not been analyzed.
whereas high-615N samples are always close to the outcrops of basement rocks. Nitrogen with low 6 ]SN values may be due either to mixing of deep nitrogen with air (615N = 0%~ in air) or may have its source in younger sediments in the cap-rock formations.
!
-2 0
210
410
60
810
100
distance from basement or limestones (km) Fig. 9. Plot of t~I~N as a function of the distance of gas samples from the closest outcrop of the Mesozoic carbonate formations or Palaeozoic basement.
186
A. Minissale et al, / Chemical Geology 142 (1997) 175-192 0,01
The high-6]SN samples contain nitrogen of deeper metamorphic origin.
"L
soil CO 2 13-/
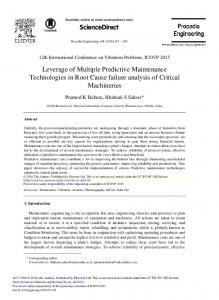
7. Origin of carbon dioxide Several sources of CO 2 in central Italy have been proposed so far. Through the analysis of 813C in CO 2 from gas emissions and travertines, Panichi and Tongiorgi (1976) suggested a prevalent origin in the Mesozoic carbonates. On the basis of the coincidence of high Pco2 values in thermal springs and areas of shallow Moho depth, Minissale (1991) suggested a prevalent mantle origin. Based on a new interpretation of the 6 ~3C data, a magmatic origin was proposed by Marini and Chiodini (1994) for the LardereUo area. Finally, Gianelli (1985) and Duchi et al. (1992b) have suggested that CO 2 could be the product of metamorphic reactions between silicates and carbonates inside the metamorphic basement. The latter hypothesis has been recently corroborated by a seismic survey across Italy that has evidenced the presence of a slab of Mesozoic limestones below the Palaeozoic basement (Amato et al., 1993). It is probable that all these sources are involved and that mixing processes mask the relative contribution of a single source. To evaluate mixing processes, we plot Ne versus 613C in CO 2 (Fig. 10). Neon has the advantages of being an inert gas and of having air as its sole source. Fig. 10 shows that two end-members can be identified. One coincides with the strongly air-contaminated sample 133 whose 6 ~ 3 C = - 13.5%o may reflect mixing of both the atmospheric CO 2 (8~3C varies from - 6 . 0 to -8.0%~; Faure, 1977) and plant-respiration CO 2 (613C = from - 13.0 to -28.0%~; Keeling, 1958, 1961; Ceding et al., 1991). The other CO 2 endmember derives from marine limestones (613C = from - 1 . 0 to +2.0%o; Craig, 1963). Plotting the data on a log scale diagram, many samples form a mixing curve between the two end-members, whereas samples trending away from the mixing line are more difficult to explain. Many of them lie in the 13C mantle range ( - 4.5 to - 6.5%°; Kyser, 1986) but, as discussed below, the helium isotopic composition only supports a mantle component in the fluids from the Larderello area. In general, 6t3c values in Fig. 10 might be well explained through the mixing of any deep rising CO 2 with isotopically lighter
[ ] gas assoc to thermal spring • 0 gas assoc, to cold w~er
....
I
L z~ L , ~ b ~ f u ~ mixing line
El . . . . . . . . . . ~
1E-3.
-~ .... . . . . / (~
"7".
s
". 24
go "0. g",~
>,
~.
m 18
" mixing with organic CO~ 1E-6
, -14
, -12
-10
i -8
'
i -6
,
kJ
~ ~ , -4
I
endrnemtmr
J -2
"~'~-~' 0
J 2
813C in CO 2 (in °/oo PDB) Fig. 10. Plot of 8J3C versus the Ne content of samples. A deep end-member with reduced air contamination and 613C typical of marine limestone is identified.
organic CO 2 produced at lower temperature in the many Neogene basins present in north-central Italy. In fact, even small contributions of this organic CO 2 may strongly affect the isotopic signature of CO 2 from other sources.
8. Origin of methane As shown in Fig. 2, C H 4 is particularly enriched in samples from wells and from surface manifestations located in the Larderello (samples 26, 58, 77, 99, 100) and Mt. Amiata (samples 18, 68, 81) geothermal fields, which suggests a thermogenic origin of CH 4 in these areas. To test this hypothesis we use the method of Giggenbach (1982) to plot 13C/12C for CO 2 versus the coexisting 13C/lZC for C H 4 in Fig. 11. All plotted samples have a carbon isotopic composition for CO 2 that falls in the volcano-magmatic field, but the resulting equilibration temperatures are slightly higher than those existing in the carbonate reservoir and much lower than those in any magmatic environments. A better evaluation of possible equilibration temperatures at depth between CO 2 and C H 4, including samples with C H 4 < 1% is shown in Fig. 12. This diagram proposed by Giggenbach (1993) is a double
A. Minissale et al. / Chemical Geology 142 (1997) 175-192
I r"l ~ s s s s ~ s d t o t h w ~ , l s p r i n g g ~ m l odal ed to COldw l e r
Ill
I
I =.-=,=., 40 .
.
.
.
.
..........
.............. ///:illlllllllllll t~nl~l - 2 0 -
o
o.
~
.... " "
*O .....
""
.- .... ' -
......
..,""O
,..... ~
"
~-"rrs
.--0
.--"
£
".
.....
..-'""
..-
~.o. ....
..... o £ " L ~ "'" °O ,.-, ....... =, ..-0,~,o ........... .......... " ,~
~--30- ~ -40.
. .......
......
tCH4/CO2=4625/[lO'4+log(XCH411, XCO2 }
. ........
--"
°C
-- 273.15
z~o..~ ..... -60
c -14
and
,- m. -12
I
I
'
-10
volcanic-ma~r~c
f
"
I
-8
'
I
-6
'
Iman~ Nrne=or~
I
-4
"
-2
I
'
I
0
'
2
4
a~3Cco, (°/oo PDB) Fig. 11. Plot of carbon-13 contents of coexisting C O 2 and CH 4 (Giggenbach, 1982). Dashed lines represent isotherms based on theoretical CO 2 - C H 4 fractionation factors (Bottinga, 1969).
R.=log(tH~Jt%0) 0-
>