Human occipital potentials evoked by stimulation with a counterphase ... tuning
were investigated as a function of luminance, electrode location, and temporal ...
Experimental Brain Research
Exp. Brain Res. 33, 535-550 (1978)
@ Springer-Verlag 1978
Multiple Spatial-Frequency Tuning of Electrical Responses from Human Visual Cortex* C.W. Tyler, P. Apkarian, and K. N a k a y a m a Srnith-Kettlewell Institute of Visual Sciences, 2232 Webster Street, San Francisco, CA 94115, U.S.A.
Summary. H u m a n occipital potentials evoked by stimulation with a counterphase flickering grating were recorded by a digital narrowband filter technique. The data showed a surprising degree of narrow tuning to particular spatial frequencies in addition to the expected narrow temporal frequency tuning. At each t e m p o r a l frequency, there could be two or more peaks of response to different spatial frequencies, each distinct from the whole field flicker response. Variations in this multiple spatial frequency tuning were investigated as a function of luminance, electrode location, and temporal frequency for several observers. The results are interpreted in terms of m a n y stimulus-specific resonant neural circuits within the brain, and suggest that it is possible to m a k e a highly detailed exploration of the responses of neural circuits to visual stimulation. Key words: V E P - Pattern - Spatial frequency - Cortex.
It is often tacitly assumed that the electrical activity of the brain recorded from the scalp should reflect the properties of the visual system as inferred from psychophysics. This approach is not necessarily the most fruitful, because when a correspondence is obtained, it provides little new information about the visual system that was not already known from the psychophysics. On the other hand, new discoveries, dissimilar from psychophysics, are frequently considered to show some kind of artifact of the electrical activity which is ignored in the description of visual function. We propose to take a rather different approach which may prove more incisive in understanding the electrical activity of the brain, and the visual * Supported by NIH Grants No. 5 R01 EY01582, No. 1 R01 EY02124, NIH General Research Grant No. 5 S01 RR05566 and The Smith-Kettlewell Eye Research Foundation
0014-4819/78/0033/0535/$
3.20
536
C.W. Tyler et al. 3 A
~ o.41C
?;
~03
}~"
e 02
o_~
~
[ ~
< 0,1 >
0
Spatial Frequency (c/deg)
, ,
,
Spatial Frequency (c/deg) ~
~ ~o ~
< >
100I
t0 ]
u~ 0
,t-
Spatial Frequency (c/deg)
1
,
,
Spatial Frequency (c/deg)
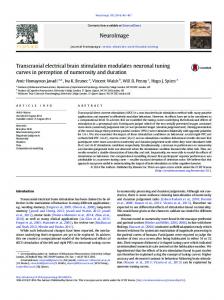
Fig. 1. Examples of spatial frequency tuning in previous VEP studies. Transient pattern response amplitudes from Fig. 8 of Rietveld et al. (1967) are replotted in A. In B, data from Harter and White (1970) from their Fig. 5 show tuning in the 90-110 ms negative component of the transient evoked response. Freeman and Thibos (1975) found narrow spatial frequency tuning of the steady-state evoked potential (C) relative to the psychophysical contrast sensitivity (D) obtained on the same observer. For these latter data, linear VEP amplitude and log psychophysicalsensitivity should be equivalent because of the log linear contrast relationship (see Fig. 5)
system in particular. This approach is to study the stimulus determinants of evoked potentials in fine detail without forcing them into a mould formed by psychophysical data. Correspondences to previous information are followed up as a secondary activity, both in the direction of h u m a n psychophysics and equally in the direction of animal neurophysiology. A t this initial stage, our investigation is largely descriptive, delineating the p h e n o m e n a to be discovered by a detailed examination of stimulus determinants. As a relevant example of information in the electrical responses which has been disregarded because of a mismatch to psychophysics, consider the tuning of visual evoked potentials (VEP) as a function of bar width (or its inverse, spatial frequency) in a grating stimulus. This kind of study has been conducted in sufficient detail to obtain an estimate of the spatial frequency tuning of responses by Rietveld et al. (1967), H a r t e r and White (1970), Armington et al. (1971) and F r e e m a n and Thibos (1975). Typical examples of the responses obtained are depicted in Fig. 1, together with a psychophysical sensitivity function from F r e e m a n and Thibos (1975) for comparison. None of these authors mentioned the narrowness of the V E P tuning or c o m p a r e d it with the relatively broad psychophysical function. Yet the V E P seems to be consistently tuned to as little as 2 octaves at half-height, whereas the psychophysical function spreads over at least 4 octaves at half contrast. The narrow tuning of the V E P is a surprise, since it means that there are gratings of some spatial frequencies which are highly visible and yet produce little response from the cortex under the recording conditions used. Rather than
Multiple Spatial-Frequency
537
a l l o w this m i s m a t c h to b e d e t r i m e n t a l to t h e u n d e r s t a n d i n g o f e v o k e d p o t e n t i a l s , w e d e c i d e d to e x p l o r e t h e q u e s t i o n o f n a r r o w t u n i n g in t h e V E P , to see if it w a s a robust phenomenon. We have studied the detailed characteristics of the tuning to e n s u r e t h a t it was n o t a r e s u l t o f s o m e o t h e r e f f e c t , s u c h as a n a c c e l e r a t i n g c o n t r a s t f u n c t i o n , a n o n - l i n e a r r e s p o n s e to t h e e d g e s o f t h e b a r s in t h e g r a t i n g , o r e l e c t r i c a l s u b t r a c t i o n b e t w e e n r e s p o n s e s f r o m d i f f e r e n t c o r t i c a l areas.
Methods Stimulus Stimulus patterns were presented on the face of a Hewlett-Packard cathode ray tube (CRT) display (Model 1332A, P31 Phosphor) following a modification of the method employed by Schade (1956) and Campbell and Green (1965). Either a flickering homogeneous field or a counterphase flickering grating of varying stimulus dimensions could be generated. Linearity of the intensity modulation was determined by plotting luminance as a function of Z-axis voltage. A selenium photocell used in all light measures, including those of contrast, was operated in the photovoltaic mode. Long-term stability of the photocell output was periodically tested against a 100 ft 1. Gamma Scientific (Model 220) standard source. The mean luminance of the 10 x 12 cm display screen was set at the midpoint of the measured linear operating range; this setting allowed for contrast modulation of up to 0.80. To increase or decrease the mean luminance, appropriate neutral density filters were utilized, Contrast, which was measured according to the standard Michelson (1927) definition, could be adjusted in 0.1 log unit steps.
Recording and Data Analysis Steadystate visually evoked potentials were recorded with a bipolar electrode placement based on the optimum position for pattern-evoked potentials determined by many previous authors (Harter and White, 1970; Cobb et al., 1967; Jeffreys and Axford, 1972). Unless stated otherwise, the recording electrodes were placed 3 cm above the inion and 3 cm above and lateral; the ear served as ground. To improve the signal-to-noise ratio of the steady state evoked potential, the EEG was analyzed by means of a synchronous narrow-band filtering technique (see Fig. 2) basically similar to those employed by Van der Tweel et al. (1958) and Fricker (1962). The amplified EEG signals were first pre-filtered through a Kron-hite (Model 330-M) 24 db/octave bandpass filter with cutoff frequencies set at 0.1 log unit below and above the stimulus alternation rate, eliminating harmonics of the fundamental response frequency. The pre-filtered signals were then passed through a synchronous constant narrow bandwidth (0.3 Hz) commutating filter, the center frequency of which was equal to and driven by the second harmonic of the stimulus frequency. Cortical potentials were analyzed at twice the stimulating frequency because we have found, as have several authors (e.g., Spekreijse, 1966; Cobb et al., 1967), that the major frequency component of the evoked potentials produced is equal to the phase alternation or stimulus reversal rate rather than the fundamental stimulus frequency which is 1/2 the phase alternation rate. To distinguish between the stimulus frequency and the stimulus alternation rate, cycles per second (Hz) are used to denote the former while reversals per second (rps) are used to denote the latter. The filter output was full-wave rectified and integrated over a lO-s recording epoch with the results displayed on a digital counter.
Noise Analyses Unlike most previous authors using a synchronous filter technique, we felt it important always to distinguish carefully the neural activity evoked by the stimulus from the uncorrelated background
538
C.W. Tyler et al.
STIMULUS
RECORDING
_____