MULTIPLE VIEWPOINTS IN FUNCTIONAL SIZE MEASUREMENT Christopher Lokan School of Computer Science University of New South Wales Australian Defence Force Academy Canberra ACT 2600, Australia +61 2 6268 8060
[email protected]
ABSTRACT Although there is broad agreement on the sorts of things to take into account when measuring functional size, there is a variety of opinion about how to do it. This is partly because several different views of functionality are addressed in functional size measurement. Some are better understood than others. In particular, the “general systems characteristics” (GSC’s) and “value adjustment factor” (VAF) are poorly understood. Our aim is to provide a foundation for research that may improve this aspect of functional size measurement. A survey of the evolution and state of practice of the GSC's and VAF leads us to identify various aspects of software that are important in functional size measurement. We relate these aspects of software to different views of functionality. A spectrum of viewpoints is seen, with core functionality at one end, effort estimation at the other, and different user viewpoints in between. By noting how the GSC’s and VAF contribute to these viewpoints, we see how value may be gained from them, and we identify directions for future research.
1.
INTRODUCTION
Albrecht proposed Function Point Analysis (FPA) in 1979 [4], as a measurement method for software functional size. Albrecht labelled the output of this measurement method as Function Points. His aim was to define a measure of work product that could be used to understand productivity. Function points are computed as a sum of five weighted function types. Albrecht chose the weights to reflect an intuitive concept that he referred to as "value to the user," but which he did not define precisely. Since function points can be computed from a specification document, and are based on things that are important in a user's view of functionality,
Alain Abran Université du Québec à Montréal Département d'informatique C.P. 8888, Succ. Centre-ville Montréal (Québec), Canada H3C 3P8 +1 514 987 3000 (8900)
[email protected] they are widely accepted as a measure of functional size. They are most successful in datastrong systems. Function points are used now for several purposes. One is as a normalizing factor. Hours per function point is used as a measure of productivity, as Albrecht intended. Defects per function point is another measure that is used. Second, many people have noted that size in function points is related to development effort. This means that rules of thumb – and even environment-specific prediction systems – can be developed that assist in predicting the effort and cost of a project. Third, Albrecht himself was the first to note relationships between size in function points and program length in lines of code, based on a documented data set [5]. Similarly, Jones has published a large table of multipliers [16], with which functional size of software can be approximated from its physical program size in different languages, and vice versa (although these tables are not supported by documented evidence). The need for measures of functional size is clear. Practitioners, especially the International Function Point Users Group (IFPUG), have driven their refinement as measurement methods. The most widely used definition of Function Points is given in the IFPUG Counting Practices Manual [12]. The international standard on functional size measurement concepts and definitions is documented in ISO/IEC standard 14143-1 [13]. Structurally, two models are involved in function points [1]. In the Function Point Measurement Model (FPMM), many items are counted that are related to functionality. These include the numbers of data and record elements in each data file referenced by the system, and the numbers of data elements and file types referenced in each input, output, and inquiry. In the Function Point Productivity Model (FPPM), the elements from the FPMM are classified,
International Workshop on Software Measurement (IWSM’99) – September 8-10, 1999 Lac Supérieur, Canada
functional size measurement. To do this we need to look at the GSC's themselves – how they are structured, how they are used in practice, where they succeed, and where they fail – and at how they relate to other aspects of functional size measurement.
weighted, and combined to produce the overall “unadjusted FP” (UFP) value. The adjustment phase of Function Point Analysis can be seen in the same light. A measurement model defines a collection of “General System Characteristics” (GSC's) and how to measure them. A second model combines the measurements to produce a single “Value Adjustment Factor” (VAF). It is not clear whether this second model is a measurement model or a productivity model; it could be argued either way, depending on the viewpoint selected for the interpretation of the results. The unadjusted FP value is multiplied by the VAF to give the final “adjusted FP” (AFP) value.
Section 2 surveys and comments on research observations about the GSC's and VAF, and what others have said about them. Section 3 characterizes the GSC’s and other aspects of software that have been or perhaps should be considered in functional size measurement. Section 4 relates these different aspects of software to different views of functionality. Section 5 discusses what value may be gained from the GSC's and VAF, even though they may be imperfect in their current formulation. Section 6 presents conclusions, and suggests directions for future research.
Several modifications to the Function Point model have been proposed, in attempts to correct perceived weaknesses. Some extend the set of items counted in the FPMM; examples are Feature Points [15], 3D Function Points [25], and Full Function Points [2, 22]. Others, such as Mark II Function Points [23, 24] define a different set of items to count in the FPMM, concentrating on logical transactions (rather than classifying transactions separately according to the IFPUG definitions of inputs, outputs, inquiries), and not taking into account the files. Others, such as Full Function Points, consider a lower level of granularity to take into account internal functionality of sub-processes. The FPPM is also different in Mark II Function Points. Mark II Function Points define a different set of GSC's, while retaining the general method for computing the VAF. Jones [16] reduces the set of items to count in the FPMM, replaces the IFPUG GSC's with a different formulation, and modifies the FPPM.
2.
THE ADJUSTMENT PHASE IN FPA
Albrecht and Gaffney [5] motivated function points this way: “The thesis of this work is that the amount of function to be provided by the application (program) can be estimated from an itemization of the major components of data to be used or provided by it. Furthermore, this estimate of function should be correlated to both the amount of ‘SLOC’ to be developed and the development effort needed.” There have always been two phases in function point calculation. The first deals with the “itemization of the major components of data," giving unadjusted function points. The second applies “some general application characteristics to adjust the standard processing measure for processing complexity” [5].
Despite broad agreement on the sorts of things that should be taken into account when measuring functional size, opinion varies on how to do it. What should be measured and how, and what structures should be used to combine or interpret the elementary measurements? Models, methods, and techniques for the measurement of functional size are still evolving.
The adjustment phase may be seen in two ways. The general characteristics are intended to measure important things about software that are not part of UFP; these are still aspects of size. The resulting adjustment, which raises UFP for “more complex” software and lowers it for “less complex” software, is presumably done to support the correlation between the estimate of function and the development effort needed.
The theme of this position paper is that several different views of functionality are addressed in functional size measurement. Some are better understood than others. In particular, the GSC's and VAF are poorly understood. They are generally seen as important, but not very successful. Our aim is to provide a foundation for research that may improve this aspect of
The description of the adjustment phase has always concentrated on allowing for complexity. It appears that the adjustment factor is the end, and the general systems characteristics are the means to the end.
122
processing, performance considerations, heavily used operational configuration, on-line data entry, and complex internal processing. One (element complexity) was shifted to the UFP stage, as noted above. Two were combined: backup was merged into on-line update. One was dropped: interactive dialogues no longer count as a separate GSC. Seven new characteristics were added: transaction rate, end user efficiency, reusability, ease of installation, ease of operation, use at multiple sites, and facilitating change.
This section surveys the different proposals for GSC’s and the VAF. Section 2.1 traces their evolution, as people have described them when proposing new forms of FPA. Section 2.2 looks at how researchers and practitioners have seen them. A summary is presented in Section 2.3. 2.1
Evolution of FPA adjustments
Albrecht’s initial formulation When Albrecht first proposed function points in 1979 [4], the adjustment phase allowed for a variation of ± 25% for complexity. It involved making subjective estimates of the degree of influence of ten factors, and allowing a 5% effect for each.
IFPUG FPA Standard IFPUG has not altered the structure of the adjustment process. Assessing the degree of influence of each factor in the adjustment process has become less subjective. IFPUG’s Counting Practices Manual [12] provides guidelines on how to assess the degree of influence of each factor, making this process more objective and repeatable.
The ten factors were backup and recovery provisions, data communications, distributed processing, performance considerations, heavily used operational configuration, on-line data entry, conversational dialogues for data entry, on-line updates, complex elements (inputs, outputs, files, inquiries), and complex internal processing.
Symons – Mark II Function Points With Mark II Function Points [23, 24], Symons aimed explicitly to strengthen the relationship between function points and effort. He expected the calculation of function points to change as technology changed, rather than being a fixed property of any given system. Symons’ approach gains value for estimation, while reducing the value and practicability of comparing software from different environments or different technological generations.
Criticisms of the initial formulation were that the process was too subjective, and that ± 25% was not enough variation [16]. 1984 Albrecht revision of FPA Albrecht revised FPA in 1984 [11]. The revised form became the foundation of the IFPUG approach to FPA, which dominates today as a de facto standard.
Besides altering the counting of basic functional elements, and how to combine those counts, Symons altered the adjustment process. He felt that 14 GSC’s were not enough, and the particular 14 were not likely to remain the most important characteristics as time passed. He also thought it inappropriate to give each characteristic the same weight when computing the adjustment factor.
The handling of complexity was changed in two ways. First, element complexity is no longer treated as a single pervasive attribute. Instead, it is shifted to the elements that make up the specific countable functionality of the system. Each input, output, inquiry, and file is assessed separately for complexity. (In this context “complexity” is a misnomer, since it suggests difficulty of understanding or implementation. Here it is assessed according to the number of data and record element types, so it is really “magnitude” rather than “difficulty” that is measured.)
He added five more GSC’s (interaction with other systems, security, access by third parties, documentation, special training needs), and made provision for the addition of further characteristics. He also proposed that the weights should be calibrated to reflect their appropriate values in a given technology.
Second, the number of characteristics was extended from 10 to 14, and consequently the range of potential variation extended to ± 35%.
Symons also altered the name of the adjustment factors, from “general system characteristics” to “technical complexity factors," and gave an important definition [23]:
The things considered to be GSC’s changed a lot from 1979 to 1984. Six of the original ten were retained: data communications, distributed
123
more often on the VAF, and sometimes on both. The questions considered are which characteristics to measure, how to measure them, how to combine the measurements to produce the VAF, and the effect of applying the VAF.
“A TCF component is a system requirement other than those concerned with information content, intrinsic to and affecting the size of the task, but not arising from the project environment."
2.2.1 The set Characteristics
Jones Jones has put forward a variant of function points, simplifying their calculation [16].
Three things are assessed for complexity: problem complexity, data complexity, code complexity (the third is not considered in predevelopment estimation). Calculation of the adjustment factor takes the same form as the earlier proposals. Because a coefficient is higher in the adjustment formula (0.1, rather than Albrecht’s 0.01 and Symons’ 0.005) the range of possible adjustments is wider.
Several other approaches to functional size measurement have been proposed, including feature points [15], 3D function points [25], Full Function Points [2, 22]. In each of these, either the adjustment process is not described, or the IFPUG GSC/VAF formulation is adopted. From the point of view of this paper on GSC’s and VAF, they have nothing to add. Functional
Garmus and Herron [10] and Lokan [20] have noted that patterns can be observed in the GSC’s for different types of software.
Size
In the ISO standard on Functional Size Measurement [13], the focus is strictly on specific itemized functionality, based on functional user requirements. The General System Characteristics and Value Adjustment Factor are excluded from functional size measurement. It was agreed unanimously at the international level not to include the VAF within an ISO-recognized measurement method for functional software size. 2.2 Reactions practitioners
from
researchers
System
Conversely, some researchers suggest that 14 characteristics are too many. Kitchenham et al. suggest that general relationships exist between the adjustment factors, that are not due to specific characteristics of a given data set [19]. Kitchenham [18] and Lokan [20] found independently that there is common variation within the GSC’s; in each of these studies, only 5 or 6 underlying factors seemed to be involved, rather than 14. Benyhaia et al [6] found in a substantial data set that it is very difficult to distinguish the 14 factors statistically. Either there is not enough data – many of the data points are missing – or there is not enough dispersion among their values. Only seven of the 14 factors were significant in their sample.
Other approaches to FPA
for
General
Symons has suggested that an open-ended approach is needed to the GSC’s [23]. Symons feels that more than 14 seem necessary – he has extended it to 19 – and the particular set of GSC’s may need to vary over time. In criticizing Symons’ proposal, Jones has asked why stop at 19 – perhaps over 100 factors might be relevant [16]. Jones prefers to stick with the original 14, for the sake of conforming with “the assumptions of the original IBM assertions” – or presumably to use his own formula in which only problem and data complexity are considered.
Jones’ method has much in common with Albrecht’s initial proposal. File and transaction elements are counted, with no separate assessment of complexity. The treatment of complexity is moved back to the adjustment phase.
ISO Standard Measurement
of
Several authors have identified GSC’s that might benefit from being redefined. Symons noted that performance, heavily used configuration, and transaction rates (all essentially performance constraints) were hard to differentiate; so were online entry, on-line update, and end user efficiency (all to do with interactive use of the system) [23]. Garmus and Herron [10] and Lokan [20] both note that communications and interactivity have become so pervasive nowadays that the associated GSC’s have lost their discriminative value.
and
Research and commentary on the GSC’s and VAF have focused sometimes on the GSC’s,
Kitchenham [18] comments that several of the GSC’s resemble cost drivers, rather than size
124
applied, even though each interval may be unique, potentially distinctly spaced, and could have a different impact on overall size depending on its rank. Further, this is assumed to hold equally for all 14 characteristics, whatever their nature.
drivers (even though few have a statistically significant relationship with productivity). She warns that “if adjusted function points are used to assess product size and are then put into a cost model that applies cost drivers to its effort prediction there is a real danger of applying an adjustment for certain factors twice.” 2.2.2 Measurement of the measurement process model)
GSC’s
2.2.3 Computing the VAF (VAF productivity process model)
(VAF
In contrast with Boehm’s COCOMO model [7], in which 15 productivity factors were identified that apply to the production process rather than to the software to be delivered, Albrecht's original contribution in FPA was to identify 14 general system characteristics that apply “to the software itself”. Unlike Boehm’s model, each of the 14 factors has the same importance (statistical influence), in the same six point scale, with the same weight of 0.01.
Abran [1, 3] has investigated the measurement operations within the VAF, as defined in Albrecht’s 1984 version of the VAF and still in use in the 1999 IFPUG version. The measurement process within the VAF transforms the unadjusted function points into adjusted function points, using a linear transformation on the 14 general characteristics of the application: •
Each of the 14 characteristics is subdivided into six ranks;
•
Each rank is ordered, from the smallest to the greatest;
•
Each rank is assigned an integer value in the range 0 to 5;
•
The resulting value is multiplied by 0.01, giving a result in the range 0.0 to 0.05.
Several authors have questioned the appropriateness of always giving the same weight [3, 6, 23]. Benyhaia et al [6] pointed out another problem. From the statistical point of view, the 14 adjustment factors should not be added, because they influence one another. They suggested that the factors should instead be multiplied. 2.2.4
In this set of transformations, there are serious methodological weaknesses from the point of view of measurement systems.
Applying the VAF
Nobody that has investigated the VAF seems very happy with it.
First, ranking a characteristic constitutes measurement on a strictly ordinal scale, in an increasing order. But for most characteristics, the criteria for determining the classes do not represent steps of the same magnitude, even within a single characteristic. This means that when each ordered rank is labeled from 0 to 5, the link made between the rank order of the classification and the numerical value of its indicator is not appropriate. From a methodological point of view, the measurement is transformed improperly from an ordinal scale (that serves only to rank objects or attributes), through an interval scale type of unequal magnitude, to a ratio scale type (which serves normally to determine the difference between two numbers, when the ranking labels of 0 to 5 are interpreted as integers from 0 to 5).
Several researchers have found that the VAF makes no difference to the accuracy of effort estimates. The relationship between adjusted function points and development effort is no stronger than that between unadjusted function points and development effort [1, 6, 14, 17, 20]. This is probably because in most systems the VAF ends up very close to 1.0 [20, 24]. Lokan noted that the VAF is not reliable even as a simple indicator of whether effort is likely to be more or less than “average” for a given UFP [20]. Kitchenham found it to work in the opposite way to what might be expected [19]: “It is also interesting to note that the projects with high levels of these factors are those that exhibited higher productivity than projects with low levels of the factors, so the use of a function point adjustment factor would make the increased
Second, each interval for each characteristic is interpreted as though equal in the 0 to 5 integer value range. The same weight of 0.01 is always
125
productivity of those appear even greater.” 2.3
example is the way graphical user interfaces, online help, and error messages are addressed in FPA: since they are not part of “specific countable functionality”, they are handled within the GSC’s [12].
projects
Discussion
From the beginning, there has been a separation of the detailed functionality of the system (the “specific countable functionality” [12]) from other things that are seen as attributes of the system as a whole.
The notion that the GSC’s are a part of size measurement seems to be lost as soon as people think about the adjustment factor. The value of the adjustment phase is generally judged by whether or not it improves the explanatory relationship between size and effort. When the VAF does not help in this context – as it seems not to – the whole adjustment process is sometimes abandoned, GSC’s and all.
Garmus and Herron describe these other things as “pervasive general factors that are not sufficiently represented by the countable transactions and data functions” [10]. IFPUG calls them indicators of the “general functionality of the application” [12]. Symons notes that they should be “system requirement[s] other than those concerned with information content, intrinsic to and affecting the size of the task” [23].
At the time of writing, IFPUG is conducting its own study into the usage and perceived value of the GSC’s within the VAF. The GSC’s and VAF are excluded from the ISO standard on functional size measurement. Researchers have dismissed the VAF, although some see potential value in the GSC’s from which it is constructed. Among practitioners, many (particularly in the USA) use the adjustment process as IFPUG describes it. This at least means that the FPA counting process is applied consistently, enabling comparisons between organizations. It should be pointed out that similar consistency is achieved if comparisons are made using unadjusted function points, without the VAF being taken into account.
There is clear agreement that the GSC’s should be things that are “intrinsic” to the application. How many GSC’s there should be, and precisely what they should be, is not clear. Opinions range from two factors, to 14, to 19, to perhaps over 100. Empirical research on the usual 14 GSC’s suggests that 5 to 7 factors are sufficient. Several suggestions have been made for rationalizing or redefining some of the 14 GSC’s. Methods for combining the GSC’s to compute a Value Adjustment Factor have not changed much since Albrecht’s original proposal. That approach, still present in the IFPUG standard, was based mostly on intuition. It did not benefit from any theory, and there is no mention of any statistical foundation for this part of the Function Point model.
A growing number of practitioners do not use the adjustment phase at all. The GSC’s are either ignored, or are taken into account as cost drivers in effort estimation.
Although the number of terms and the coefficients have changed in later proposals, and there is significant disquiet at the GSC’s all having the same weight, the nature of the formula has stayed essentially the same. The only significant exception is Benyhaia et al’s suggestion that the adjustment process should operate as a series of multiplications [6], but this approach has not taken off yet.
Functional size measurement is all about measuring the size of a software product from the user’s point of view.
The GSC’s have not been used in an open-ended way. This is presumably for the sake of conformance with IFPUG’s de facto standard. Rather, as things have been identified as important in functional size measurement, the emphasis has been on devising ways to accommodate them in the usual 14 GSC’s. An
Requirements can be grouped into several classes. For example, Pfleeger [21] suggests the following categories: physical environment, interfaces, users and human factors, functionality (including performance constraints), data, resources, security, quality assurance. Many of these affect users directly.
3.
ASPECTS OF SOFTWARE TO CONSIDER IN FUNCTIONAL SIZE MEASUREMENT
The product to be delivered by a software development project is defined in a software requirements specification. Most requirements, but not all, relate to the tasks to be performed by the software application.
126
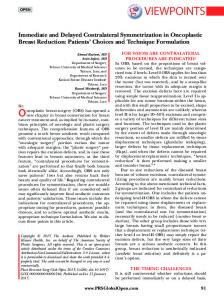
The question is which things ought to be addressed in functional size measurement, and how. We approach this question here by constructing a list of things which typically appear in a software requirements specification, or which are included in any of the mainstream FPA proposals, or both. The list is presented in Figure 1. (Items shown in italics in Figure 1 are included in existing methods of functional size measurement. Most other items have been the subject of debate on whether or how they should be treated in functional size measurement.) All of the software aspects listed in Figure 1 are likely to appear in a requirements specification. All are related to the product itself, rather than the project that delivers the product. Each could be varied separately while the others are held fixed. Thus they can be seen as separate dimensions of a software product, which are candidates for inclusion in measurements of the product. By classifying these aspects of software, we can gain some insight that helps us to understand and explain the different views of FPA and its components. In Figure 1, the items are first classified into categories (shown in bold type). The categories are then classified on two criteria: •
Are they concerned with real purpose of the system or not; and
•
Are they concerned with functional or nonfunctional aspects of the system. (By “functional” we mean the tasks performed by the system – what a user can do with the system. “Non-functional” aspects are not part of the tasks of the system, but affect how it does those tasks, or constraints that must be satisfied.)
Observations that follow from this classification are presented in the next section.
127
Related to system purpose
Functional requirements
Not related to system purpose
Functionality: IFPUG UFP, Mark II UFP, 3D FP, Full FFP, ISO 14143-1, …
Interface: GUI, etc User support: Help, error handling End user efficiency Facilitate change Third party access Training Operation: Ease of installation Ease of operation Security Backup and recovery Interaction: On-line entry On-line update Other systems
Constraints: Performance Transaction rate etc.
Constraints: Heavily used config Complexity: Inherent complexity
Nonfunctional requirements
Reusability: Reusability Quality: Maintainability, Code standards, … Architecture: Distributed system Data communications Multiple sites Documents: Documentation Figure 1 – Classification of software aspects
4.
4.1
FPA ELEMENTS AND FPA VIEWPOINTS
A spectrum of views
Beginning with the top-left quadrant of Figure 1, and adding the other quadrants progressively, we see a spectrum of views. At one end, we start with the “functional size of the problem” – the core functionality, captured by unadjusted function points. At the other end, we see the full set of product-related factors that influence the relationship with development effort, which Albrecht expected to see and Symons aims for explicitly. In between we have the “size of the application” from the user’s point of view, and the set of factors which influence “value to the user”.
As noted above, the question is which things ought to be addressed in functional size measurement, and how. Different authors have given different answers, according to their views on what should be handled in detail and what should be regarded as general characteristics; and according to whether the basic aim is to measure “functionality”, or to measure “value to the user”, or to relate size to development effort. Several observations can be made, with reference to Figure 1, that help us to understand the differences between these points of view.
128
Functional size of the problem
4.2
Everybody agrees on the top left quadrant: tasks done by the system that are related to its real purpose are at the heart of functional size. Nothing outside this quadrant is recognized by ISO as part of functional size measurement. This quadrant might be described as capturing the “functional size of the problem” from the user’s point of view. It represents the smallest common denominator across all current measurement methods for functional size. Research continues on the best forms of FPMM and FPPM with which to measure it; they are not the topic of this paper.
Detail vs general
Two things are “intrinsic” to the problem: the top left quadrant, and the “inherent complexity” of the problem (Fenton calls inherent complexity a third dimension of size, along with functionality and physical size [9]). Everything else is related to the product that solves the problem.
User view vs developer view
Other comparisons
Only the top left quadrant is counted in detail, by measuring each of the “functions” in the system individually. Everything else is assessed as a characteristic of the application as a whole, not of individual pieces of the application. Cost drivers vs size drivers Things listed in the bottom row affect the difficulty of implementing the software. They are better regarded as cost drivers, not size drivers.
Things listed in the bottom right quadrant are of no concern to the user. If the intention is to measure software from the user’s point of view, these things do not belong in functional size measurement.
“Inherent complexity” is only one of the usual GSC’s – it means is the calculation hard or easy. In its aim to adjust for inherent complexity, the current VAF casts a far broader net; Jones [16] limits the adjustment much more closely to inherent complexity.
From the developer’s point of view, everything in Figure 1 affects the implementation, and the eventual physical size. Product vs project Nothing in Figure 1 is “consequent on the environment” (to use Symons’ words) – eg language, people, team size, etc. Those things are project attributes, not product attributes. They clearly influence work effort, but they have no role per se in functional size measurement.
User’s view of functional size The top two quadrants describe things that affect what the user can do with the system. This row might be described as capturing the “functional size of the application” from the user’s point of view.
5.
This is still counted from the specification, with the user in mind. It is distinct from the physical size of the implementation of the application.
OBTAINING VALUE FROM THE VALUE ADJUSTMENT FACTORS
Multiple constraints and limitations on both the VAF process and the general systems characteristics have been highlighted and discussed in the previous sections.
Value to the user Three quadrants – all except the bottom right – contain things that are visible to the user. If the intention is to measure “value to the user”, everything except the bottom right quadrant should be taken into account.
5.1
Value Adjustment Factor process
The VAF process, as currently structured, has less potential than the individual GSC’s.
Relating size to effort
From a measurement perspective, it is unsound. From a practical viewpoint, empirical studies indicate that it brings no contribution to productivity and estimation models. Fortunately, it does not hurt much either.
All four quadrants in Figure 1 need to be taken into account when estimating or explaining the nature and effort of the task of developing the product.
Its structure needs a major overhaul. Proper treatment of the detailed measures of its constituent components (the GSC’s) is a must.
129
things (backup and recovery, and on-line operation) [20]; it should perhaps be split up. Symons’ note [23] that performance, heavily used configuration, and transaction rates are hard to differentiate, as are on-line entry, on-line update, and end user efficiency, might also be addressed. Note that several of these are identified above as cost drivers; their re-definition should view them accordingly, and not try to fit them back within functional size measurement.
No result computed by combining measurements of the GSC’s can be expected to make any practical contribution, unless it is constructed with sound mathematical transformations. No research papers have yet been published tackling this issue. 5.2
General Systems Characteristics
Just because the VAF does not seem to work for its main purpose, does not mean that the GSC’s need to be abandoned. They may still be useful for measuring things that matter to users.
The UFP’s and GSC’s measure different aspects of an application (functionality, interface, interaction, etc). It may be better to regard size as having multiple different dimensions, rather than trying to combine them all into a single number.
As long as a measurement process manipulates numbers that clearly measure aspects of functionality, it can at least be argued that a measure of functional size is the result. Files and transactions are clearly aspects of functionality; this is the basis on which unadjusted function points are used as a measure of functional size. It is not so clear that all of the GSC’s measure aspects of functionality. For example, “functionality” does not change because the programming happens to be more or less complex, or worries more or less about heavily used configurations
6.
CONCLUSIONS
Functional size measurement has been approached from several different points of view. At one extreme, function points are seen as measuring core application functionality and nothing else; from the other extreme, function point analysis includes so many factors that are related to the difficulty of implementing a system that function points are regarded by some as a surrogate measure for effort. In between come some other points of view, which include to varying degrees the things that matter to a user of a software application.
Clearly, some of the GSC’s are cost drivers. Those that are listed in the bottom row of Figure 1 should be removed from functional size measurement. They should still be measured, but they should be handled as cost drivers for project estimation, rather than built into size measurement or estimation.
By reviewing the history of the GSC’s in various function point proposals, and then classifying the GSC’s and other aspects of software according to these viewpoints, we have seen which characteristics support which points of view. This has enabled us to make some recommendations on which characteristics to include in functional size measurement, and which to exclude.
Many of the GSC’s measure things that do matter to users. These aspects should be measured somehow, when assessing software from the user’s viewpoint, so the concept of the GSC’s is worth retaining.
Many directions for future research present themselves. How many factors should be included in functional size measurement, and which should they be? How should they be identified – by theoretical proposal, or by empirical research? How should they best be measured – on a 0–5 scale still, or something else? How should the measurements be combined, and then how should they affect the unadjusted size? How should change be accommodated – by extending the measurement process, or replacing old elements of it with new ones, or devising ways to fit new elements into an existing structure? How should measurements of core functionality be combined with other measurements – by combining them to give a single number (and if
The best use for those GSC’s that are not cost drivers is for classifying projects. Different types of software use the GSC’s in characteristic ways [10, 20]. This means that projects can be grouped according to their GSC values, probably into not very many groups. This supports comparisons between similar projects, and helps in finding groups of projects that might be treated together for effort estimation. Some GSC’s would benefit from being redefined. Two (on-line entry, data communications) have lost their discriminative value, since almost all projects give them the maximum score [20]. One (on-line update) seems to combine two different
130
8. Desharnais, J.-M. Analyse statistique de la productivité des projets de développement en informatique à partir de la technique des points de fonction. Masters thesis. Université du Québec à Montréal. December 1988.
so, with what relative weights), or treating them as different dimensions of a vector? The answers to questions such as these will come partly from proposals based on theory, partly from empirical research, and partly from practical experience. Value to practitioners must be kept in mind.
9. Fenton, N.E. Software Metrics: a Rigorous Approach. Chapman and Hall, London, 1991. 10. Garmus, D. and Herron, D. Measuring the Software Process: a practical guide to functional measurements. Prentice-Hall, Upper Saddle River NJ, 1996.
ACKNOWLEDGMENTS We wish to thank the Australian Defence Force Academy, Bell Canada, and the Natural Sciences and Engineering Research Council of Canada for research funding. The opinions expressed in this paper are solely those of the authors.
11. IBM Corporate Information Systems and Administration. AD/M Productivity Measurement and Estimate Validation. CIS&A Guideline 313, IBM, Purchase NY, November 1984.
REFERENCES
12. International Function Point Users Group. Function Point Counting Practices Manual, Release4.0. IFPUG, Westerville OH, 1994.
1. Abran, A. Analyse du processus de mesure des points de fonction. PhD thesis, École Polytechnique de Montréal, Montréal, March 1994. 2. Abran, A., Maya, M., Desharnais, J.-M., and St-Pierre, D., Adapting Function Points to Real-Time Software, American Programmer, 10(11): 32–43, November 1997.
13. International Organization for Standardization. Information technology – Software measurement – Functional size measurement – Part 1: Definition of concepts. ISO/IEC 14143-1:1998.
3. Abran, A. and Robillard, P.N. Function points: A study of their measurement processes and scale transformations, Journal of Systems and Software, 25(2): 171–184, May 1994.
14. Jeffery, D.R. and Stathis, J. Function point sizing: Structure, validity and applicability. Journal of Empirical Software Engineering, 1(1): 11–30, 1996.
4. Albrecht, A.J. Measuring Application Development Productivity. Proc. IBM Applications Development Symposium, GUIDE Int. and SHARE Inc., IBM Corporation, Monterey CA, October 1979, p. 83–92.
15. Jones, C. Feature Points (Function Point Logic for Real Time and System Software). IFPUG Fall Conference, Montréal, October 1988. 16. Jones, C. Applied Software Measurement (2nd edition). McGraw-Hill, New York, 1996.
5. Albrecht, A.J. and Gaffney, J.E. Jr. Software Function, Source Lines of Code, and Development Effort Prediction: a Software Science Validation. IEEE Transactions on Software Engineering, SE-9(6): 639–648, November 1983.
17. Kemerer, C.F. An empirical validation of software cost estimation models. CACM, 30(5): 416–429, May 1987. 18. Kitchenham, B.A. Empirical studies of assumptions that underlie software costestimation models. Information and Software Technology, 34(4): 211–218, April 1992.
6. Benyhaia, H., Desharnais, J.-M., Hudon, G. and Martin, C. Adjustment model for Function Points scope factors – a statistical study. IFPUG Spring Conference, Florida, April 1990.
nd
19. Kitchenham, B.A. and Kirakowski, J. 2 analysis of MERMAID Data, ESPRIT Project P2046, Deliverable D3.3B, Oct. 7 1991.
7. Boehm, B. Software Engineering Economics. Prentice-Hall, 1981.
20. Lokan, C.J. An Empirical Analysis of Function Point Adjustment Factors. Technical Report
131
CS03/98, Australian Defence Academy, December 1998.
Force
21. Pfleeger, S.L. Software Engineering: Theory and Practice, Prentice-Hall, Upper Saddle River NJ, 1998. 22. St.-Pierre, D., Maya, M., Abran, A., and Desharnais, J.-M., Full Function Points: Function Points Extension for Real-Time Software - Concepts and Definitions, Technical Report no. LRGL-1997-03, Université du Québec à Montréal, Montreal, March 1997. 23. Symons, C.R. Function Point Analysis: Difficulties and Improvements. IEEE Transactions on Software Engineering, 14(1): 2–11, January 1988. 24. Symons, C.R. Software Sizing and Estimating: Mk II FPA. Wiley, Chichester UK, 1991. 25. Whitmire, S.A. 3D Function Points: Scientific and Real-Time Extensions for Function Points. Proc. Pacific Northwest Software Quality Conference, 1992.
132