Vol.2-87
Algebraic Thinking
MULTIPLE VS. NUMERIC APPROACHES TO DEVELOPING FUNCTIONAL UNDERSTANDING THROUGH PATTERNS –AFFORDANCES AND LIMITATIONS FOR GRADE 4 STUDENTS Ruth Beatty oise/ut
Joan Moss oise/ut
[email protected]
In this paper we present different approaches and outcomes of two grade 4 students who were participants in an intervention study for the development of an understanding of functions through patterns. We contrast one student who used multiple representations (visual, narrative, graphic and numeric) to another who relied exclusively on numeric tables in order to reveal the affordances and limitations of these approaches. Theoretical Framework and Research Project Patterning problems are presented in a variety of contexts - geometric, tabular, and narrative with the idea that students will gain an understanding of covariational functional relationships (Schliemann et al, 2001; Warren, 2000). However, in practice, most instruction prioritizes the numeric aspect of patterning (Noss et al., 1996; 1997), which Bednarz, Kieran and Lee (1996) note reduces these lessons to data-driven, pattern-spotting activities in which tables of numeric data are constructed and a closed form formula is extracted and checked with only one or two examples. The context and meaning of the variables thus become obscured, which severely limits students’ ability to conceptualize the functional relationship between variables, explain and justify the rules that they find (Stacey, 1989), and use the rules in a meaningful way for problem solving. This is a missed opportunity for learning as a number of researchers note that when visual representations are prioritized and students are able to make connections between visual and numeric patterns, they are also more able to find, express and justify functional rules (Healy & Hoyles, 1999). For the last three years we have been working on a research project with elementary students (e.g. Moss et al., 2005) to address the issues noted in the literature regarding students work with patterns. Based on our theoretical views we have been implementing and assessing experimental interventions in which we provide opportunities for students to integrate their understanding of numeric and visual growing patterns in the context of generalizing problems. (Moss 2005; 1996; Healy & Hoyles, 1999; Moss & Case, 1999). Research Design The design of our overall study is modeled on principles of design research (Lesh, 2002) in that the results of each iteration inform future studies. The data sources and general research methods are similar across all studies: Pretests and posttests are conducted, classroom lessons are videotaped and transcribed and artifacts are collected. Finally, detailed interviews are conducted at 3 time periods with six students of high-, medium- and low mathematics achievement. Thus, we are able to capture not only overall changes in student learning, but also to look closely at students’ strategies and to track the development of individual students learning. The impetus for the present study came from trends that were revealed in students’ strategies based on written tests and also on interviews. Specifically, we noticed that there were students in _____________________________ Alatorre, S., Cortina, J.L., Sáiz, M., and Méndez, A.(Eds) (2006). Proceedings of the 28th annual meeting of the North American Chapter of the International Group for the Psychology of Mathematics Education. Mérida, México: Universidad Pedagógica Nacional.
Vol.2-88
PME-NA 2006 Proceedings
our studies whose primary approach to problem solving was to reason using numeric strategies regardless of the kind of challenges they were attempting. This numeric orientation was in contrast to that of other students in our experimental classrooms who used the multiple representations that were offered as a context to understand and find rules for generalizing problems. Our instructional approach was specifically designed to focus on connections among multiple representations, with an emphasis on visual representations, in contrast to a more numeric approach, which typifies traditional instruction (Kalchman & Fuson, 2001). Thus we wanted to learn more about the differences in these types of problem solvers. Methods Participant The data for this study come from our Year 2 study of Grade 4 students, and the follow-up Year 3 study of Grade 5 students. The former study conducted over 3 month period in 2005 involved 51 Grade 4 students from 3 classrooms; 2 classrooms in an inner-city public school and a third from a university lab school. The Year 3 study in 2006 involved 57 Grade 5 students from 4 intact classrooms. Of note is the fact that 31 of our 51 participants in Year 2 took part in the Grade 5 study in Year 3. Instruction The instructional sequence in all classrooms began with “Guess My Rule” activities (e.g. Willouby, 1997; Carraher and Earnest, 2003) used to introduce students to rule finding for composite linear functions. The next set of activities involved students in building geometric growing patterns using position cards and pattern blocks. Incorporating the position cards served to help students understand the functional relationship between one data set or independent variable (i.e. the position number represented by number cards) and another data set or dependent variable (i.e. the number of blocks used in that position). In these lessons students were asked to think beyond “what comes next” to “what is the [functional] rule for this pattern”. The final component of the lesson sequence involved students in working on a series of word problems, designed to allow students an opportunity to further contextualize their understanding of the two components of a composite function (coefficient and constant). The Grade 5 curriculum also incorporated a graphing component. Students built composite geometric patterns and graphed them in order to gain an understanding of slope (coefficient) and intercept (constant). Activities included creating graphs from patterns, building patterns from graphs, and interpreting graphs in “real world” contexts through story problems. Data collection and analyses The data collection and analyses relevant to the present study included a pre and posttest as well as a retention test given 7 months after the posttest. Six students from each class representing different levels of mathematical achievement participated in videotaped interviews that we transcribed and coded. All data were analyzed as a function of students’ demonstrated level of mathematical achievement (based on teacher’s ratings of level of exhibited math achievement and report card marks in math). In addition students were assigned to one of two groups that characterized their approach to problem solving: Context, those that used the representational context as the site for problem solving, and Numeric, students who consistently created an ordered table of values, identified differences in the dependent variable data set, then used that to determine the composite linear function.
Vol.2-89
Algebraic Thinking
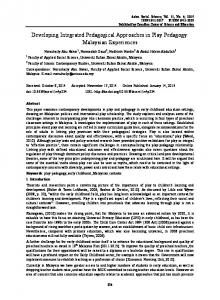
Results Statistical analyses of pre/post test score means of the experimental group as a whole revealed that students made significant gains. When repeated measure ANOVAs were conducted it was revealed that when the students were divided in three math achievement levels, H=14, M=24, L=18, that there was no interaction of group by time, indicating that the intervention had been successful for students in each of the ability levels. As noted above we were also interested in performance of students identified as Numeric or Context. When we analyzed gains from pre to post as a function of orientation we discovered that, while there was a slight difference in favor of the context group at both pre and post, these were not significant. It was only when we conducted an additional analysis (including a retention test) with the 31 students who were still available to be part of the research in grade 5 that significant differences appeared. Of these 31 students, 16 were designated as Context and 15 Numeric. While a multivariate repeated measures ANOVA with three time intervals as repeated factor, (Time 1 Pretest, and 2 and 3 as Posttest and Retention test respectively) confirmed that there was no effect Pre Post and Retention Scores of problem orientation between pre and posttest, this new as Function of Problem Solving Orientation analysis revealed a strong main effect of context in favour of the Context group when the retention scores were added. Figure 1 shows this interaction. It must be emphasized that there were similar proportions of high medium and low achieving students in both the Context and Numeric groups. To understand more about these two orientations to problem solving we conducted extensive qualitative analyses to define differentiating profiles of students in each of these two groups. In this paper we elaborate on the different approaches of students in our research program—students who developed the ability to move between visual, narrative, numeric and graphic representations and those who relied almost exclusively on generating numeric function tables—by presenting 2 case studies of students, one from each group. 9
Te s t Sco re s o u t o f 9
8 7 6 5 4
Co n te xt Nu m e r ic
3
co ntex t
2
n u mer ic
1
2
3
Pre Po s t Re te n tio n
The Case study of SH and MK SH (Numeric) and MK (Context), were students in the same Grade 4 classroom of an innercity public school. We selected these students for our study as both were rated as high in mathematical ability by their teacher, were competent and keen math students, and took part in Years 2 and 3 of our study. Furthermore, quantitative analyses at the end of the Grade 4 study indicated that both students showed equivalent gain scores on a pre/post test of functional understanding. However, when they were tested 7 months later, there was a significant difference in their retention scores - MK scored 100% correct and SH scored 69%. While the results of the posttest indicated that both students had developed the ability to determine functional rules of problems presented in visual, narrative and numeric contexts, the retention test results indicated that this understanding was less robust for SH, who was unable to answer a number of questions even though the problems on the retention test were similar to the types of problems she had encountered during the previous year’s intervention. SH and the Moonbat Problem Grade 4 lesson 7 As part of the lesson sequence of our study, students were presented with function problems embedded in narrative contexts, which they enjoyed and found appealing. In one problem, the “Moonbat Problem”, students were asked to consider the functional relationship between the age and height of fictional moonbats. In this problem, the students were given an unordered series of
Vol.2-90
PME-NA 2006 Proceedings
ages and heights and challenged to discover the underlying functional rule height=age x6+2. SH solved the problem using a “guess and check” strategy. “I think the rule is times six plus two, and I made a t-table to figure out to the moonbat at age 100. So the moonbat would be 602cm.” While this procedure allowed her to find and apply the rule, when asked two extension questions, “How tall is a moonbat when it is first born?” and, “How many cm does a moonbat grow each year?”, her incorrect answers revealed a limited understanding. “The moonbat is times six plus two when it is born. The moonbat grows times six plus two every year.” While SH was able to use the operations of the rule to calculate independent variable values, she did not understand the components of what the relationship meant in terms of the two data sets given. This numeric focus is further revealed in the next example that we present that was part of an interview that she participated in towards the end of the Grade 4 experimental lessons. Hexagon flowers interview As mentioned, six targeted students were selected to participate in a series of interviews during the course of the intervention. Below we present excerpts from an interview that one of the authors conducted. As will be seen in the verbatim protocol that follows SH has refined her method of finding a rule but still appeared to have a limited understanding of functions. The interview began with the researcher presenting a card with this picture. SH: I’m gonna make a t-table. It’s easier. [SH constructed an ordered t-table with input numbers from 1 to 4]. I know the rule. It’s times four plus two. I: How do you know? SH: I counted them – so for 1 (flower) there’s 6 (hexagons), and for 2 there’s 10, for 3 there’s 14, for 4 there’s 18, and if you count the differences [pointing to the output column], they’re all 4. So, the rule has something to do with the number 4. And if you do 1 times 4 it’s 4, but then you have to add 2, so it’s times four plus two. I: Good job. What part of the pattern shows the “plus two” ? SH: [pointing to successive pairs of hexagons] “There’s two, and then two and then two. There’s three sets of two, so six altogether. Six or eight, depends if there’s another one here.” For SH the constant was not constant, but increased in number for each successive visual representation. Thus we can see that in these first two examples SH has found a useful procedure to find rules, however we can also see that she has difficulty contextualizing her conjectures of rules in terms of the representation in which it is embedded, whether narrative or visual, and has a limited understanding of the nature of composite linear functional relationships. In the example that follows, from a retention test administered 7 months after the intervention was completed, we can see that the procedures that she relied on were forgotten. Tables and chairs: Grade 5 pretest (retention test item) One of the problems that we included on the retention test, the “tables and chairs problem” is well known in the literature on generalizing problems. Students are presented with the first three positions of a pattern and asked to find a functional rule that will allow them to predict the number of chairs that will fit around any number of tables. Although SH had done many problems of this kind during the Grade 4 intervention, and indeed could solve a more difficult variation of this problem 7 months earlier on the posttest of the Grade 4 intervention, the difficulty she had in attempting this problem in the retention test revealed how tenuous her initial understanding had been. First she attempted to use her
Algebraic Thinking
Vol.2-91
procedure of generating an ordered table of values to determine the recursive relationship of the chairs (“plus 2 each time”), but rather than finding the constant through a second differencing strategy, which she had typically done in Grade 4, she instead looked for a numeric pattern and expressed this relationship as “input number plus next input number plus 1.” When she attempted to answer the question of why this rule worked, SH was unable to relate her rule to the problem. For the extension questions, SH was unable to use her rule to predict how many chairs could fit around 100 tables. And, when asked to use her rule to figure out the number of tables for a given number of chairs, she was unable to understand the underlying reversal of thinking necessary to derive the independent variable from a given dependent variable. MK a visual contextual reasoner: SH’s numeric approach will be familiar to teachers or researchers who have worked with students on these kinds of generalizing activities. The students whose orientation was more contextual approached these problems differently, as exemplified by the reasoning of MK. In our view, as MK participated in the experimental lessons he appeared to develop a more robust understanding of functions, which was manifest in his fluent use of different representations both for problem solving and as the basis for explanations and justifications for his answers. For instance, on MK’s retention test he not only provided an algebraic rule for the tables and chairs problem, but also illustrated the rule by drawing a diagram of the tables and chairs, and labeling the top and bottom chairs as the “multiplicative part” (the coefficient) of the composite rule (x2), and the end chairs as the constant (+2). Furthermore, MK articulated a generalized understanding that he would be able to find the number of chairs needed for any number of tables. He was also able to reverse the operations of the rule in order to calculate the number of tables, (independent variable) when given the number of chairs (dependent variable). Certainly this kind of thinking was in direct contrast to the limited grasp of the problem demonstrated by SH. MK’s problem solving for the narrative moonbat problem (for which students were asked to find the functional relationship between the age and height of moonbats) also revealed this more robust understanding of functions. Like SH, MK was able to find the correct rule (y = 6x+2). However, MK was also able to explain the rule in relation to the problem, something that students with a purely numeric approach, such as SH, were unable to do. As he explained. “A moonbat is 2cm tall when it’s born and grows 6 cm every year.” His explanation clearly showed an understanding of the components of a composite function in a narrative context. The flower problem and structural similarities While the two examples above indicate MK’s ability to understand functional rules in different contexts (narrative/visual and narrative) the next example of his reasoning demonstrates his ability to discern functions in a purely visual context. “It’s times four plus two. Here it goes like a C, so there was a C and a C and a C and a C [MH used his finger to point out the C shapes left to right] and then these two remaining – and then it worked going this way [MH used his finger to show the C shapes going from right to left], and I knew there were four blocks in each C so it was times four, and there were four Cs so it was the fourth position.” MK was able to articulate his multiple ways of seeing the pattern, and connected this to his understanding of position number to generate a rule which he explained using the visual configuration of the pattern. Impressively MK was also able to relate his reasoning to similarly structured patterns he had worked on. “It’s like the Toothpick Problem when you start with one toothpick on the end
Vol.2-92
PME-NA 2006 Proceedings
and keep adding a box made of three toothpicks, so times 3 plus 1.” These kinds of connections were also typical of many of the other students in this project. Graphing: Moving to Grade 5 For a final example of the differences in the two approaches to problem solving we present data captured when the students were interviewed at the end of the Grade 5 intervention. Graphs were introduced in the Grade 5 experimental curriculum as a new representation of functions with the anticipation that this visual representation would bring out different kinds of reasoning in the students. However, as will be seen in the following excerpts from the interviews, while MK was able to look at graphs as another representation of a function, SH viewed them as a record of input and output numbers. In the interviews students were presented with a graph showing the function y=6x+2. Within seconds of seeing the graph MK asserted that it was “times 6 plus 2”. “You find out the constant by looking at the zeroth position [y axis] so that’s how I found out that the constant was 2. So then I …found out the difference which is 6, so yeah, and it grows by 6 each time so that’s the multiplicative [coefficient] so its times 6 plus 2.” MK was then easily able to think of a function that would create a parallel slope on the graph. “Times 6 plus 4 because in order to get a parallel line you need to have a different constant but you need to have the same multiplicative to get a parallel line. I mean all you do is start at a different point and then it just goes up by the same….by 6.” His use of the terms “start out” and “goes up by” indicates that MK saw the graph not just as a series of static points, but as a representation of linear growth. This was also apparent in his explanation when he was asked to find a function that would produce a slope that intersects with the one given: “Wait, let me try times 2 plus 8. Because, in order to have an intersecting line you need to have a different multiplicative and different constant. Because it starts at a different point and it goes up by a different amount. So it crosses here.” When SH was asked to find the function the graph was showing, she did so by constructing an ordered table of values. While this strategy enabled her to find the function, she could not answer any of the extension questions. When trying to think of a function that would produce a parallel slope, it was apparent that for her the graph was a collection of static points, not a representation of linear growth. Her strategy was to try out combinations of ordered pairs that would yield a series of points that were parallel to those given. She understandably gave up in frustration. When asked how graphs related to patterns, it was clear that SH saw a graph not as a way of representing a generalized rule of linear growth as MK did, but rather saw it as an organization of specific points similar to (but less convenient than) a table of values. “On a ttable it’s easier to count the numbers [going to the t-chart she created and pointing quickly across from input to output column with her pencil] like 0, 2 and 1 and 8. Here [touching the graph] you have to go like this [pointing to the last value, 10,on the x axis]. If it’s 10 you have to go all the way up [tracing up from the 10 on the x axis] and you have to go like this [tracing over towards the 62 on the y axis] and you might lose your place and you have to go like that and then it’s like “oh it’s 62” [reaching the value on the y axis]. That takes such a long time. And here [on the t-chart] you can just say 10 [writing in the input column] equals 62 [writing in the output column]. That’s a lot easier!” Discussion While this paper deals primarily with the reasoning of two students, our goal is to contribute to a growing literature that looks at the potential of multiple representations in function learning. For instance, in their study of children’s abilities to solve generalizing problems, Steele and
Algebraic Thinking
Vol.2-93
Johanning (2004) found that students who based their reasoning on the physical structure—the diagrams they drew—rather than only reasoning about numeric patterns were better able to interpret the relationship between quantities in the problem and represent their thinking with symbolic algebraic generalizations. Swafford and Langrall (2000) emphasize the importance of investigating the most effective use of tables and other representations in supporting generalizations. In this study, our findings suggest that it is crucial that students in Grades 4 and 5 be given opportunities to develop an understanding of functions in multiple representations. Children in our study who understood functions in multiple contexts went beyond pattern spotting to an understanding that the rules they found were generalizations of the specific cases given, as was evidenced in their explanations. Furthermore, their explanations also revealed an understanding of how the components of the function related to the functional relationships of the variables given in the problems. An implication of understanding functions through multiple representations concerns the distinction between students perceiving rules as mathematical objects rather than simply as actions (Kieran 1979). Students who were able to use the given context of a problem to find the rule were then able to describe the underlying structure of the given pattern. For these students, the rule e.g. “x6+2” became an object which could then be reflected upon in the multiple contexts in which the children worked, and could be used as a basis for generalizations. In contrast, students who used tables of values interpreted the rule as an action (multiply by six and add two) to be performed on specific numbers in input columns to generate numbers in output columns. In our future iterations of our research we will continue to explore multi representational approached to problem solving. References Kalchaman, M., & Fuson, K. (2001). Conceptual understanding of functions: A tale of two schemas. In (R. Speiser, C. Maher & C. Walter, Eds.), Proceedings of the Twenty-Third Annual Meeting of the North American Chapter of the International Group for the Psychology of Mathematics Education (Vol. 1, pp. 195-2006) Lee, L., (1996). An initiation into algebraic culture through generalization activities, in N. Bednarz, C. Kieran and L. Lee (eds.), Approaches to Algebra: Perspectives for Research and Teaching, Kluwer Academic Publishers, Dordrecht, pp. 65–86. Lesh, R. (2002). Research design in mathematics education: focusing on design experiments, in L.D. English (Ed.), Handbook of International Research in Mathematics Education: Directions for the 21 Century, Lawrence Erlbaum, Mahwah, NJ, pp.27-50. Moss, J., London McNab, S., Beatty, R. (2005). Elementary students develop an understanding of mathematical functions: Report on an early algebra study. Paper presented at the annual meeting of American Educational Research Association, Montreal, Quebec, April 2005. Moss, J., & Case, R. (1999). Developing Children’s Understanding of Rational Numbers: A New Model and Experimental Curriculum. Journal for Research in Mathematics Education, 30(2), 122–147, 119. Noss, R., Healy, L., & Hoyles, C. (1997). The Construction of Mathematical Meanings: Connecting the Visual with the Symbolic. Educational Studies in Mathematics, 33(2), pp. 203-233. Schliemann, A.D., Goodrow, A. & Lara-Roth, S. (2001). Functions and Graphs in Third Grade. Symposium Paper. NCTM 2001 Research Presession, Orlando, FL. Steele, D.F., & Johanning, D.I. (2004). A schematic-theoretic view of problem solving and development of algebraic thinking. Educational Studies in Mathematics, 57, 65-90.
Vol.2-94
PME-NA 2006 Proceedings
Warren, E. (2000). Visualisation and the development of early understanding in algebra. In M. v. d. Heuvel-Penhuizen (Ed.), Proceedings of the 24th conference of the international group for the psychology of mathematics education (Vol. 4, pp. 273-280). Hiroshima.