Dec 11, 2015 - ... by Vattenfall AB, Göran. Gustafsson Stiftelse, and the European Commission in the frameworks of the Ma-. tISSE and SOTERIA projects.
Multiscale modeling of atomic transport phenomena in ferritic steels
LUCA MESSINA
Doctoral Thesis in Physics Stockholm, Sweden 2015
TRITA-FYS 2015-80 ISSN 0280-316X ISRN KTH/FYS/--15/80--SE ISBN 978-91-7595-764-7
KTH Reaktorfysik AlbaNova Universitetscentrum Roslagstullsbacken 21 SE-106 91 Stockholm SWEDEN
Akademisk avhandling som med tillstånd av Kungl Tekniska högskolan framlägges till offentlig granskning för avläggande av teknologie doktorsexamen i fysik fredagen den 11 december 2015 klockan 13:00 i FD5, AlbaNova Universitetscentrum, Roslagstullsbacken 21. © Luca Messina, December 2015 Tryck: Universitetsservice US AB
iii Abstract Defect-driven transport of impurities plays a key role in the microstructure evolution of alloys, and has a great impact on the mechanical properties at the macroscopic scale. This phenomenon is greatly enhanced in irradiated materials because of the large amount of radiation-induced crystal defects (vacancies and interstitials). For instance, the formation of nanosized solute clusters in neutron-irradiated reactor pressure vessel (RPV) ferritic steels has been shown to hinder dislocation motion and induce hardening and embrittlement. In Swedish RPV steels, this mechanical-property degradation is enhanced by the high content of manganese and nickel impurities. It has been suggested that the formation of Mn-Ni-rich clusters (which contain also Cu, Si, and P) might be the outcome of a dynamic process, where crystal defects act both as nucleation sites and solute carriers. Solute transport by point defects is therefore a crucial mechanism to understand the origin and the dynamics of the clustering process. The first part of this work aims at modeling solute transport by point defects in dilute iron alloys, to identify the intrinsic diffusion mechanisms for a wide range of impurities. Transport and diffusion coefficients are obtained by combining accurate ab initio calculations of defect transition rates with an exact mean-field model. The results show that solute drag by single vacancies is a common phenomenon occurring at RPV temperature (≈ 300 °C) for all impurities found in the solute clusters, and that transport of phosphorus and manganese atoms is dominated by interstitial-type defects. These transport tendencies confirm that point defects can indeed carry impurities towards nucleated solute clusters. Moreover, the obtained flux-coupling tendencies can also explain the observed radiation-induced solute enrichment on grain boundaries and dislocations. In the second part of this work, the acquired knowledge about solutetransport mechanisms is transferred to kinetic Monte Carlo (KMC) models, with the aim of simulating the RPV microstructure evolution. Firstly, the needed parameters in terms of solute-defect cluster stability and mobility are calculated by means of dedicated KMC simulations. Secondly, an innovative approach to the prediction of transition rates in complex multicomponent alloys is introduced. This approach relies on a neural network based on ab initio-computed migration barriers. Finally, the evolution of the Swedish RPV steels is simulated in a "gray-alloy" fashion, where impurities are introduced indirectly as a modification of the defect-cluster mobilities. The latter simulations are compared to the experimental characterization of the Swedish RPV surveillance samples, and confirm the possibility that solute clusters might form on small interstitial clusters. In conclusion, this work identifies from a solid theoretical perspective the atomic-transport phenomena underlying the formation of embrittling nanofeatures in RPV steels. In addition, it prepares the ground for the development of predictive KMC tools that can simulate the microstructure evolution of a wide variety of irradiated alloys. This is of great interest not only for reactor pressure vessels, but also for many other materials in extreme environments.
iv Sammanfattning Transport av orenheter genom kristalldefekter (vakanser och interstitiella atomer) har en stor inverkan på mikrostrukturen och de mekaniska egenskaperna i bestrålade legeringar, där defekterna produceras i stora mängder. Bildandet av nanokluster som innehåller lösningsatomer i neutronbestrålade ferritiska kärnreaktorstanker har visat sig hindra dislokationsrörligheten och leda till härdning och försprödning. Denna förlust av mekanisk hållfasthet försämras i svenska tankstål även på grund av de höga mangan- och nickelkoncentrationerna. Uppkomsten av Mn-Ni-kluster, som innehåller koppar, kisel och fosfor, har föreslagits vara förorsakad av en dynamisk process, där kristalldefekter funkar både som kärnbildningsplats och bärare av lösningsatomer. Ursprunget av och dynamiken för klusterbildningen måste därför utredas genom att fokusera på förhållandet mellan kristalldefekter och transport av lösningsatomer. Syftet med den första delen i detta arbete är att modellera transport av lösningsatomer i låglegerat järn, för att identifiera de diffusionsmekanismerna för många olika typer av orenheter. Transport- och diffusionskoefficienter erhålls genom att kombinera ab initio-beräkningar av migrationsbarriärer med en exakt fältteoretisk modell. Resultaten visar att vakanser kan transportera lösningsatomerna vid relevanta temperaturer (≈ 300 °C), speciellt för de orenheterna som hittats i nanoklustren. Dessutom transporteras fosforoch manganatomer helst av interstitiella defekter. Dessa transportmekanismer bekfräftar defekternas förmåga att föra lösningsatomer mot existerande kluster. Detta kan också förklara den strålningsinducerade anrikningen av lösningsatomer vid korngränser och dislokationer som observerats experimentellt. I den andra delen av arbetet överförs dessa kunskaper om transportmekanismer till kinetiska Monte Carlo (KMC) modeller, för att simulera utvecklingen av reaktortankens mikrostruktur. För det första behöver man beräkna parametrar angående stabiliteten och rörligheten av defektklustren som innehåller lösningsatomer. Dessa parametrar erhålls med hjälp av dedikerade KMC simuleringar. Därefter introduceras en innovativ metod för att förutsäga okända migrationsbarriärer i komplexa multikomponentlegeringar, som utnyttjar ett neuralt nätverk baserat på ab initio-beräkningar. Slutligen simuleras utvecklingen av det svenska tankstålet genom att modifiera rörligheten av defektklusterna, med avsikten att indirekt imitera inverkan av lösningsatomerna. Dessa simuleringar jämförs med mikrostrukturkarakteriseringen av övervakningsproverna och bekräftar antagandet att kluster med lösningsatomer bildas på små kluster av interstitiella atomer. Som slutsats har detta arbete identifierat de atomära transportfenomen som driver bildandet av försprödande nanokluster i bestrålade kärnreaktorstanker, genom en pålitlig teoretisk modellering. Dessutom är detta första steget mot ett generellt KMC-prognosverktyg som kan simulera mikrostrukturen för många olika bestrålade legeringar. Detta är av stort intresse för kärnreaktorstanken liksom för många andra material under extrema villkor.
v Sommario
Simulazioni multiscala di fenomeni di trasporto atomico in acciai ferritici Le proprietà meccaniche degli acciai dipendono dalla composizione chimica del materiale. Le impurità (soluti) inizialmente presenti possono diffondere nel reticolo cristallino grazie all’interazione con difetti puntuali (vacanze e interstiziali), che sono prodotti in grandi quantità quando gli acciai sono sottoposti a irraggiamento neutronico. Questo può portare alla perdita di integrità strutturale del componente. Per esempio, nei reattori nucleari le proprietà meccaniche del vessel sono peggiorate dalla formazione di cluster di soluti su scala nanometrica, che ostacolano la deformazione plastica del materiale ostruendo il movimento delle dislocazioni, e provocano l’indurimento e l’infragilimento del vessel, mettendone in pericolo l’integrità strutturale. In particolare, l’effetto nei vessel svedesi è accentuato dall’elevato contenuto di manganese e nickel, che comporta la formazione di cluster contenenti principalmente questi elementi, ma con tracce aggiuntive di rame, silicio e fosforo. Questo fenomeno potrebbe essere il risultato di un processo dinamico, per cui gli interstiziali, rallentati dalla presenza di atomi di manganese, diventano centri di nucleazione per il cluster, attirando altri difetti che possono trasportare con essi altre impurità. Il trasporto di impurità rappresenta perciò la chiave per comprendere le origini e il processo di formazione di questi agglomerati. La prima parte di questo studio è dedicata al trasporto di soluti da parte di difetti puntuali in leghe ferritiche binarie, con l’intento di identificare i meccanismi di diffusione propri di una vasta gamma di impurità chimiche nel ferro. I coefficienti di diffusione e di trasporto sono ottenuti grazie all’utilizzo di accurati calcoli ab initio in un modello mean-field esatto. I risultati mostrano che alla temperatura del vessel (≈ 300 °C) le singole vacanze possono trasportare in maniera efficiente tutti i soluti che partecipano alla formazione dei cluster. Inoltre, il trasporto di atomi di fosforo e manganese avviene principalmente per mezzo di difetti interstiziali. Questi trend confermano la capacità dei difetti di trasportare impurità verso i centri di nucleazione. In aggiunta, grazie a questi risultati è possible spiegare l’accumulo di soluti presso bordi di grano e dislocazioni, fenomeno osservato sperimentalmente durante l’irraggiamento. Nella seconda parte, la conoscenza acquisita sui meccanismi di trasporto viene trasferita in un modello cinetico Monte Carlo, con l’obiettivo di simulare l’evoluzione microstrutturale degli acciai da vessel. In primo luogo vengono calcolati i parametri necessari per queste simulazioni, che comprendono la stabilità e la mobilità di cluster di vacanze e soluti. Successivamente, si propone un approccio innovativo per calcolare le frequenze di salto dei difetti in leghe ad elevata complessità chimica. Questo approccio prevede l’utilizzo di una rete neurale basata su precisi calcoli ab initio. Infine, l’evoluzione degli acciai svedesi viene simulata con una modalità gray-alloy, secondo cui l’effetto di impurità chimiche è introdotto indirettamente modificando la mobilità
vi dei cluster di difetti. Il confronto di queste ultime simulazioni con l’analisi sperimentale dei campioni estratti dai vessel svedesi permette di stabilire che i cluster di soluti si formano effettivamente a partire da agglomerati di interstiziali molto piccoli, invisibili al microscopio elettronico. In conclusione, questo lavoro permette di determinare da un punto di vista teorico i fenomeni di trasporto atomico alla base della formazione di cluster nanometrici di soluti che provocano l’infragilimento del vessel nei reattori nucleari. Inoltre, vengono poste le basi per sviluppare un modello Monte Carlo completo che possa simulare l’evoluzione microstrutturale di una vasta gamma di leghe irraggiate. Questo permetterà di prevedere il comportamento e migliorare la progettazione di svariati materiali sottoposti a condizioni operative estreme.
Acknowledgments During these years spent on modeling, I felt like I missed some experimental work. For this reason, I decided to arrange a homemade social experiment on... myself. My statement is that PhD acknowledgments are greatly biased by the euphoria (and the relief) of finishing up the work, since they are often written at last, just before sending the manuscript to the printing office. In this way, they are not really representative of the multiscale and multicolored feelings characterizing a five-year project. In order to prove this, I wrote the acknowledgments before the beginning of the thesis-writing process, some four months before the defense. I leave them to your free interpretation. “It was a rainy Christmas Eve of almost five years ago when a younger, lighthearted and somewhat reckless version of myself decided to become a PhD student, only semiconscious of the consequences it would have had upon my psyche and my life path. Now I reached the other end of this warm hole, and I can look back with some satisfaction and no regrets. ”Caution: this project may be hazardous to your health”: if my first contract had come in a box, this would have been surely the warning message on top. After all, it is surely not so healthy to keep working on the same topic for 1655 days, many of which spent working with nobody else than myself. Besides my unquestionable tendency to make everything overdramatic, I am grateful for the accomplishments achieved during this long journey, which has been exciting and inspiring at times, monotonous and frustrating in other moments. Many people helped me pulling through these years, but the risk of sounding inane and banal in these lines is rather high. Because of my incurable aversion to anything that is mainstream and conformist, I will not mention anybody here. Everybody who has been close and helpful has already been thanked in person.” Experiments and interpretations aside, it is really my pleasure to acknowledge the institutions that have hosted me and created such a stimulating working environment: the Reactor Physics department at KTH, the SRMP group at CEA Saclay, the material group of SCK-CEN, the R&D group of EDF, and the community of the recently renamed n-Fame workshop. The guidance of my supervisors Pär vii
viii
ACKNOWLEDGMENTS
Olsson, Nils Sandberg and Pål Efsing, as well as that of Maylise Nastar, Christophe Domain, Lorenzo Malerba and Nicolas Castin, have been fundamental and inspirational. A deserved acknowledgment goes also to the supercomputer facilities where my calculations where performed, not only for the corehours provided but also for the night shifts spent by keen technicians to fix the crashes caused by my sometimes erroneous scripts: the Swedish National Infrastructure for Computing (SNIC), the Swiss National Supercomputing Centre (CSCS), the Computational Simulation Centre of the International Fusion Energy Research Centre (IFERCCSC), as well as the computational power provided by EDF. Finally, since none of this would have been possible without the most fundamental source of energy, I acknowledge the decisive financial support provided by Vattenfall AB, Göran Gustafsson Stiftelse, and the European Commission in the frameworks of the MatISSE and SOTERIA projects.
List of publications Included publications I Luca Messina, Maylise Nastar, Thomas Garnier, Christophe Domain, and Pär Olsson, Exact ab initio transport coefficients in bcc Fe-X ( X=Cr, Cu, Mn, Ni, P, Si) dilute alloys, Physical Review B 90, 104203 (2014). II Luca Messina, Maylise Nastar, Nils Sandberg, and Pär Olsson, Systematic electronic-structure investigation of substitutional impurity diffusion and flux coupling in bcc iron, submitted to Physical Review B. III Luca Messina, Maylise Nastar, and Pär Olsson, Ab initio-based investigation of solute-dumbbell transport and radiation induced segregation in Fe-X ( X=Cr, Cu, Mn, Ni, P, Si) dilute alloys, submitted to Physical Review B. IV Luca Messina, Lorenzo Malerba, and Pär Olsson, Stability and mobility of small vacancy-solute complexes in Fe-MnNi and dilute Fe-X alloys: A kinetic Monte Carlo study, Nuclear Instruments and Methods in Physics Research B 352, 61-66 (2015). V Luca Messina, Nicolas Castin, Christophe Domain, and Pär Olsson, Introducing ab initio-based neural networks for transition-rate prediction in kinetic Monte Carlo simulations, submitted to The Journal of Chemical Physics.
Author’s contributions The author has performed the calculations and given interpretations and conclusions to the results for Papers I, II, III, and IV. In Paper V, the author has not performed the neural network training, but has conducted all the kinetic Monte Carlo simulations, and provided interpretations to the results. In addition, the author has developed a computational tool for the transport coefficient calculations in Paper III. ix
x
LIST OF PUBLICATIONS
Publications not included VI Luca Messina, Zhongwen Chang, and Pär Olsson, Ab initio modelling of vacancy-solute dragging in dilute irradiated iron-based alloys, Nuclear Instruments and Methods in Physics Research B 303, 28-32 (2013). VII Luca Messina, Pär Olsson, Maylise Nastar, and Waclaw Gudowski, Multiscale modeling of radiation-induced embrittlement in reactor pressure vessel steels, Proceedings of ICAPP 2015, May 3-6, 2015 (Nice, France), 15572. VIII Nils Sandberg, Zhongwen Chang, Luca Messina, Pär Olsson, and Pavel Korzhavyi, Modeling of the magnetic free energy of self-diffusion in bcc Fe, Physical Review B 92, 184102 (2015).
List of acronyms
AKMC ANN APT bcc BOL BWR CPG CRP DBTT DFT dpa EFPY fcc FISE KMC LAE LBP LDA MD MEP MFRT MNP NEB nn NPP OKMC PAS PAW PBE PD PDC PWR
Atomistic kinetic Monte Carlo Artificial neural network Atom-probe tomography Body-centered cubic Beginning of life Boiling-water reactor Chemical-potential gradient Copper-rich precipitate Ductile-to-brittle transition temperature Density-functional theory Displacements per atom Equivalent full-power year Face-centered cubic Final-to-initial-state energy Kinetic Monte Carlo Local atomic environment Late-blooming phases Local-density approximation Molecular dynamics Minimum-energy path Mean-field rate theory Manganese-nickel precipitate Nudged elastic band Nearest neighbor Nuclear power plant Object kinetic Monte Carlo Positron-annihilation spectroscopy Projector-augmented wave Perdew-Burke-Ernzerhof Point defect Partial diffusion coefficient Pressurized-water reactor xi
xii
LIST OF ACRONYMS RIS RPV SANS SCMF TEM US-NRC
Radiation-induced segregation Reactor pressure vessel Small-angle neutron scattering Self-consistent mean field Transmission-electron microscopy United States Nuclear Regulatory Commission
Contents
Acknowledgments
vii
List of publications
ix
List of acronyms
xi
Contents
xiii
List of Figures
xv
List of Tables
xvii
1 Introduction 1.1 Radiation damage in RPV steels . . . 1.2 Radiation damage in Ringhals reactors 1.3 Embrittlement at the atomic scale . . 1.4 Formation of "late-blooming phases" . 1.5 Solute transport . . . . . . . . . . . . 1.6 Thesis objectives . . . . . . . . . . . .
. . . . . .
. . . . . .
. . . . . .
. . . . . .
. . . . . .
. . . . . .
. . . . . .
. . . . . .
. . . . . .
. . . . . .
. . . . . .
. . . . . .
. . . . . .
. . . . . .
. . . . . .
. . . . . .
. . . . . .
1 2 3 7 9 10 11
2 Methodology 2.1 Qualitative description of flux coupling . 2.2 Diffusion coefficients . . . . . . . . . . . 2.3 Phenomenological transport coefficients 2.4 Radiation-induced segregation model . . 2.5 Self-consistent mean-field theory . . . . 2.6 Effect of external strain fields . . . . . . 2.7 Electronic-structure calculations . . . . 2.8 Kinetic Monte Carlo methods . . . . . .
. . . . . . . .
. . . . . . . .
. . . . . . . .
. . . . . . . .
. . . . . . . .
. . . . . . . .
. . . . . . . .
. . . . . . . .
. . . . . . . .
. . . . . . . .
. . . . . . . .
. . . . . . . .
. . . . . . . .
. . . . . . . .
. . . . . . . .
. . . . . . . .
13 13 18 20 22 24 31 34 39
3 Results I: Solute-transport mechanisms 49 3.1 Vacancy-assisted transport . . . . . . . . . . . . . . . . . . . . . . . . 49 3.2 Interstitial-assisted transport . . . . . . . . . . . . . . . . . . . . . . 54 xiii
xiv
CONTENTS 3.3 3.4
Radiation-induced segregation tendencies . . . . . . . . . . . . . . . Effect of strain on interstitial transport . . . . . . . . . . . . . . . .
4 Results II: Kinetic Monte Carlo simulations 4.1 Vacancy drag in AKMC simulations . . . . . . . 4.2 Stability and mobility of vacancy-solute clusters . 4.3 ANN-KMC simulations of thermal aging in FeCu 4.4 Microstructure evolution of Ringhals steels . . .
. . . . . . . . alloys . . . .
. . . .
. . . .
. . . .
. . . .
. . . .
. . . .
. . . .
56 58 63 63 65 67 70
5 Conclusions
75
Bibliography
79
List of Figures 1.1 1.2 1.3
Schematic view of PWR vessel, and position of surveillance capsules . . Measured DBTT shifts in Ringhals surveillance samples . . . . . . . . . APT characterization of Ringhals surveillance samples . . . . . . . . . .
4 6 7
2.1 2.2 2.3 2.4 2.5
Vacancy and dumbbell jump mechanisms . . . . . . . . . . . . . . . . . Multifrequency framework for vacancy-assisted solute diffusion . . . . . Examples of solute-defect flux-coupling mechanisms. . . . . . . . . . . . Qualitative description of RIS tendencies in different flux-coupling regimes Schematic representation of solute and defect concentration gradients near a sink . . . . . . . . . . . . . . . . . . . . . . . . . . . . . . . . . . Symmetric pair kinetic interactions in the SCMF method . . . . . . . . Summary of kinetic interactions in an extended SCMF model for interstitial diffusion . . . . . . . . . . . . . . . . . . . . . . . . . . . . . . . . Explanation of one-point kinetic equations for the SCMF interstitial method . . . . . . . . . . . . . . . . . . . . . . . . . . . . . . . . . . . . Elementary strain types . . . . . . . . . . . . . . . . . . . . . . . . . . . Representation of band forces in the NEB method . . . . . . . . . . . . Schematic description of migration-barrier models in KMC simulations . Structure of a one-layer artificial neural network . . . . . . . . . . . . . Extraction of cluster stability and mobility parameters from KMC simulations . . . . . . . . . . . . . . . . . . . . . . . . . . . . . . . . . . . .
14 16 17 18
2.6 2.7 2.8 2.9 2.10 2.11 2.12 2.13
3.1 3.2 3.3 3.4 3.5 3.6 3.7
Vacancy-drag tendencies for selected impurities in Fe . . . . . . . . . . . Convergence of Cr and Ni vacancy-drag tendencies with respect to the interaction range . . . . . . . . . . . . . . . . . . . . . . . . . . . . . . . Transition-metal impurity group trends of several flux-coupling and diffusion properties . . . . . . . . . . . . . . . . . . . . . . . . . . . . . . . Solute transport via dumbbell mechanism for selected impurities in Fe . Vacancy and interstitial RIS tendencies for selected impurities in Fe . . Strain effects on mixed-dumbbell stability and solute transport via dumbbell mechanism . . . . . . . . . . . . . . . . . . . . . . . . . . . . . Variation of interstitial-solute flux coupling in dislocation strain fields . xv
24 26 29 30 33 37 41 44 46 50 51 53 55 57 59 59
xvi 4.1 4.2 4.3 4.4 4.5 4.6 4.7 4.8
List of Figures Comparison of vacancy drag between SCMF and AKMC . . . . Stability and mobility of vacancy-solute pairs . . . . . . . . . . Stability and mobility of vacancy-solute clusters . . . . . . . . Vacancy-cluster properties as functions of solute concentration Properties of Cu clusters by ANN-based AKMC simulations . . ANN-based thermal-aging evolution of a Fe-1.34%Cu alloy . . . OKMC simulation of Ringhals RPV steels . . . . . . . . . . . . OKMC parametric study of Ringhals RPV steels . . . . . . . .
. . . . . . . .
. . . . . . . .
. . . . . . . .
. . . . . . . .
. . . . . . . .
64 65 66 68 70 71 72 74
List of Tables 1.1
Properties of last extracted surveillance capsules . . . . . . . . . . . . .
5
3.1
Summary of diffusion and flux-coupling properties for several impurities in Fe . . . . . . . . . . . . . . . . . . . . . . . . . . . . . . . . . . . . . .
60
Experimental characterization of Ringhals welds for OKMC simulations
73
4.1
xvii
"We are all born naked.. and the rest is drag" Rupaul Andre Charles
Chapter 1
Introduction Many of today’s challenges from an environmental, social, and economical perspective are related to climate changes and extreme disparities among countries in terms of health, wealth, and distribution of resources. Immediate counteracting actions are not only desirable but most likely necessary in order to preserve the environment and improve living standards worldwide. In this context, a wise planning in terms of energy supply and resource exploitation is required. In particular, the mix of energy sources for electricity production must be gradually readjusted, with a substantial phase-out from fossil fuels, in order to meet a drastic reduction of carbon-dioxide (CO2 ) emissions and guarantee the sustainability of the inevitable increase of energy demand in the emerging developing countries, as well as in those that will hopefully develop in the future. Alongside renewable energies, nuclear power is a candidate in the future energy mix, thanks to its high reliability, low production price and considerably lower CO2 emissions with respect to fossil fuels [1]. However, it has to face diversified public opinion, or severe opposition in some cases, as well as the issue of long-lived nuclear waste disposal. In this sense, it is important to promote the research on Generation-IV reactors1 and fusion reactors, which can potentially solve the issue of long-lived nuclear waste and improve the public acceptance of nuclear-powered electricity production [2, 3]. The path towards commercially-ready Generation-IV reactors is still long [3], and that towards fusion reactors even longer [2]. Moreover, given the polarization in the public opinion, the possibility of replacing old-generation power plants with new ones is in many countries object of strong political debate, independently of the actual economical and environmental advantages and disadvantages [4, 5]. While waiting for political decisions about this matter, it becomes therefore extremely important to monitor and sustain the health of currently-operating nuclear power plants (NPP), as their prolonged operation can provide stable and low-cost elec1 Generation IV refers to a group of innovative nuclear-reactor concepts that are currently under research and development and are aimed at improving safety and fuel utilization, as well as eliminating long-lived nuclear waste by fuel recycling. For more information, see the Gen-IV platform website (https://www.gen-4.org).
1
2
CHAPTER 1. INTRODUCTION
tricity supply. It is needless to say that this must not occur at the expense of safety. In regard to this debate, the situation in Sweden is not dissimilar to other countries. The currently-operating 10 reactors, 3 pressurized-water reactors (PWR) and 7 boiling-water reactors (BWR), are now passing 30 years of operation, and lifetime extensions are granted on a periodic bases after careful safety assessments [6]. However, the possibility of building new reactors has so far been the object of vacillating political decisions. Monitoring the safety conditions of current NPP’s is therefore a primary concern in order to secure the electricity supply. The integrity of the reactor structural components during operation is challenged by extreme conditions in terms of temperature, mechanical loads and neutron irradiation, and the conditions vary considerably depending on the position and the task the component is to fulfill. But whereas most of the internal components can be replaced as soon as they cannot guarantee a safe operation, the same cannot be stated for the most massive component of all, the reactor pressure vessel (RPV). The RPV plays a determinant role in preserving the reactor integrity. The even remote risk of RPV failure would lead not only to environmental hazards, but also to unaffordable replacement costs. Radiation-damage phenomena in RPV steels are therefore extremely important to investigate, in order to fully understand and predict the evolution of the RPV microstructure, and consequently of its macroscopic mechanical properties. Such issues are of interest not only for the current NPP generations, but also for the development of Generation-IV reactors. Different types of steels are in fact used in many other internal and structural components in present and future reactor concepts, including fusion reactors, and are all prone to radiation damage to different extents [7, 8]. Research about radiation damage is hence becoming nowadays more and more crucial for the development of new reactors and for the future of nuclear power itself.
1.1
Radiation damage in RPV steels
Radiation damage in NPP components is mainly caused by neutrons hitting the structures inside and around the reactor core. The interaction with the material crystal structure produces a large amount of crystal defects, triggering a chain of events that lead to a severe degradation of the mechanical properties [9]. In current NPP’s, austenitic stainless steels are normally employed for internal components [10], whereas ferritic steels2 are used for RPV’s [11]. The reason lies in their mechanical properties and the different response to radiation. Internals must withstand higher irradiation fluxes and damage doses3 at usually higher temperatures. Austenitic steels are then chosen because of their excellent high-temperature mechanical properties, creep strength and corrosion resistance [10]. Nevertheless, 2 Ferrite and austenite are two stable phases in the iron-carbon phase diagram. Ferrite is the stable phase at room temperature, whereas austenite is stabilized at room temperature by the addition of nickel. 3 The damage dose corresponds to the integral of the damage flux over time.
1.2. RADIATION DAMAGE IN RINGHALS REACTORS
3
they are subjected to severe void swelling [12]. On the other hand, RPV’s must withstand an apparently less harsh environment in terms of flux, dose, and temperature, but for much longer times. Ferritic steels are then the best choice thanks to their better resistance to thermal stresses [11]. However, in spite of the less severe environment, radiation-induced degradation still occurs. RPV steels usually operate at 290-300 °C and are subjected to a low but continuous neutron flux. The high-energy neutrons (> 1 MeV) create defects in the crystal structure, and since the RPV is not replaceable, the damage is accumulated throughout the reactor lifetime. The steel contains varying combinations of impurities that depend on the design and the manufacturing process. From the radiation-damage standpoint, the most critical area of the vessel is the beltline region around the core (see Fig. 1.1a), and the most severe effects are observed in welds, because they usually contain the highest amount of impurities [13]. The link between crystal defects and impurities is the key point to understand such effects. Since the construction of Generation-II reactors, surveillance programs have been established in order to monitor the change of mechanical properties with time and accumulated dose. Therefore, several capsules mimicking the composition of the base and weld metals are placed inside the vessel, and are progressively removed in order to test their mechanical properties. They are usually located next to the wall but at a closer distance to the core (Fig. 1.1b). In such a way, the capsules receive a higher neutron flux, and they anticipate the evolution of the actual RPV steel [13]. For instance, capsules removed after about 20 years of operation in Swedish PWRs have actually absorbed the equivalent dose of 60 years [15]. If the effect of different neutron-flux levels (the flux effect) is known, it is possible to infer the RPV end-of-life properties by analyzing the extracted capsules. Regardless of the specific composition, neutron irradiation has been observed to yield the same effect on any RPV steel: it decreases the fracture toughness of the material by increasing the yield strength (hardening) and the ductile-to-brittle transition temperature (DBTT) (embrittlement) [11]. This has been found for many types of RPV steels worldwide [15, 16, 17, 18]. The effect is more prominent in PWR’s with respect to BWR’s, because in the former the RPV wall is closer to the core and is hence subjected to a higher neutron flux. The DBTT shift represents the most severe issue: if the DBTT temperature rises excessively close to the operation temperature, the operation becomes unsafe, since the material might become brittle during shutdown, and the reactor must be decommissioned.
1.2
Radiation damage in Ringhals reactors
Ringhals is a nuclear site in the south-west of Sweden, hosting the three Swedish PWR units and one BWR. Unit R1 and R2 are older (1976 and 1975, respectively), whereas unit R3 and R4 were opened in 1981 and 1983 [19]. For the latter units, a surveillance program was enforced, and the capsules were progressively removed and analyzed. The last (and final) ones were removed in 2007, at a dose level
4
CHAPTER 1. INTRODUCTION
(a)
(b)
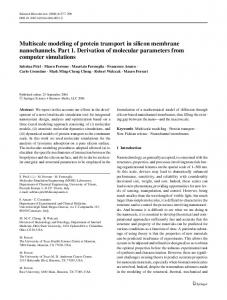
Figure 1.1: (a) Schematic view of a PWR vessel before welding [13]. The area in the circle marks the beltline region around the core, which is subjected to the highest neutron flux. (b) Reactor section showing the position of the surveillance capsules (U, V, W, X, Y, Z) in Ringhals PWR’s [14].4
corresponding to over 60 years of operation [14], and are now being tested and characterized. The composition and operation conditions of the last extracted weld-metal specimens are shown in Table 1.1. Fracture-toughness and Charpy tests have shown a yield-strength increase and a severe DBTT shift, far above the prediction of the US-NRC Regulatory Guide 1.99 [21] (Fig. 1.2). The DBTT shifts are the highest ever recorded in commercial power plants [20]. In addition, the mechanical degradation has seemingly not reached a saturation level, as opposed to the regulatory prediction. The higher shifts observed for unit R3 have not been yet explained, but have been associated to different heat treatments before the reactor start [14], or to the slightly higher copper content in R3 [20]. By means of accelerated irradiation experiments [22], no flux effect was 4 Fig. 1.1a reprinted, with permission, from ASTM STP 1547 Effects of Radiation on Nuclear Materials: 25th Volume, copyright ASTM International, 100 Barr Harbor Drive, West Conshohocken, PA 19428. Fig. 1.1b reprinted with explicit permission by the IAEA.
1.2. RADIATION DAMAGE IN RINGHALS REACTORS
5
Table 1.1: Initial and operation conditions, composition [14], and post-irradiation microstructure characterization [20] of the last surveillance capsules (U) extracted from Ringhals units R3 and R4 in 2007. Reactor (Specimen) R3 (E6) R4 (N11) Temperature 284 °C 284 °C Flux 1.47·1015 n/m2 s 1.49·1015 n/m2 s 23 2 Fluence 6.39·10 n/m 6.03·1023 n/m2 EFPY[a] 13.8 years 12.8 years DBTT at BOL[b] -75 °C -75 °C DBTT shift 192 °C 162 °C Average cluster radius 1.1 ± 0.29 nm 1.2 ± 0.39 nm Cluster number density 3.3·1023 m−3 4.3·1023 m−3 Chemical composition (at.%) Cu 0.07 0.04 Ni 1.50 1.58 Mn 1.48 1.37 Si 0.42 0.28 P 0.016 0.027 Cr 0.07 0.04 C 0.24 0.31 Mo 0.31 0.29 other 0.082 0.067 [a] [b]
Equivalent full-power years. Beginning of life.
found on the change of mechanical properties: this confirms that the properties of the extracted capsules are very likely to correspond to those of the actual RPV steels. The chemical composition of the alloy is similar to that of other RPV steels worldwide, with the exception of a simultaneous high concentration of manganese and nickel in the weld metal, along with a low copper concentration [15]. Manganese and nickel are therefore strongly suspected to play a major role. Only a careful investigation of the microstructure phenomena triggered by neutron irradiation can therefore shed a light on the causes of such a behavior. After the mechanical testing, the samples have been characterized by atomprobe tomography (APT) [23, 20, 24], small-angle neutron scattering (SANS) [23], and transmission-electron microscopy (TEM) [25, 26], in order to analyze the postirradiation microstructure. All the APT and SANS analyses consistently revealed the presence of a high density of solute-rich clusters, as for instance the ones shown in Fig. 1.3a, which can be directly linked to the change of mechanical properties. The measured mean cluster size depends on the analysis technique, but is always between 2 and 5 nm in diameter. The composition analysis shows that such nanofeatures are still iron-rich (60 at.%), and contain nickel (20 at.%), manganese (15 at.%), silicon (5 at.%), and traces of copper that are surprisingly large compared to the initial low copper content in the matrix. Rather than solute clusters, it is there-
6
CHAPTER 1. INTRODUCTION
Ringhals − Base metal Ringhals − Weld metal
DBTT shift [ºC]
Unit R3 200
200
150
150
100
100
50
Reg. Guide − Base metal Reg. Guide − Weld metal
Unit R4 0 0
2
4
6
8
Neutron fluence [1023 n/m2]
10 0
2
4
6
8
DBTT shift [ºC]
250
250
50
0 10
Neutron fluence [1023 n/m2]
Figure 1.2: Measured ductile-to-brittle transition temperature (DBTT) shifts [14] of the surveillance samples extracted from Ringhals units R3 and R4, as functions of accumulated dose, and comparison with predictions of the US-NRC Regulatory Guide 1.99 [21].
fore more correct to define such features as solute-rich complexes. Such complexes are observed both in the bulk metal and along dislocation lines [23]. Moreover, a heavy segregation of phosphorus [20] (Fig. 1.3b) as well as a less pronounced manganese segregation were observed [23]. On the other hand, TEM analysis showed the formation of some oxide particles [25, 26], some manganese-rich iron-based particles, and smaller molybdenum-rich particles on grain boundaries [25], although the smallest size was approximately 15 nm. No evidence for dislocation loops was found [26]. Post-irradiation annealing was performed on the same type of samples [27, 24] in order to test the mechanical property recovery. Thermal annealing (usually at 400500 °C) is often operated on RPV’s to restore the initial mechanical properties, as it allows for the dissolution of the embrittling nanofeatures formed during irradiation [15]. Other countermeasures, such as the placement of neutron-shielding pads, or the use of dummy fuel elements, are possible but have more invasive consequences on reactor operation [15]. The annealed Ringhals samples showed a marked property recovery at 500 °C. Only at this point, and not at lower temperature, it was possible to observe the partial dissolution of the Mn-Ni-Si-rich clusters, mainly by migration of manganese atoms [24]. This observation led to the conclusion that manganese migration might occur thanks to a correlation with point defects (whose diffusion is strongly enhanced at this annealing temperature with respect to the operation temperature); it was also speculated that this would be the underlying driving mechanism for the formation of these clusters in first place. Such results suggest that impurity–transport phenomena at the atomistic level might be the main actors in play.
1.3. EMBRITTLEMENT AT THE ATOMIC SCALE
(a)
7
(b)
Figure 1.3: Atom-probe tomography characterization of Ringhals surveillance samples[20]. (a) Examples of 1-nm thick atom-map slices through a solute-rich cluster in Ringhals unit R3. (b) Evidence of phosphorus segregation on dislocation lines in Ringhals unit R4.5
1.3
Embrittlement at the atomic scale
Dislocation motion is the link between the observed post-irradiation microstructure and the degradation of mechanical properties. The material ductility is related to the capability of dislocations to move across the crystal in presence of external loads. It is well known that solute clusters can act as hindrances for dislocation motion [28, 29, 30]. The yield-strength increase (hence the hardening) is due to the energy increment needed by the dislocation to pass the solute cluster. Moreover, in normal conditions the material is brittle below a threshold temperature (the DBTT), at which dislocation motion is severely impeded. Then, under irradiation a DBTT shift occurs because the presence of solute clusters is capable of obstructing dislocation motion at higher temperatures [31, 13]. Solute segregation on dislocations has a similar effect, as it makes the dislocation motion more difficult [32]. Another radiation-damage phenomenon (intergranular embrittlement) is related to the segregation of solute atoms on grain boundaries: solute accumulation leads to a decrease of the cohesive energy between grains, and favors intergranular fracture [13]. In order to understand such phenomena, it is necessary to analyze them from the atomic-scale perspective. The RPV ferritic steels are dilute iron alloys with a body-centered cubic (bcc) structure. They contain several impurities, among which the most important ones from the radiation-response standpoint are copper, nickel, manganese, silicon, and phosphorus (see for instance the composition of Ringhals steels in Table 1.1). During operation, high-energy neutrons sporadically hit the 5 Reprinted, with permission, from Journal of Nuclear Materials, vol. 37, M. K. Miller, K. A. Powers, R. K. Nanstad, and P. Efsing, Atom probe tomography characterizations of high nickel, low copper surveillance RPV welds irradiated to high fluences, pp. 107-115, © 2013 Elsevier B.V.
8
CHAPTER 1. INTRODUCTION
RPV and produce the primary damage: a lattice atom is displaced from its site and form a Frenkel pair (one vacant site and one interstitial atom). The displaced atom causes in turn a cascade of displacements by colliding with several neighboring atoms. After the process, many Frenkel pairs immediately recombine, but some of them survive. Depending on the incoming neutron energy, some small defect clusters (voids and loops) might also form. This is traditionally referred to as matrix damage [31]. In RPV’s, since the neutron flux is low, such cascades are not very frequent in a given local neighborhood of the crystal. For this reason, thermal diffusion of defects occurs undisturbed, leading to defect recombination, migration to sinks (grain boundaries or dislocations) or coalescence of the small clusters into bigger ones. Along their path, defects may also encounter impurity atoms. In certain conditions, the solutes can be transported by the defects towards preferential areas of the crystal, where solute-rich atmospheres or precipitates can form. In addition, it has been demonstrated that some solute atoms are also capable of slowing or even trapping specific defect types, as is the case for chromium or manganese on small interstitial loops [33, 34]. This can strongly affect the microstructure evolution, as it alters the rate of recombination or migration to sinks. Moreover, an immobilized defect cluster can act as a nucleation site for solute clusters, as it attracts other defects that are possibly coupled with solute atoms [35, 34]. This speculated complex kinetic mechanism might be at the origin of the experimental observations in the Ringhals RPV steels, as well as in many other RPV steels [36, 37, 38].
However, the observation of solute precipitation is definitely not a novelty of the recent years. Such phenomena have been known for a long time. As a matter of fact, RPV embrittlement was expected since the early phases of nuclear-power production. For instance, the regulatory prediction of Fig. 1.2 depends on the concentrations of copper and nickel impurities, because RPV embrittlement has been traditionally associated to the formation of copper-rich clusters, sometimes enhanced by the presence of nickel [13]. Copper precipitation is expected and dictated by the phase diagram, since such steels are manufactured in order to contain copper quantities far above the (very low) solubility limit. There exists hence a thermodynamic driving force for copper clusters to form, or in other words the formation of copper clusters decreases the free energy of the alloy. For a long time, only copper-rich clusters were visible, both in irradiated and non-irradiated conditions. Under irradiation, the precipitation process is faster because of the increased defect concentration. This phenomenon is therefore radiation enhanced, i.e. it is accelerated by irradiation but would also occur without it. At high damage doses, copper precipitation is expected to reach a saturation level, because the matrix is progressively depleted in copper and the bulk copper concentration approaches the solubility limit. This is the reason why the embrittlement prediction of Fig. 1.2 reaches a plateau.
1.4. FORMATION OF "LATE-BLOOMING PHASES"
1.4
9
Formation of "late-blooming phases"
In order to limit the expected DBTT shifts, the maximum allowed copper content in RPV steels was set to 0.1 at.% or lower in many countries [13]. However, when higher damage doses in operating RPV’s were reached, the surveillance programs showed a surprising deviation from prediction. Solute clusters were observed even in low-copper or copper-free alloys, and contained other impurities such as manganese, nickel, and silicon. This is the case, for instance, of the nanoclusters observed in Ringhals low-copper samples. With respect to copper precipitation, this phenomenon was much less understood, because the manganese and nickel concentrations were much below the solubility limit of the respective iron binary alloys. Hence there would be no apparent thermodynamic driving force for these clusters to form. The formation of these nanofeatures led to the necessity of redefining the predictive curves used to design RPV alloys and monitor the evolution of the existing ones. This required a deeper physical understanding of the whole precipitation process, and much effort has been devoted since then to this scope. These new type of features were initially named late blooming phases (LBP) [39], and this name has been in use for many years, even in the public announcement of this thesis project. These clusters were defined as "late blooming" because they were observed only above a certain dose threshold, and were "phases" because they appeared thermodynamically stable. Their effective thermodynamic stability was anyway not certain, because the phase diagram of this multicomponent alloy was (and still is) largely unknown. The LBP name has been strongly criticized in recent years and has been now almost abandoned. The most common definition nowadays is manganese-nickel precipitates (MNP). Many studies [40, 41, 42] have shown that "the so-called late blooming phases might as well be neither late, nor phases" [40]. Their formation is observed from the very beginning of irradiation, and their effective thermodynamic stability is uncertain, since such clusters are not observed in thermally-aged alloys. The "late-blooming" effect is late only in copper-rich alloys, since the growth rate of traditional copper-rich precipitates is much faster thanks to the strong driving force acting on copper. The overall effect on macroscopic properties is therefore initially overshadowed, and becomes visible only after copper precipitation has reached saturation. It has been shown that in copper-rich alloys two types of precipitates can be distinguished: copper-rich (CRP) and manganese-nickel precipitates [37, 40]. The former are characterized by a copper core and can be decorated by other impurities, whereas the latter are enriched in manganese and nickel, and decorated by other solutes (such as silicon and phosphorus). The different compositions suggest the formation mechanisms to be different. The thermodynamic stability of MNP’s has been object of several studies, aiming at calculating the phase diagram of the Fe-MnNiCu multicomponent alloy [40, 43, 38]. It was shown that some stable complexes might exist in the phase diagram [38], although the variety of compositions and structures of the observed
10
CHAPTER 1. INTRODUCTION
precipitates is unlikely to be a feature of an ordered phase. On the other hand, recent calculations suggest that the MNP’s might be stabilized in presence of point defects, and specifically self-interstitial clusters [41, 44]. Furthermore, the authors of [41] claim the existence of a small window in the phase diagram which would allow for solute precipitation, but the driving force is so weak that it would never occur without the aid of irradiation. In case this phases are not thermodynamically stable (at least not without the presence of defects), they would be radiation induced, rather than radiation enhanced, since defect-induced solute transport would be required.
1.5
Solute transport
The MNP’s might form as well as the result of a purely kinetic process, exclusively involving the coupling between defect motion and solute atoms. One of the suggested formation mechanisms is the following [37, 40, 45]. Some impurities such as manganese might reduce the mobility of interstitial loops. The loop gathers progressively more and more manganese atoms, until it is completely immobilized. At this point, the sessile loop, decorated with some manganese atoms, will attract other single vacancies or interstitials. In case defects are capable of dragging solute atoms with them, they would come to the immobilized loop carrying solute atoms with them. In this way the former loop act as a nucleation site and gets decorated with more and more solutes: a solute cluster is born. The solute clusters that are observed in many APT works would therefore contain an interstitial loop in their core. From an experimental point of view, this theory has not been confirmed yet because of the small size of such loops with respect to the current TEM resolution [HernandezMayoral:2010tm]. At any rate, recent experimental observations have actually observed the formation of ring-shaped solute-rich complexes, which would strongly support this hypothesis [46]. Moreover, the analysis of irradiated Fe-Mn binary alloys has shown that manganese increases the density of interstitial clusters, and this increase can be directly linked to the observed irradiation-induced hardening [35]. Modeling can provide an important contribution to the investigation and the possible confirmation of this atomic-scale mechanism that cannot be experimentally observed. However, the modeling of such phenomena requires the detailed knowledge of the solute-transport mechanisms, which are unknown or explained only from a qualitative standpoint. For instance, it has been argued from positronannihilation spectroscopy (PAS) analysis that the formation of solute-vacancy clusters [47, 48] in irradiated iron alloys would prove the capability of vacancies to drag these impurities. In addition, the heterogenous precipitation of manganese-rich clusters next to defect sinks has been linked to the possibility of manganese drag by point defects [42], although no work has been so far able to determine precisely the mechanisms driving the diffusion of manganese solutes. As a further example of unknown solute-transport phenomena, the evolution of an Fe(C)-MnNi model alloy
1.6. THESIS OBJECTIVES
11
was well reproduced by a kinetic Monte Carlo (KMC) study, only assuming the substantial immobilization of small vacancy clusters due to the presence of solute atoms [49], but such effect was postulated without evidence. Given the lack of knowledge about solute-transport mechanisms in this type of alloys, which has been evidenced in previous works [42, 43], solute-transport phenomena have been chosen as the main subject of this thesis. In summary, two theories have been advanced to explain the formation of MNP’s: the radiationenhanced theory (existence of a thermodynamic driving force for precipitation, accelerated by radiation), and the radiation-induced theory (clusters are a consequence of kinetic coupling between solutes and defects). The latest investigations suggest something in between: there might be both a weak thermodynamic driving force and a strong kinetic coupling [43]. In either case, the solute-transport mechanisms need to be carefully investigated, in order to possibly confirm (or disprove) the suggested formation mechanisms and explain the observed segregation of solute atoms on dislocations and grain boundaries.
1.6
Thesis objectives
This thesis aims therefore at providing the missing link between the experimental observation and the atomic diffusion processes, by analyzing the details of impurity transport in ferritic alloys. The primary objective is to contribute to the understanding of clustering and segregation phenomena in current RPV steels, in the general effort of explaining the reasons for the observed accelerated degradation of mechanical properties, and of providing an ultimate tool that could model such phenomena on a multi-scale basis, from the atomistic level to the macroscopic properties [50, 51]. The study here presented is applicable to a much wider range of materials and applications, which involve not only ferritic steels that might be used in Generation-IV reactors [52] and fusion reactors [7, 8], but also metallurgical processes, where the knowledge of solute-transport mechanisms is crucial for driving the process to the desired microstructure [53, 54]. The thesis objectives are therefore summarized as follows. 1. Cover the gap in the knowledge of solute-defect kinetic coupling in RPV alloys, by investigating the properties of point defects as solute carriers, in order to demonstrate their capability of causing solute clustering and segregation, regardless of the possible existence of thermodynamic driving forces. This is achieved through the calculation of transport coefficients of dilute binary alloys, which reveal the intrinsic solute-defect flux-coupling tendencies and determine the diffusion mechanisms and correlations that are likely to guide the precipitation and segregation processes. 2. Apply the acquired solute-transport knowledge to the development of predictive KMC modeling tools of RPV microstructure evolution. This is achieved by investigating different approaches to the parameterization of such tools,
12
CHAPTER 1. INTRODUCTION and by providing a database of solute-defect cluster properties that can be readily implemented in KMC simulations. In addition, such tools are applied to the specific case of the Ringhals RPV steel in order to support the surveillance campaign and aid the interpretation of the microstructure characterization. The development of reliable predictive tools, reproducing the correct solute-transport mechanisms, can greatly contribute to the understanding of the long-term RPV evolution beyond the current lifetime span.
The manuscript is organized as follows. Chapter 2 is dedicated to a qualitative description of the atomistic diffusion mechanisms and to a review of the modeling methods that have been employed in the papers attached at the end of the manuscript (from I to V). The results of the thesis are included in Chapters 3 and 4. The former presents the investigation of solute-transport mechanisms by vacancies (Papers I and II) and interstitials (Paper III). In the latter are presented the KMC calculations of solute-vacancy cluster properties (Paper IV), the application of an innovative KMC model based on the use of neural networks (Paper V), and the simulated microstructure evolution of Ringhals RPV steels. Finally, the achievements of this work are summarized in the last chapter, which also provides several suggestions for future work.
Chapter 2
Methodology 2.1
Qualitative description of flux coupling
The crystal lattice of a ferritic alloy is a body-centered cubic structure. Transport of substitutional impurities occurs mainly through point defects (PD), namely vacancies or self-interstitial atoms. Non-substitutional impurities, such as carbon or oxygen, can diffuse independently on an interstitial sublattice [55]. At any rate, all impurities included in this study1 are substitutional, i.e. they replace one iron atom in the bcc lattice, and can diffuse only through exchange with vacancies or self-interstitials. In thermal-equilibrium conditions, the PD concentration depends on the formation free energy [58]: � � Gf eq cx = exp − (2.1) kB T with Gfx = Hxf − T Sxf (x =V, I). Hxf and Sxf are respectively the formation enthalpy and entropy, kB is the Boltzmann constant and T the absolute temperature. Since the formation energy of self-interstitials is much larger than that of vacancies [59], self-interstitials do not form in thermal conditions. Nevertheless, under neutron irradiation there is a constant and equal production of both PD types, much above the thermal-equilibrium concentrations. Atomic diffusion is then considerably enhanced by the supersaturation of mobile PD’s, and the interstitial contribution to diffusion must be included in the picture. The PD diffusion mechanisms are depicted in Fig. 2.1. The vacancy moves by exchange with one of the eight nearest neighbors (nn). Concerning self-interstitials, the most stable configuration in bcc iron is represented by the h110i dumbbell (Fig. 2.1b) [59]. The dumbbell migration mechanism is more complex than vacancies: either one of the two dumbbell atoms can migrate to a neighboring target site (two 1 Phosphorus can be in solution in iron both as a substitutional and a foreign-interstitial impurity [56, 57].
13
14
CHAPTER 2. METHODOLOGY
per atom, marked with ’X’ in Fig. 2.1), and the final configuration can have the same orientation (translation mechanism) or be rotated by 60° (rotation-translation mechanism) [60]. For each rotation-translation there are two possible final configurations, e.g. a h110i dumbbell can rotate during the transition to a h011i or a h101i orientation. Therefore, a given dumbbell can perform a total of 12 distinct jumps. In addition, four 90° onsite rotations can also take place. (a)
X X
X X
X
X X
(b)
X X
X X
X
rotation−translation
translation
onsite rotation
Figure 2.1: Possible transitions of (a) a vacancy and (b) a h110i-dumbbell in bcc iron. The allowed target sites are marked with ’X’. Each of these transitions is normally modeled in the framework of transitionstate theory as a thermally-activated jump with rate [58]: � � � � −Gm Sm −H m ω = ν exp + = ν exp . (2.2) kB T kB T kB H m is the migration enthalpy (commonly referred to as migration energy or barrier), S m the migration entropy, and ν the attempt frequency. S m is often neglected as it is usually small compared to the enthalpy contribution [61]. The migration free energy is provided by random thermodynamic fluctuations of the lattice, whose frequency (related to ν) is driven by phonon vibrations. In kinetic studies, the correct description of migration rates is crucial, and represents therefore the focus of this work. In a pure crystal, a defect has an equal probability to move to any of the target sites. However, this is no longer valid when substitutional impurities are present. Firstly, the exchange frequency between a vacancy and a neighboring impurity differs from that of the host atom. In addition, the interaction between impurities and PD’s alters the jump frequencies of the iron atoms next to the vacancy. The same applies for self-interstitial defects next to a solute atom. It is this perturbation of the network of jump frequencies around the solute atom that determines diffusion
2.1. QUALITATIVE DESCRIPTION OF FLUX COUPLING
15
mechanisms, rates, and flux coupling. The extent of the solute-defect interactions and the number of chemical species determine the amount of jump frequencies that are perturbed and must therefore be considered separately. For instance, the most traditional multifrequency model [62] for vacancy diffusion in dilute2 bcc alloys considers interactions up to the 2nn distance, and entails the distinction of nine types of transitions. The latter are the solute jump frequency and all vacancy jumps starting from or ending into a configuration where the solute-vacancy distance is shorter or equal to the 2nn one. In this work, original multifrequency frameworks for both vacancy and dumbbell-mediated diffusion have been developed, extending those of previous studies [63, 64], and are presented in details in Papers I and III. Fig. 2.2 shows the extended multifrequency model for vacancy migration. The solute-vacancy interaction range extends to the 5nn, as some impurities have a nonnegligible interaction at such distance. This yields a network of 26 distinct frequency types that are perturbed by the solute, with the perturbation progressively fading out with distance. The defect jump frequency depends therefore on the chemical composition of the local atomic environment (LAE), i.e. the ensemble of atoms included in the interaction area. In a non-dilute alloy, the number of possible LAE configurations grows quickly with the interaction range and the number of chemical species. Hence, even in a concentrated binary alloy, the number of configurations is too large for each jump frequency to be calculated separately. This issue is discussed in Section 2.8. At any rate, the study of impurity-transport mechanisms in dilute binary alloys represents the necessary starting point of solute–transport modeling, as it allows for the investigation of the intrinsic kinetic interactions between each solute species and each PD type. The combination of defect jump rates around the solute atom determines the way the solute atom diffuses in the crystal. Normally, vacancy-assisted diffusion occurs through the inverse Kirkendall mechanism [58]: the atomic flux is opposed to the vacancy flux, because the vacancy moves by exchanging with either solute or host atoms. In this situation, the solvent and solute diffusion rates are different, as they depend on the jump frequencies and the solute-vacancy interactions. However, in given conditions the solute flux can reverse into the direction of the vacancy flux. This phenomenon is known as vacancy drag [65]. It occurs when the dissociation probability of a solute-vacancy pair is low, and the combination of jump frequencies in the vacancy LAE allows for the vacancy to "turn around" the solute and produce consecutive solute jumps in the same direction, as depicted in Fig. 2.3a. Dumbbells can induce solute transport in a different way. In this case, the solute can move only in a mixed-dumbbell configuration, as depicted in Fig. 2.3b. The possibility of solute transport then depends on the mixed-dumbbell stability and mobility: the latter can diffuse through a sequence of rotation-translation jumps, 2 In the dilute-alloy limit, the interaction of only one solute atom and one point defect is considered, as the probability of having two or more solutes or defects in the same local neighborhood is negligible.
16
CHAPTER 2. METHODOLOGY
ω0
7
10
ω 37
ω 5,10
9
5
3
ω 57
3
ω 13
ω 49 ω 15
ω 45
7
ω 34
4
1
ω 48 ω2
S
ω 24
ω 12
2
ω 46
8 6
Figure 2.2: Multifrequency framework for vacancy-assisted solute diffusion. Far away from any solute atom, vacancy migration occurs with rate ω0 . The blue circle represents the solute atom, which can exchange with the vacancy at rate ω2 . The other frequencies are denoted with ωij , where i and j mark respectively the initial and final nearest-neighbor distance between solute and vacancy. The green circles represent the possible vacancy positions inside the interaction area, whereas the red circles are sites outside the interaction area but reachable within one jump from the green sites.
causing a long-ranged solute transport even without dissociating. The diffusion rate via such mechanism depends, once again, on the combination of jump frequencies in the LAE, and the balance between association and dissociation probabilities of the mixed dumbbell. Conversely, if the formation probability of the mixed-dumbbell is too low, solute transport cannot occur. In this case, the pure dumbbell (Fe-Fe) tends to "avoid" solute atoms, which are therefore immobile. It is worth emphasizing the difference between thermodynamics (stability) and kinetics (mobility). The stability of the mixed dumbbell depends on the thermodynamic interaction of the solute with the defect in this configuration, i.e. the probability for the lattice to adopt this particular configuration. Conversely, the combination of jump rates in the multifrequency network determines the rates of transition between equilibrium configurations. A low association frequency for the formation of the mixed dumbbell from a 1nn configuration causes the dumbbell to "avoid" this configuration.
2.1. QUALITATIVE DESCRIPTION OF FLUX COUPLING
17
The type of solute-defect flux coupling drives the evolution of the alloy. PD’s usually flow towards sinks (e.g. dislocation lines, grain boundaries, free surfaces, and so on) [66]. Hence, the mechanisms described above can cause solute atoms to segregate on such sinks, and to change the alloy composition around them. This is exemplified in Fig. 2.4, for what concerns radiation-induced segregation (RIS). Vacancy drag leads to solute enrichment, because vacancies carry solute atoms along. In the opposite case, the diffusion rates of the two species determine the enrichment or depletion tendency: namely, depletion occurs if the solute diffusivity is larger. For what concerns interstitial transport, a flux of mixed dumbbells yields enrichment, whereas a lack of solute-dumbbell transport causes the solute to deplete because of the supplementary influx of iron atoms. The global RIS tendency is obtained by combining the vacancy and interstitial tendencies. A similar reasoning can explain heterogeneous solute-cluster growth. A solute-defect complex acts as a defect sink, and can therefore attract defects to the cluster. In case of vacancy drag or dumbbell transport, the solute atoms carried by the defects are deposited on the cluster, allowing for it to grow. Such coupling regimes depend mainly on temperature, chemical composition, and possible strain fields in the lattice.
a) 5 4 3
9 6
...
7 8
2 1
b) 2 1
Figure 2.3: a) Example of correlated vacancy path producing solute drag. b) Example of mixed-dumbbell migration sequence that allows for solute transport without dumbbell dissociation.
18
CHAPTER 2. METHODOLOGY
Jsol
solute transport
solute drag
c)
a)
JI
VACANCY SINK
JFe
INTERSTITIAL SINK Jsol
enrichment
enrichment
JV
inverse Kirkendall
b)
JFe
JV
Jsol
no solute transport
d)
?
VACANCY SINK
Jsol
INTERSTITIAL SINK
depletion
enrichment if solute diffusion is slower
JI JFe
Figure 2.4: Qualitative description of RIS tendencies in different flux-coupling regimes. a) Solute drag by vacancies leads to solute enrichment at sinks. b) In the absence of vacancy drag, the species (iron or solute) with the lower diffusivity is enriched next to the sink. c) Solute transport via the mixed-dumbbell mechanism leads to solute enrichment. d) No solute transport occurs because the mixed dumbbell is not stable, which leads to solute depletion because of the additional influx of iron atoms.
2.2
Diffusion coefficients
Diffusion coefficients relate the flux of a given species to the concentration gradients, according to Fick’s law [58]: Jα = −Dα ∇cα .
(2.3)
In a dilute alloy AB, the impurity diffusion coefficient can be measured by assuming that the reference frame of the solvent atoms is fixed, and is then referred to as ∗ tracer diffusion coefficient (DB ). By the same approach, the tracer self-diffusion ∗ coefficient (DA ) in a pure material can be obtained by measuring the diffusion of a self tracer, i.e. a radioactive isotope of the same chemical species. In more concentrated alloys, the assumption of a fixed reference frame is not valid, and the
2.2. DIFFUSION COEFFICIENTS
19
Kirkendall effect (i.e. the relative motion of the diffusion zone with respect to the non-diffusion zone in the same material) cannot be neglected. In this case, the intrinsic diffusion coefficients DA and DB can be obtained from the measurement of the chemical interdiffusion coefficient and the Kirkendall velocity [58]. The self-diffusion coefficient for vacancy-mediated diffusion can be computed as [62]: ∗ DA
=
a20 f0 ω0 ceq V
=
a20 f0 ν0
� � � f � f m HV + HV SV exp − exp , kB T kB
(2.4)
where a0 is the lattice constant (2.87 Å for Fe [67]), ceq V the equilibrium vacancy concentration (as in Eq. 2.1), ω0 and ν0 the vacancy jump frequency and attempt frequency in pure iron, and f0 a geometric correlation factor, equal to 0.727 in bcc crystals [62]. In experiments, the diffusion coefficient is usually provided through f f the prefactor D0 = a20 f0 ν0 exp(SV /kB T ) and the activation energy Q = HV + m HV . In ferromagnetic materials such as iron, the activation energy decreases with increasing temperature because of the progressive loss of ferromagnetic character. This must be taken into account when comparing computed diffusion coefficients which experimental measurements, which are conducted at high temperatures. A model [68] accurately describing the change of Q with temperature due to the magnetic transition is described in Papers I and II. The solute tracer diffusion coefficient is expressed by a similar formula [62]: ∗ DB
=
a20 fB ω2 ceq V p1nn
=
a20 fB νB
� exp
f SV kB
�
b,1nn m H f + HB + HBV exp − V kB T
! , (2.5)
where ω2 and νB are the solute jump frequency and attempt frequency, fB the solute correlation factor, and p1nn the probability of having a solute-vacancy pair at 1nn b,1nn distance, which depends on the 1nn binding energy HBV (here, the binding energy is negative when attractive). The minor entropic contributions to the migration and binding free energies are here neglected. The solute diffusion coefficient is thus determined by three factors: the solute migration barrier, the 1nn binding energy, and the correlation factor. The influence of each factor is discussed in Paper II. The correlation factor is a key-concept in this work. It represents the effect of consecutive non-random solute (or solvent) jumps that do not produce a net solute displacement, as is for instance the case when the solute exchanges with a vacancy several consecutive times. It can be derived from Einstein’s definition of the diffusion coefficient [69]: �
P ( i ~ri )2 , DB = 6τ
(2.6)
where r~i are a series of displacements of B during time τ . The square of the sum
20
CHAPTER 2. METHODOLOGY
can be developed as: �� X � � X n−1 n−i XX 2
2� ~ri = ~ri + 2 h~ri · ~ri+j i .
(2.7)
i=1 j=1
The first term on the right-hand side is the uncorrelated part of the diffusion coefficient. The correlation factor is then given by: �X n−1 n−i XX
2� fB = 1 + 2 h~ri · ~ri+j i ~ri . (2.8) i=1 j=1
If the jumps in the sequence are completely uncorrelated, the sum of the cross products is null and the correlation factor is unitary. This is not the case for self diffusion, as after a jump of atom A a vacancy is immediately available to perform a backward jump (hence the factor f0 ). For solute diffusion, a strong correlation between the vacancy and the solute causes consecutive solute jumps to be highly correlated. This effectively slows down the diffusion of the solute, as well as that of the vacancy. The same applies to solute diffusion via the dumbbell mechanism, although the correlation factors are different because of the different jump mechanisms. The factor can be calculated as a function of the atomic jump frequencies, by using one of the multifrequency models such as the one depicted in Fig. 2.2. Analytical equations have been developed for bcc and face-centered cubic (fcc) structures and different interaction ranges [62]. In Paper II, a new, more complete expression is provided, based on the self-consistent mean-field approach presented in Section 2.5.
2.3
Phenomenological transport coefficients
The correlation factor includes the effects of solute-vacancy interactions and flux coupling on solute diffusion. However, such effects are seen only as a solute slowdown and do not allow for the determination of the flux direction. Hence, Eqs. 2.4 and 2.5 are very useful in a vast range of applications and models, but they are not well suited for the description of flux-coupling phenomena. Atomic fluxes arise in non-equilibrium conditions to counteract thermodynamic forces. These tendencies are in general controlled by the phenomenological coefficients (transport coefficients) of the Onsager matrix [66]. The thermodynamic forces are represented by the gradients of chemical potential of each species α: ∇µα /kB T . They represent the deviation of the system from equilibrium, which tends to be compensated by the atomic fluxes, assumed to be proportional to such forces: X ∇µβ . (2.9) Jα = − Lαβ kB T β
2.3. PHENOMENOLOGICAL TRANSPORT COEFFICIENTS
21
The proportionality factors are the phenomenological coefficients Lαβ . They represent the kinetic response of a system subjected to thermodynamic forces, hence allowing for a clear separation between kinetic behavior and thermodynamic driving forces. In a binary alloy, the Onsager matrix has three independent coefficients: LAA , LAB , and LBB , as the matrix is symmetric for any crystal structures [70]. The off-diagonal coefficient describes the flux of one chemical species induced by forces acting on the other species, allowing therefore for the determination of the flux-coupling tendency. The coefficients depend on the temperature, on the nominal alloy composition, and on external stresses. They can also be distinguished depending on the diffusion mechanism. TheP total vacancy flux is given by the opposite sum of the fluxes of all V species: J = − V α Jα , whereas the interstitial flux is the sum with the same sign: P I JI = α Jα . Moreover, the vacancy and interstitial contributions are assumed to be additive. The flux of a given species α can therefore be written as [66]: Jα = JαV + JαI = −
X β
LV αβ
∇µβ − ∇µV X I ∇µβ + ∇µI − Lαβ . kB T kB T
(2.10)
β
The driving forces can be obtained from concentration gradients and thermodynamic properties. For instance, the chemical potential gradient of a species α in a binary alloy can be written as [66]: ∇µα ∇cα =Φ , kB T cα
(2.11)
where the thermodynamic factor Φ is proportional to the second derivative of the Gibbs free energy, and can therefore be easily calculated from thermodynamic databases. On the other hand, the Onsager matrix has to be obtained by theoretical models, because the three independent coefficients cannot be all inferred from diffusion experiments [66]. Moreover, since interstitials are missing in thermal conditions, interstitial-related diffusion coefficients are not usually available. In addition, experimental diffusion coefficients are available only at high temperatures, and extrapolation to low temperatures can be very inaccurate (as is explained in Papers I and II). For such reasons, one must rely on theoretical models to compute the Onsager coefficients. In this project, these coefficients are calculated by means of self-consistent mean-field (SCMF) theory, based on atomic jump frequencies ω that are obtained by ab initio calculations. Then, they are employed to investigate the following properties. ∗ a) The tracer solute diffusion coefficients DB = LBB /ncB , where n is the atomic density.
b) The vacancy-drag tendency, which can be inferred from the ratio LBV /LBB (also called the wind factor), where LBV = −(LAB + LBB ). This factor is positive when vacancy drag occurs, and negative otherwise.
22
CHAPTER 2. METHODOLOGY c) The correlation factor fB = LBB /L0BB , where L0BB is the uncorrelated part of the LBB coefficient (Eq. 2.18). d) The combined vacancy-interstitial RIS steady-state tendencies, according to the model described in the next section.
Alternatively, the transport coefficients can be calculated by means of KMC simulations (see Section 2.8), as they can be defined in a way similar to diffusion coefficients [71]: Lαβ =
~ α · ∆R ~ βi h∆R , 6Ωτ
(2.12)
~ α = P ~ri α and ∆R ~ β = P ~ri β are the total displacements of all atoms where ∆R i i of species α and β in time τ , within a given volume Ω. The transport coefficients yielded by the KMC and SCMF methods have been shown in previous works [63, 60, 64], as well as in Paper I, to match perfectly, which proves the reliability of both methods.
2.4
Radiation-induced segregation model
RIS refers to the coupling of irradiation-induced defects with the alloy chemical species, leading to localized composition changes near sinks [66]. The RIS tendency deriving from PD-driven diffusion can be inferred from the transport coefficients with the following model. The atomic fluxes can be written by means of Eq. 2.10 and the equations for JV and JI : JA J B JV JI
� � I I = −γ LV ∇(µA − µV ) + LV AB ∇(µB − µV ) + LAA ∇(µA + µI ) + LAB ∇(µB + µI ) � � AA I V I = −γ LV BA ∇(µA − µV ) + LBB ∇(µB − µV ) + LBA ∇(µA + µI ) + LBB ∇(µB + µI ) � , � V V V = +γ LAA ∇(µA − µV ) + LV AB ∇(µB − µV ) + LBA ∇(µA − µV ) + LBB ∇(µB − µV ) � � I = −γ LAA ∇(µA + µI ) + LIAB ∇(µB + µI ) + LIBA ∇(µA + µI ) + LIBB ∇(µB + µI )
(2.13) where γ = 1/kB T . The chemical potential gradients can be obtained from Eq. 2.11, whereas the additional driving forces acting on PD’s under irradiation can be written as [66]: ∇cx ∂ ln ceq ∇µx x ∇cB = − , kB T cx ∂ ln cB cB
(2.14)
(x = V, I). Expressions for the equilibrium defect concentration as a function of the solute concentration can be obtained, for instance, by means of a low-temperature expansion of the equilibrium distribution function [72]. The system of equations can be solved in steady-state conditions by setting the atomic fluxes to zero (JA = JB = 0) and the equality of the PD fluxes (JI = JV ).
2.4. RADIATION-INDUCED SEGREGATION MODEL
23
This is justified because an equal amount of vacancies and interstitials is created in the bulk under irradiation, and at steady-state an equal amount is absorbed at sinks (neglecting any absorption bias) [73]. Under such assumptions, the solution of the system is given by [66]: � � ∇cB cA cB dAV dAI dBV dBI = − . (2.15) ∇cV cA dAI DB + cB dBI DA dAV dAI The sign of the gradient ratio determines the solute enrichment tendency, as depicted in Fig. 2.5, because the vacancy concentration gradient near a sink is always negative. The same equation is obtained when solving for ∇cB /∇cI . DA and DB are the interdiffusion coefficients, whose expressions in terms of transport coefficients can be found in [66]. The sign of the expression is determined by the ratio of partial diffusion coefficients (PDC) in parenthesis. They are defined as: dAV =
V LV AA + LAB cA cV
,
dBV =
dAI =
LIAA + LIAB cA cI
,
dBI =
V LV AB + LBB ; cB cV
LIAB + LIBB . cB cI
(2.16)
(2.17)
The RIS tendencies can be therefore discussed based exclusively on the PDC ratios, which are directly derived from the transport coefficients. The amplitude of the enrichment or depletion tendency has a more involved dependence on the irradiation conditions. But for the dilute limit, a simplified expression can be obtained. The elements of the Onsager matrix are proportional to the defect and the solute concentrations, with the exception of LAA that has a solute-independent term. Therefore, it is convenient to write the coefficients as: � � x,0 x,1 x LAA = cx lAA + cB lAA x . (2.18) LxAB = cx cB l�AB � x,0 x,1 Lx x =c c l +l =c c l BB
x B
BB
BB
x B BB
The quantities marked with ’0’ represent the uncorrelated terms of the matrix, hence corresponding to the values of the diagonal coefficients in absence of correlations. By applying the dilute limit (first order in cB ), the RIS equation 2.15 becomes: lV,0 ∇cB = V AAcI I ∇cV lBB + cV lBB
�
dBV dBI − 0 d0AV dAI
�
cB , cV
(2.19)
where the steady-state ratio cI /cV depends on the temperature and the sink density, but is in most cases equal to the ratio of diffusion coefficients of vacancies and interstitials (DV /DI ) [74]. The results yielded by this model are shown in Paper III and are summarized in Chapter 3.
24
CHAPTER 2. METHODOLOGY ∇cB/∇cV > 0
∇cB/∇cV < 0
cV
enrichment of B
cV
cA
cB
cB
cA
depletion of B
Figure 2.5: Schematic representation of vacancy (V), iron (A), and solute (B) concentration gradients in the vicinity of a sink, depending on the sign of the concentration gradient ratio ∇cB /∇cV (Eq. 2.15). Since the vacancy concentration gradient is always negative, a negative ratio yields solute enrichment (left panel), whereas depletion occurs if the ratio is positive (right panel).
2.5
Self-consistent mean-field theory
SCMF theory is an analytical atomic diffusion model that allows for the calculation of transport coefficients in a near-equilibrium alloy. This near-equilibrium condition is determined by the presence of thermodynamic driving forces (i.e. gradients of chemical potentials) that perturb the equilibrium distribution function3 of the alloy and produce atomic and defect fluxes. The state of an alloy at a given time t can be described by the occupation numbers of all lattice sites: ~n(t) = {nα i }. The index α refers to the chemical species (e.g. A and B in a dilute alloy) and i to the lattice sites. Each occupation number nα i is 1 if site i is occupied by species α, or 0 otherwise. The evolution of the alloy in time is described by the Master equation [63]: i dPˆ (~n, t) X h ˆ ˆ (~n → m) = W (m ~ → ~n) Pˆ (m, ~ t) − W ~ Pˆ (~n, t) , dt
(2.20)
m ~
where Pˆ (~n, t) is the distribution function of the alloy at time t (i.e., the probability ˆ (m for the alloy to be in state ~n at time t), and W ~ → ~n) represents the transition rate from state m ~ to state ~n. The sum is performed over all possible configurational states m. ~ Transitions from one state to another are driven by defect migration. At equilibrium, no atomic flux occurs because of the absence of thermodynamic forces, and the equilibrium distribution function is given by 3 In kinetic theory, P (~ r, ~v , t) ∂~ r ∂~v defines the number of particles included in a small volume element ∂~ r and in a small velocity-space element ∂~v , at time t. The configuration space is in general continuous, but in a crystal lattice it is reduced to a discrete space of configurations ~ n, corresponding to the occupation of lattice sites by each chemical species.
2.5. SELF-CONSISTENT MEAN-FIELD THEORY
25
Pˆ0 (~n) = exp [−H(~nP )/kB T ] /Z. The normalization constant Z is the partition function, given by Z = m ~ n) is the equilibrium HamilB T ], whereas H(~ ~ exp [−H(m)/k tonian of state ~n, which depends on the thermodynamic atomic interactions. The departure of the system from equilibrium is modeled in SCMF as a perturbation of the equilibrium distribution function [63]: Pˆ (~n, t) = Pˆ0 (~n) · Pˆ1 (~n, t) .
(2.21)
The perturbation function Pˆ1 is assumed to hold the same mathematical structure as Pˆ0 . It depends hence on the non-equilibrium Hamiltonian: X αβ β ˆ =1 vij (t)nα h(t) i nj , 2
(2.22)
αβ,i6=j
αβ where the vij are effective interactions that are null at equilibrium4 . SCMF provides a self-consistent method to calculate these effective interactions, which in turn allow for the derivation of the transport coefficients based on atomic jump frequencies ω and equilibrium concentrations, as explained below. αβ In order to calculate the vij , the non-equilibrium distribution function is written in terms of two-point averages, for instance:
β hnα i nj i =
X
β Pˆ (~n, t)nα i nj .
(2.23)
αβ,i6=j
The Master equation (Eq. 2.20) combined with Eq. 2.21 allows for the derivation of the time derivative of these two-point averages as a function of the effective interactions. Afterwards, the one-point averages hnα i i yield a flux equation for each species, from which the transport coefficients can be obtained. The derivation is rather involved, and its full presentation is outside the scope of this manuscript. It is presented in details in [63] for vacancy-mediated diffusion, and in [60] for interstitialmediated diffusion. Useful explanations can also be found in [75, 76]. In Papers I and II, the vacancy method [63] has been applied without modifications, by using a dedicated computer code [76]. Conversely, in Paper III the SCMF interstitial method presented in [60] (and for dilute alloys in [64]) has been extended in this work to include a larger set of effective interactions. For this reason, a few details are provided here about the SCMF interstitial method, along with the improvements to the method developed during this project. 4 Here the effective Hamiltonian is expanded in terms of pair interactions only, although nothing prevents one from introducing as well multibody interactions [63].
26
CHAPTER 2. METHODOLOGY
SCMF interstitial method In case of dumbbell-assisted diffusion, the effective Hamiltonian of Eq. 2.22 is written as [60]: ˆ = h(t)
X
viI (t)nIi +
I
1 X I,σ vij (t)nIi nσj . 2
(2.24)
σ,I,i6=j
In addition to the pair interactions between a dumbbell I and species σ, an internal dumbbell interaction viI (between the dumbbell atoms) is introduced. In a binary dilute alloy, the possible dumbbells are AA and AB. The summations are performed over all dumbbells I included in the alloy, of any composition and orientation. This model is limited to h110i dumbbells, which can adopt six equivalent orientations. This section is focused on the specific case of a dilute binary alloy.
N a)
j
M
L i
b)
vijABα/C
M
j
i
L
vjiC/BAα
N ∇µ
∇µ
N,M Lα LMα ,N Figure 2.6: Example of symmetric pair interactions (vij = −vji ) between a dumbbell LM with orientation α and a third atomic species N in 1nn position. The shaded planes mark the symmetry planes, perpendicular to the direction of ~ the chemical potential gradient ∇µ.
The amount of effective interactions to be distinguished is determined by the kinetic interaction range and by symmetries. The kinetic interaction range should be at least as large as the thermodynamic interaction range (discussed in Section 2.1). In [64], the range was limited to 1nn sites, and this work extends it to 1nn of 1nn sites. Different interactions must be defined for dumbbells AA and AB, as well as for pairs AA-B. Moreover, interactions of type AA-B within the same nearestneighbor distance must be distinguished according to symmetries defined by the crystal structure and the chemical potential gradient (CPG) direction. The effective interactions are defined as symmetric with respect to the plane perpendicular to
2.5. SELF-CONSISTENT MEAN-FIELD THEORY
27
the CPG direction. Therefore, the following symmetry operations apply: vM Lα = −vLMα ,
(2.25)
LMα ,N N,M Lα , = −vji vij
(2.26)
where α refers to one of the possible 6 orientations. Here, L and M are generic dumbbell atoms (they can be either A or B), and N is a third atom on site j. A pair of symmetric effective interactions corresponding to Eq. 2.26 is shown in Fig. 2.6. This implies that interactions involving equal chemical species are null. In a dilute binary alloy, then, only interactions of type vAB and vAA,B are kept. Also, interactions that are fully perpendicular to the CPG (i.e. both the dumbbell orientation and the dumbbell-third atom bond) are also null. In addition, two interactions are not symmetric (and must therefore be distinguished) if one of the following three conditions is true: 1. the absolute value of the bond projection on the CPG direction is different; 2. the absolute value of the dumbbell orientation on the CPG direction is different; 3. the absolute value of the bond projection on the direction of the dumbbell orientation is different. The combination of these rules yields the set of effective interactions shown in Fig. 2.7. Under the assumption that the CPG direction coincides with one of the main axes, there are two equivalent dumbbell orientations that are perpendicular to the CPG (index ’0’), and four equivalent orientations that are not perpendicular (index ’+’). The 3-atom interactions are then classified according to the nomenclature defined in Paper III. The interactions above the dashed line were introduced in [64], whereas the others have been added here. A computer code has been developed in this work in order to analyze these symmetries automatically for any kinetic interaction range, and to calculate transport coefficients of a wide range of alloys in an efficient way, solving the set of SCMF analytical equations. Once the set of independent kinetic interactions has been defined, one kinetic equation for each interaction can be written, analogously to Eq. 2.23. A kinetic equation for the internal dumbbell interaction vAB can also be written. The procedure to derive such equations is considerably involved; in order to describe the general idea behind this procedure, the simplest kinetic equation is reported in Eq. 2.29. The explanation that follows is not meant, therefore, to be exhaustive. The equation represents the one-point kinetic equation for a dumbbell of type AB in orientation α on a site i, which corresponds to the kinetic interaction vABα . This equation describes the rate at which the average occupation number of this dumbbell in site i changes. Any change is caused by three types of events: I) migration of atom A towards its target sites s (second line of the equation), II) migration
28
CHAPTER 2. METHODOLOGY
of atom B towards its target sites s (third line), and III) onsite rotation of the dumbbell, leading to a dumbbell with a different orientation β (fourth line). The sums are performed over all possible target orientations β, and all possible species σ (A or B) that can be on the target site. In simple terms, the change of the one-point average is determined by all kinetic interactions that are involved during all the transitions just described. The multiplicative factors are the average transition rates, corresponding to the jump frequencies discussed in Section 2.1, and are described in details in Papers I and III. The index ’(0)’ refers to thermodynamic equilibrium conditions, which allows the transition rates to be calculated by means of common atomistic simulations, βα (0 or 1) is introduced to enas is shown in Paper I, II, and III. The factor ysi sure that forbidden transitions in terms of target sites or dumbbell rotations are excluded. The averages are calculated from the equilibrium concentrations of the transition starting configuration, which can be obtained from binding energies (a model is presented in the appendix of [64]). The equation has been derived under the detailed-balance assumption, which states that at equilibrium each transition rate is equal to the rate of the reverse jump, e.g.: �(0)
σAβ B βα βα �(0) ABα σ αβ ¯ αβ ¯ . (2.27) = ni ns yis ωBA/σ ns ni ysi ωσA/B Fig. 2.8 depicts event II), where atom B moves to a target site s. In the equation appears always the difference between interactions involved in the dissociation jump (Fig. 2.8a), and during the association jump (Fig. 2.8b). The total contribution is given by internal dumbbell interactions and by the sum over all 3-atom interactions with atom species γ within sites k inside the kinetic interaction shell (in Fig. 2.8 limited, for simplicity, to the 1nn). α A Analogous equations can be written for 3-point averages such as dhnAB nj i/dt, i describing all possible transitions leading to the dissociation (and the formation) of a pair consisting of a dumbbell AB on site i and another atom A on site j. In the framework of this thesis, these equations are derived analytically, in order to generalize the work of [64] to any extent of the kinetic interaction range. Furthermore, the developed computer code is aimed at computing all terms of the kinetic equations and at solving the SCMF model analytically. All kinetic equations form a self-consistent system of equations that can be solved numerically with inexpensive calculations. Each point-average derivative in time is set to zero, which entails that the system is solved in steady-state conditions. The system can be written in matrix form as: ~ = ~b∇µ , TˆV σ
(2.28)
~ is the vector of the kinetic interactions (the unknowns), Tˆ is the matrix of where V the average transition rates, and ~b∇µσ (σ = A, B) is the vector of constant terms depending on the CPG of each species (the first line of Eq. 2.29). The inversion of ~∇µ . A Tˆ allows for the computation of σ-species dependent kinetic interactions V σ more rigorous formulation of the matrix problem can be found in [75, 76].
2.5. SELF-CONSISTENT MEAN-FIELD THEORY
orientation ’+’
+
+
+
+
v1b
0
v2b
0
X
v2a
+
v3b
0
v1a
+
X
v5a
0
v1b
v2a
+
0
X
vAB
+
+
v1a
v3a
orientation ’0’
species A species B
vAB
29
0
X
v3c
+
0
0
v3a
X
v3c
v3b
0
v5b
v2b
v5a
0
v5b
∇µ Figure 2.7: Summary of independent effective kinetic interactions inside the dumbbell (vAB ) and between a dumbbell AA and a solute atom B. The configurations are distinguished according to the dumbbell orientation (’0’ if perpendicular to the ~ ’+’ otherwise). The nomenclature vxα marks the chemical potential gradient ∇µ, nearest-neighbor distance (x) between the dumbbell and the solute, as well as the symmetry class (α) related to the distance between the solute and each dumbbell atom, according to the definitions of Fig. 1 in Paper III. The dashed line separates the interactions defined in the previous work [64] (above) from the ones introduced in this work (below).
30
� α X σA X σB �(0) A � �(0) B � d nAB βα βα ¯ βα ¯ βα i = ns β nB µs − µA ns β nA µs − µB i ysi ωσA/B i + i ysi ωσB/A i + dt s6=i,β,σ s6=i,β,σ X σA X σA X σA �(0) σAβ ,γ �(0) ABα ,γ �(0)
σA �(0) γ βα βα βα βα βα βα γ βα βα vik − ns β nB vsk vABα − ns β nB vσAβ + ns β nB + ns β nB i nk ysi ωσA/B i nk ysi ωσA/B i ysi ωσA/B i ysi ωσA/B k6=s,γ s6=i,β,σ k6=i,γ X σB X σB X �(0) σBβ ,γ �(0) �(0) ABα ,γ
σBβ A β α¯ β α¯ �(0)
σB γ βα ¯ βα ¯ βα ¯ βα ¯ γ βα ¯ βα ¯ vsk vik − ns β nA + ns ni ysi ωσB/A vABα − ns β nA vσBβ + ns β nA i nk ysi ωσB/A i nk ysi ωσB/A i ysi ωσB/A k6=i,γ k6=s,γ s6=i,β,σ X AB βα X AB γ βα X AB βα �
AB βα AB �(0) � � AB (0) AB (0) ABα ,γ AB (0) ABβ ,γ + n β yR ωR vABα − ni β yR ωR vABβ + ni β nk yR ωR vik − ni β yR ωR vik i 0 = (kB T )
β6=α
k6=i,γ
k6=i,γ
(2.29) γ
γ
b)
a)
γ
k
γ
σ
σ k
k
γ k
A
s
k
B
σB ,γ
i
γ
γ
k
k
k
k
dissociation of AB
association of AB
Figure 2.8: Representation of the third line of Eq. 2.29, featuring the dissociation (and association) of dumbbell AB through the migration of B towards a target site s, where a dumbbell σB is formed.
CHAPTER 2. METHODOLOGY
γ
A
γ
i
k
vsk β
k AB ,γ
k
γ
B
γ vik α
γ
k
s
γ
k
γ
2.6. EFFECT OF EXTERNAL STRAIN FIELDS
31
Finally, the transport coefficients can be obtained from the calculated kinetic interactions by writing the atomic flux equations. The equation of matter conservation yields [60]: X dhNiσ i dcσ σ = i =− Ji→s , dt dt
(2.30)
s6=i
where Niσ is the generalized occupation number, counting the total amount of atoms of species σ in site i (it can be 0, 1, or 2 for the σσ dumbbell). By the same procedure used to derive the kinetic equations, the flux of species σ is: � � � � σ � A � B (1) µs − µσi µs − µA µs − µB i i σ ~σ (1) · V ~∇µ ~∇µ Ji→s = −lσ(0) − l~σ · V − l , A B kB T kB T kB T (2.31) (1) (0) where lσ and l~σ depend on the average equilibrium transition rates. It is possible to recognize in Eq. 2.31 the flux equation used for the definition of transport coefficients (Eq. 2.9). By comparison, the transport coefficients are therefore obtained as: (1) (0) ~∇µ LAA = lA + l~A · V A (1) L ~ ~ = lA · V∇µB AB . (2.32) ~B (1) · V ~ L = l BA ∇µ A (1) (0) ~∇µ LBB = l + l~B · V B
2.6
B
Effect of external strain fields
In real alloys, the crystal is subjected to different types of stress fields, in particular next to large defects such as clusters, grain boundaries, and dislocations. The interaction of such fields with the elastic field induced by a point defect can modify the interactions with solute atoms, the diffusion rates, and flux-coupling tendencies [77]. This applies in particular for self-interstitial defects, as they introduce a greater distortion in the lattice with respect to vacancies. In continuous linear elasticity theory, a point defect can be modeled as a distribution of forces with zero net resultant and torque [78]. At first order, the defect is fully characterized by its elastic dipole Pij . The interaction energy with an external strain field can be written as [77]: ∆E el = −Pij εij ,
(2.33)
where the product on the right-hand side is to be interpreted as an Einstein product: Pij εij = P11 ε11 + P22 ε22 + P33 ε33 + 2(P12 ε12 + P13 ε13 + P23 ε23 ). In experimental
32
CHAPTER 2. METHODOLOGY
conditions (null stress field), the elastic dipole can be obtained from the measured strain. Conversely, in atomistic simulations Pij can be obtained by measuring the residual stress field, if the calculation is performed at constant volume (null strain field): Pij = −
Ω σij . NPD
(2.34)
NPD is the number of defects in a simulation cell with total volume Ω. The residual stress tensor σij is measured here by DFT calculations. In this way, it is possible to calculate the change of all energy properties of the defect as a function of any externally applied strain. The variation with strain of the dumbbell formation energy, the dumbbell-solute binding energy, and the migration energy are calculated as follows: ∆E f (ε) = ∆EI (ε) −
N +1 ∆EFe (ε) ; N
(2.35)
∆E b (ε) = ∆EI,sol (ε) + ∆EFe (ε) − ∆EI (ε) − ∆Esol (ε) ;
(2.36)
∆E m (ε) = ∆Esad (ε) − ∆Eini (ε) .
(2.37)
The precedent formulas are derived from the definitions of formation, binding and migration energies that can be found in Papers I and II. In addition, the modification of RIS tendency due to the strain field can be obtained, in first approximation, by applying these energy perturbations to the interstitial partial diffusion coefficient ratio of Eq. 2.15: ( � ) � + [∆QB (ε) − ∆QA (ε)] − Qε=0 Qε=0 dBI w1 A B ≈ = exp − . (2.38) dAI w0 kB T QA refers to the activation energy of a pure-iron dumbbell in a pure-iron environment, whereas QB is the activation energy of the mixed dumbbell. The straindependent variation of activation energies are obtained as: " 6 � �# X1 ∆Eαf (ε) + ∆Eαm,A (ε) ∆QA (ε) = −kB T ln exp − , (2.39) 6 kB T α=1 and � �# 6 X 1 ∆Eαf (ε) + ∆Eαb (ε) + ∆Eαm,B (ε) ∆QB (ε) = −kB T ln exp − , 6 kB T α=1 "
(2.40)
where the energy quantities are averaged on the six possible equivalent orientations of a h110i dumbbell. This average is needed because dumbbells in different orientations are affected differently by non-isotropic strains.
2.6. EFFECT OF EXTERNAL STRAIN FIELDS
33
In Eq. 2.38, any correlation effect is neglected. This represents a very first application aimed at verifying the magnitude of this effect, and a possible RIS tendency reversal. As a matter of fact, the strain field induces a modification of the transport coefficients, and consequently of the flux-coupling tendencies. This perturbation can be as well obtained by means of the SCMF theory, by analyzing the strain-induced distortion of the bcc cell symmetry and the consequent increase of the number of independent effective interactions. Hence, a new set of kinetic equations needs to be derived, as was done for vacancy diffusion under stress in NiSi alloys [79]. This will be the object of future work. εT
εV
a)
c)
b)
εs
εV εV ⎛ 1 εˆ � ε V ⎜ 0 ⎜ ⎝ 0
0 1 0
0 ⎞ 0 ⎟ ⎟ 1 ⎠
Hydrostratic strain
⎛ −1 0 0 ⎞ 1 εˆ = ε T ⎜ 0 −1 0 ⎟ ⎟ 2 ⎜ ⎝ 0 0 2 ⎠
z y
εˆ
⎛ 0 0 1 εS ⎜ 0 0 0 ⎜ ⎝ 1 0 0
⎞ ⎟ ⎟ ⎠
x
Tetragonal strain
Shear strain
Figure 2.9: Elementary strain types used for the calculation of strain effects on RIS tendencies. In Chapter 3, the results are shown as function of elementary strain types, which are summarized in Fig. 2.9. Any strain field can be decomposed in these three components [78, 79, 77]. Moreover, the model is applied to the strain field of a screw and an edge dislocation with Burger’s vector ~b = 21 a0 h111i. For a screw dislocation, the isotropic strain field is given by [80]: y b ε13 (x, y) = − 4π · x2 +y2 b x . (2.41) ε23 (x, y) = 4π · x2 +y2 ε11 = ε22 = ε33 = ε12 = 0 For an edge dislocation, the strain field is derived from the stress field σij as ε = Cσ, where C is the compliance matrix [81]. The isotropic expression of the stress field reads [80]: 2 +y 2 σ11 (x, y) = −ξy (x3x2 +y 2 )2 σ (x, y) = ξy x2 −y2 22 (x2 +y 2 )2 , (2.42) x2 −y 2 σ (x, y) = ξx 2 2 2 12 (x +y ) σ33 = σ13 = σ23 = 0
34
CHAPTER 2. METHODOLOGY
where ξ = bG/2π(1 − ν). ν is the Poisson ratio (0.29 in iron), G = E/2(1 + ν) the shear modulus, and E the Young modulus (211 GPa in iron) [81].
2.7
Electronic-structure calculations
Defect properties, binding energies and jump frequencies are calculated in this work by means of ab initio electronic-structure calculations. The aim of such class of methods is to calculate the ground-state energy (i.e. the lowest energy at absolute zero temperature) in a system composed by a collection of ions and electrons, by solving the time-independent multibody Schrödinger equation. The problem is divided between electronic and ionic relaxation thanks to the Born-Oppenheimer approximation [82]: since the time scales of electronic and ionic motion are different, the electrons can be regarded as moving in a fixed ionic potential that depends only on the position of the nuclei. The ground-state energy of the system is therefore found by the combination of two iterative loops, one for the electrons and one for the ions. The energy corresponding to a given ionic configuration is calculated by means of Density Functional Theory (DFT) [83], and numerical algorithms are applied in order to find the ionic configuration that minimizes the energy of the system. The purpose of DFT is to avoid the direct solution of the multi-electron Schrödinger equation by assuming that the energy of the system is a unique functional of the charge density ρ. In the Kohn-Sham scheme [84], a fictitious system of non-interacting electrons is introduced, which allows for the energy functional E[ρ] to be written in the following way: Z E[ρ] = Ts [ρ] + vext ρ(~r)d~r + VC [ρ] + Exc [ρ] . (2.43) The terms on the right-hand side are respectively the kinetic energy of the noninteracting electrons, the external potential (caused by the interaction with the nuclei), the classical Coulomb interaction between electrons, and the exchangecorrelation function. The latter term represents the error made by using the noninteracting kinetic energy, and by treating the electron-electron interactions classically [83]. The energy obtained by means of Eq. 2.43 represents the exact ground-state energy of the system [83], but the exchange-correlation function is unknown and requires the introduction of some approximations. The most common is the local density approximation (LDA) [83], according to which the exchange-correlation functional at a given point in space is given by that of a homogeneous electron gas, with density equal to the local density in that point. For a simple system such as an electron gas, the exchange-correlation function is known. However, the LDA is not accurate enough for calculations in e.g. transition metals, for which reason the generalized-gradient approximation was developed. It provides a correction to the LDA by postulating that the exchange-correlation function not only depends on the
2.7. ELECTRONIC-STRUCTURE CALCULATIONS
35
local value of the density, but also on the local value of the density gradient [83]. This correction allows for a great improvement in the prediction of transition-metal properties. A number of functionals exist, the most common ones for metals being that of Perdew and Wang [85] and that of Perdew, Burke, and Ernzerhof (PBE) [86]. Spin-polarized systems can be treated by separating the electron density into the spin components: ρ(~r) = ρup (~r) + ρdown (~r). The iterative method to calculate the energy in the electronic loop is as follows: starting from an initial guess of the electron density ρ, the exchange-correlation functional is calculated. This allows for the solution of the Kohn-Sham equation [84]: � � Z ρ r~0 ∂E [ρ] 1 xc φi (~r) = εi φi (~r) . − ∇2 + vext (~r) + dr~0 + (2.44) 2 ∂ρ ~r − r~0 The wave-function solution φi (~r) is used to calculate a new value of the electron P 2 density as ρ(~r) = i |φi (~r)| , and the total energy of the system can be obtained with Eq. 2.43. If the energy difference with respect to the previous step is larger than the desired tolerance, a new value of Exc [ρ] is calculated and the scheme is repeated until convergence. The implementation of such a scheme in computer codes requires the discretization of the wave functions and the external potential. In pseudopotential methods, this is done by expanding both of them in a finite basis set of plane waves. Moreover, in such methods two distinct descriptions of the valance (outer) and the core regions are applied, in order to avoid the many oscillations of the physical wavefunction that would require a large amount of elements in the basis set. In the valence region, normal plane waves are used, whereas inside the core the pseudo wave function and the pseudopotential are smoothened. The cutoff energy is the maximum energy of the basis set of plane waves . A more efficient scheme is provided by the projector-augmented wave (PAW) method [87]. In this case, the description of the core region is improved by expanding the wave function in terms of atomic orbitals, whereas in the valence region plane waves are still used. Bloch’s theorem allows for the wave function of electrons in a periodic potential to be written as [88]: � � ~ ~ φk ~r + T~ = eik·T φk (~r) , (2.45) which in turn allows for all properties to be computed by solving the Kohn-Sham equation in the first Brillouin zone. Several of these properties are obtained by numerical integration in k-space, which requires the definition of a k-point mesh. In this work, a Monkhorst-Pack k-point mesh (i.e., with equally-spaced points) centered in the Γ point is always employed. Moreover, in order to avoid abrupt step-wise changes in the integrand, the Fermi distribution is smeared around the Fermi energy with a parameter σ, which allows for the use of a limited number of
36
CHAPTER 2. METHODOLOGY
mesh points. This smearing is equivalent to introducing some non-zero temperature electronic excitation.
Calculation of energy barriers Much of the work in this thesis relies on the calculation of migration barriers between atomic configurations. These barriers can be computed with DFT calculations combined with the nudged elastic-band (NEB) method [89]. It is a method that allows for the minimum energy path (MEP) between two configurations to be found. The maximum along the MEP corresponds to the saddle-point energy, which gives the activation energy barrier. Generally speaking, elastic-band methods rely on a chain of images between the end-point configurations, which are connected to each other by springs. These images are optimized simultaneously by changing step by step the atomic configuration of each of them. The algorithm aims at minimizing the total path energy, given by the sum of the DFT energy of each state and the elastic energy. The total force acting on each image i is given by [89]: F~i = F~it + F~is . (2.46) � � ~ i , and the second term is the spring The first term is the true force F~it = −∇V R force, namely: � � � � ~ i+1 − R ~ i − ki R ~i − R ~ i−1 , F~is = ki+1 R (2.47) ~ i is the position of image i in the energy where ki are the spring constants and R space. This generic plain elastic-band method has two issues. In first place, the true force along the band "pushes" the images away from high-energy regions towards the shallow areas, reducing the image density in the saddle-point region, which is therefore poorly described. Secondly, the spring force perpendicular to the band might interfere with the MEP search, pushing the images upwards in the steepest region. The NEB method circumvents these issues by retaining only the true-force component perpendicular to the local tangent of the band, and the spring-force component along this tangent [89]: F~ineb = F~it ⊥ + F~is k .
(2.48)
In this way, spring forces allow the band to maintain a spread distribution of images, while the true force pushes the band towards the MEP. This is schematically depicted in Fig. 2.10a. Once the MEP has been found, however, there is no condition ensuring that one of the images is located exactly at the saddle point, and a spline interpolation between images is necessary. Alternatively, it is possible to apply the climbing-image algorithm [90]. In this algorithm, after a few regular NEB
2.7. ELECTRONIC-STRUCTURE CALCULATIONS
37
steps the image with the highest energy is identified. At this point, the total force acting on this image is no longer defined as in Eq. 2.48, but is replaced with the total true force, where the component along the band has been reversed: F~ neb = F~ t − 2F~ t k (2.49) imax
i
i
This can be better visualized with Fig. 2.10b. The reversed parallel component of the true force pushes the image upwards towards the saddle point, whereas the perpendicular component of the true force (with the correct sign) prevents the image to climb sideways. In this way, the true saddle-point can be found with great accuracy, whereas the other images with the regular NEB forces ensure that the algorithm keep the elastic band on the MEP. GH
a)
b) Fs// A
F⊥t
1
−F⊥t 2 B
−F//t
Figure 2.10: a) Schematic representation of the nudged elastic band method, to find the minimum-energy path between equilibrium states A and B. The lines represent isoenergy hypersurfaces. On each image, the true force act only on a plane perpendicular to the band local tangent, whereas the spring forces act only along the direction of the local tangent. b) Climbing-image forces acting on the image closest to the saddle point. The spring forces are removed, and the parallel component of the true force is reversed, in order to push the image towards the saddle point.
Calculation of attempt frequencies In Eq. 2.2, the attempt frequency ν is an effective frequency associated with the lattice vibrations. In the harmonic approximation, each atom of the lattice can be
38
CHAPTER 2. METHODOLOGY
seen as a body connected to its neighbors throughout a spring, forming a threedimensional spring network. Such a system is therefore characterized by a number of vibrational (phonon) modes that affect the defect vibrational properties, and the transition rates consequently [88]. The phonon spectrum can be calculated by diagonalizing the dynamical matrix, which is defined as [91]: Φij = √
1 ∂2E 1 ∂Fi =√ . mi mj ∂ri ∂rj mi mj ∂rj
(2.50)
Each element of the matrix is obtained by performing a small displacement rj of atom j, and measuring the force Fi acting on atom i. In an N -atom system, the matrix has size (3N − 3) × (3N − 3), because each atom has three degrees of freedom, and the total energy is translational invariant in a supercell with periodic boundary conditions. The displacement must be sufficiently small to remain within the harmonic approximation, and sufficiently large not to be affected by the numerical noise on the force measurement. In practice, this type of calculation can be done in ab initio codes in an automated fashion, as the code can determine the least amount of displacements needed to calculate the whole matrix, based on the supercell symmetries. A high level of accuracy on the residual forces in the relaxed supercell is required. The accuracy can be improved by performing several displacements of different amplitudes for each atom, and by interpolating the force with the least-squares method. The eigenvalues of the matrix are the lattice phonon modes. Following Vineyard’s theory [92], the attempt frequency of a defect can be determined as: ν=
3N −3 Y j=1
νjR
�3N −4 Y
νkS ,
(2.51)
j=1
where νjR are the phonon modes in the relaxed defected supercell, and νjS are those of the saddle-point configuration. In the latter configuration, one degree of freedom is missing, as it corresponds to the mode for the motion of the jumping atom in the saddle-point direction, which is constrained. Frozen-phonon calculations are also used in Paper II to determine the vacancy formation entropy in pure iron. In this case, following the work of Mishin et al. [93], the formation entropy can be obtained from the phonon modes of the undefected cell νjU and those of the relaxed defected cell νjR : 3N −6 3N −3 X X N − 2 Svf = − ln vjR − ln vjU , kB N − 1 j=1 j=1 where N is here the number of atoms in the undefected supercell.
(2.52)
2.8. KINETIC MONTE CARLO METHODS
2.8
39
Kinetic Monte Carlo methods
The aim of the second part of the thesis is to model the microstructure evolution of RPV alloys under irradiation. Long-term evolution can be simulated either by mean-field rate theory (MFRT) models, or by kinetic Monte Carlo (KMC) methods. MFRT is an analytical method featuring a set of balance equations that describe the concentration of defects and clusters of different size. Although their solution is fairly straight forward, the main setback is the absence of spatial inhomogeneities and correlations, which have been shown to be a significant feature in clustering phenomena [50]. On the other hand, KMC is a method that provides a solution to the Master equation (Eq. 2.20) with a stochastic approach. The evolution of the system is simulated by randomly choosing among a set of transitions between possible states, based on probability distribution functions built on the known transition rates. Each event is therefore characterized by a frequency ωi , corresponding to the thermally-resolved barrier of Eq. 2.2. The simulation time is advanced after each step with the residence-time algorithm [94]: − ln r , δt = P i ωi
(2.53)
where r is a random number between 0 and 1. In KMC, spatial correlations and the overall geometry of the system are correctly represented. One of the main drawbacks is the large computational power needed, especially when the system falls into trapping configurations. For instance, this occurs when the frequency of one event is much larger than that of the other events (e.g. solute atoms with a low migration barrier). Two types of KMC are employed in this work: atomistic (AKMC) and object KMC (OKMC). The main difference between the two methods lies in the entities performing the transitions. In AKMC, single species (atoms and defects) perform the jumps. In this way, the elementary atomic mechanisms are reproduced and the diffusion phenomena can be studied in details, although this yields a slower evolution. Conversely, in OKMC the evolution is driven by the transitions of userdefined objects, which can be for instance single defects, impurities, or their clusters. For this reason, OKMC belongs to the category of coarse-grained methods [95]. The possible events that can occur in an OKMC simulation are also defined by the user, and normally entail object migration, dissociation, aggregation (coarsening of smaller objects into bigger ones), or annihilation of opposite types of defects. This allows for longer time scales to be reached, because the motion of a big object, which would require a large amount of AKMC steps, occurs in OKMC with a single step. OKMC methods are therefore suitable to simulate microstructure evolution of RPV steels, as they allow to match the real time scales. In Paper V, a hybrid AKMC-OKMC model is presented. In this model, the evolution follows the usual AKMC algorithm. However, copper clusters above a critical size are treated in an OKMC fashion when they contain a vacancy, and they can migrate as a whole
40
CHAPTER 2. METHODOLOGY
object until the vacancy is emitted. Such approach represents an adequate tradeoff between simulation speed and accuracy of the elementary atomistic mechanisms. The only physical input that determines the reliability of the simulation is given by the transition rates of each event, which must therefore be as accurate as possible. This subject is treated in the following sections.
Transition rates in AKMC models As discussed in Section 2.1, the defect jump frequencies depend on the LAE around the defect. In a dilute binary alloy, it is fairly easy to obtain the jump frequencies for all the possible configurations. However, the task becomes prohibitive as soon as some complexity is added (e.g. concentrated alloys, multicomponent alloys, or multiple defects), because of the fast-increasing number of LAE configurations. The usual approach is to calculate migration barriers of a given configuration based on a cohesive model that is used to describe the energy of the system in that configuration. The whole model reliability depends then on the accuracy of the cohesive model. Interatomic potentials or cluster-expansion methods are the most common choices for such cohesive models [96, 50]. In particular, it is customary to build up pair-interaction models, where all properties of the alloy are described by effective atomic-pair interactions [97, 98, 40]. Such models need to be fitted on ab initio and experimental data in order to ensure their reliability. Once the cohesive model is defined, the migration barrier can be obtained by means of different approaches. The most common one is the use of the final-toinitial-state-energy (FISE) formula [96]: E mig = E0mig +
Ef − Ei , 2
(2.54)
(Fig. 2.11a) where Ef and Ei mark respectively the energy of the final and initial state, and are determined by the cohesive model. The attempt frequencies are usually assigned the value of the Debye frequency in iron (6 THz) [67]. This model then assumes that the energy barrier depends mostly on the energy difference between equilibrium end-states, neglecting in this way any effect by the LAE on the saddle-point properties. In Paper II, it is shown that the LAE effects are actually non-negligible and can affect the global solute-transport tendencies. Therefore, the FISE model is likely to be inaccurate in the reproduction of such tendencies. Moreover, it is also somewhat unphysical because it assumes a priori the knowledge of the final state, whereas this is actually unknown in reality. More advanced methods, allowing for the on-the-fly calculation of saddle-point energies, are available (e.g. the dimer method [99], or the NEB method based on DFT or other cohesive models), but are usually computationally demanding and their application for long-term evolution simulation is therefore impractical [50]. As an alternative to the FISE approach, it is possible to obtain the saddle-point energy by means of broken-bond models [100, 50]. In this way, the migration barrier is computed inde-
2.8. KINETIC MONTE CARLO METHODS
41
pendently of the final state, but the broken-bond model still has to be fitted on ab initio or experimental data. suggested decompoistion of Emig
final−to−initial−state energy Esad
a)
Esad
b) SP
E
Ef
energy
Ef mig
mig
E
E0
∆ E/2
b
Ei
Ei
Ei reaction coordinate
reaction coordinate
Figure 2.11: a) Schematic representation of the common energy model for the prediction of unknown energy barriers [96]. b) Decomposition of the migration barrier in a thermodynamic contribution (the binding energy Eib ) and a kinetic contribution (E SP ), suggested in this work. Finding the correct migration barriers corresponding to a given LAE is therefore crucial to reproduce the correct solute-transport behavior of defects in KMC models. For instance, the cohesive model used for the simulation of cluster formation in FeMnNiCu alloys [40] was tested in this work by calculating the transport coefficients of a dilute binary alloy by means of Eq. 2.12, but did not yield any vacancy-drag tendency. Conversely, the implementation of the exact set of ab initio jump frequencies yielded transport coefficients in perfect agreement with the SCMF method (as is discussed in Paper IV). The atomistic processes leading to cluster formation simulated by means of this pair-interaction model [40] are therefore likely to be inaccurate. The model can be improved by applying the cluster-expansion method to the saddle-point energies [96]. In other words, a way to circumvent the inaccuracy of the migration barrier prediction may be to aim at building a cohesive model for the saddle-point energy landscape. For this purpose, it would be beneficial to separate the kinetic component from the thermodynamic component of the migration barrier in the way suggested in Paper II: E mig = E SP + E0mig + Eib ,
(2.55)
42
CHAPTER 2. METHODOLOGY
(Fig. 2.11b) where Eib is the total binding energy of non-iron species (impurities and defects) in the LAE. E SP represents hence the perturbation from the background saddle-point energy due to the presence of non-iron objects in the LAE. It might be advantageous to build two separate cohesive models for Eib and E SP . In Paper IV, a simple cohesive model is used to calculate the properties of vacancy-MnNi clusters in FeMnNi dilute alloys. It is based on the sum of pair binding energies between non-iron objects Xj as follows: Nobj f
i
∆E = E − E =
X h�
� � �i b,f b,i b,f b,i EV,X − E + E − E , V,Xj AT,Xj AT,Xj j
(2.56)
j=1
where AT marks the migrating atomic species. The migration barriers are then obtained with the FISE formula (Eq. 2.54). The binding energies at 1nn and 2nn are calculated ab initio. The purpose is to build a simple model that can yield the correct solute-transport tendencies, which are related, although not exclusively, to the thermodynamic interactions. However, the saddle-point interactions is still neglected, and the flux-coupling tendencies turn to be still underestimated with respect to the SCMF predictions. An alternative solution to this migration-barrier issue is presented in the following section.
Artificial neural networks Paper V investigates an alternative approach to the prediction of migration barriers. Based on the work of Castin [101, 102, 103, 104], the migration barriers of unknown LAE configurations can be predicted by using artificial intelligence, more precisely by performing a non-linear regression based on an artificial neural network (ANN). This method has been successfully applied to simulate copper precipitation in FeCu alloys, and has proved to be both physically reliable and computationally efficient [105, 106, 107]. The main idea is to build a network that can "learn" to predict migration barriers based on a set of known examples. In this way, the network can provide reliable predictions when the LAE appearing during the simulation is not part of the set of known examples. The accuracy of the ANN predictions is checked by means of another set of known barriers. The ANN in this case can therefore be seen as an extension of a polynomial fitting procedure, where the coefficients of the polynomial are obtained by minimizing the least-squares error. Neural networks are a broad range of methods that find application in several fields, such as data mining, pattern recognition and classification, data processing, non-linear control, and many others [108]. For instance, a relevant application for the purposes of this project is the prediction of radiation-induced hardening of RPV steels from a large database of RPV mechanical tests [109]. Neural networks represent a computational framework in which the solution to a problem is learned from a set of examples, taking inspiration from the information-processing mechanisms of the human brain. In the brain, electric signals are processed by neurons, connected
2.8. KINETIC MONTE CARLO METHODS
43
to other neurons through a thick and highly parallelized network of synapses. In each neuron the information processing is relatively slow, but the high degree of parallelism allows the brain to achieve a high processing power [110]. Most importantly, neurons can modify their responses after being exposed to external signals, a process that is usually referred to as "learning". For the application of interest in this work, the ANN is a non-linear mathematical function that transforms a set of inputs (the LAE chemical composition and the type of migrating atom) into an output (the migration barrier). The transformation occurs through a set of weight parameters, which are obtained by training on a known set of data. One of the most common types of ANN, which is also employed here, is the multilayer perceptron, an example of which is schematically depicted in Fig. 2.12. In this example, the network consists of an input layer, a hidden layer, and an output layer, each of them containing one or several nodes. Each node is a simple processing unit (the neuron of the ANN) that receives some input signals and emits an output signal. The hidden structure can be made of several layers in series. Each node is connected to other nodes by synapses. In so-called feedforward models, the most common ones, the signal is allowed to proceed only forward. This means that each node receives an input only from previous layers, and sends the output only to following layers [110, 104]. The mathematical structure of a given hidden node j is the following: ( yj = φ(vj ) , (2.57) PN vj = wj0 + i=1 wji xi where the index i marks the N inputs coming into node j, xi is the input value, yj the output of the node, and vj the internal activity. wji and wj0 are the weights (synapses) that can be determined by training the network. φ can be any non-linear function, which is usually bounded in order to prevent the formation and amplification of excessively large signals. The same structure characterizes as well the output node. Several techniques exist to design the most appropriate architecture, which consists in finding the optimal number of hidden layers, nodes, and synapses [104]. The architecture utilized in Paper V is a single-hidden layer network, and is described in details in [103]. Training the algorithm then consists in finding proper values for the synapses that minimize the error made on the training data set. This training set has to be carefully planned, in order to make it as much diverse and inclusive as possible. If the network is "taught" to predict barriers only in a restricted range of conditions, it would provide completely wrong predictions when the conditions are considerably different. For instance, an elementary but useful example is that the evolution of a concentrated alloy cannot be reproduced by an ANN that has been trained only on migration barriers calculated in the dilute alloy. For the purposes of this work the ANN represents an efficient, high-speed nonlinear regression method in the large database set of migration barriers in different LAE’s. It allows for the extraction of hidden knowledge from this database, and
44
CHAPTER 2. METHODOLOGY
input layer
xi
hidden layer
yi
output layer
yj = φ j(xi) ( w0j , wji )
yj = φ j(xi) ( w0j , wji ) LAE chemical composition
yj = φ j(xi) ( w0j , wji ) Migration barrier
Migrating species (Fe/Cu)
yj = φ j(xi) ( w0j , wji )
yj = φ j(xi) ( w0j , wji )
yj = φ j(xi) ( w0j , wji )
Figure 2.12: Example of artificial neural network with one hidden layer and 6 hidden nodes, applied to the calculation of migration barriers as functions of two input data: the type of migrating species, and the composition of the local atomic environment (LAE). Each node j is characterized by the parameters wj0 and wji , which are obtained by training the network on a set of known migration barriers.
is able to provide accurate predictions when new LAE’s are encountered. The application to prediction of migration barriers is hence very promising and can represent a valuable aid to microstructure-evolution models. The main setback is surely the need for a large amount of migration barriers to be used for training and validation. In [103] 104 barriers were calculated by means of the NEB method applied on an interatomic potential. This method allows large amounts of energy barriers to be calculated rather inexpensively, but obviously relies on the properties (and the reliability) of the potential used. In this work, the ANN training is performed for the first time with DFT-NEB calculated migration barriers. Thanks to the ever-increasing computational power of modern supercomputers, it is now feasible to perform large amounts of NEB simulations with DFT, which is to date the most reliable cohesive model that one can use to calculate alloy
2.8. KINETIC MONTE CARLO METHODS
45
properties. In the particular application to thermal aging in FeCu alloys, it is shown in Paper V how the set of known migration barriers can be limited to 2000 configurations, without invalidating the ANN predictive capabilities. This set has to be carefully planned in order to provide the ANN network with the most diverse and inclusive set of configurations, which sample as well as possible all the LAE’s that the defect may encounter during the simulation. For this reason, three types of LAE were distinguished and sampled (Fig. 1 of Paper V): a perfectly random alloy, a vacancy jump in the vicinity of small-sized Cu clusters, and vacancy transitions inside and across the surface of large Cu clusters. The latter LAE type uncovers another issue in this ANN-DFT approach. DFT-NEB calculations become in fact very computationally demanding in supercells larger than 250 atoms. Therefore, at the current state very large clusters cannot be treated with DFT. This matter is discussed in more details in Paper V.
Transition rates in OKMC models OKMC codes need to be parameterized by providing the transition rates for all events that are included in the model, mainly activation energies and prefactors for migration and dissociation of clusters of any composition and size. Other parameters might be needed, depending on the objects and the events included in the model, such as dissociation patterns (possible emission of different objects), object interaction radii, and sink strengths [95]. The stability (dissociation) and mobility (migration) parameters can be obtained by ab initio calculations for small-sized clusters, or with molecular-dynamics (MD) simulations and AKMC simulations for larger sized ones [95]. In this work, such parameters are obtained by means of dedicated AKMC simulations. Again, the reliability of these parameters depend on the cohesive model and migrationbarrier prediction method that is used in the AKMC model. In Paper IV, the cohesive model is provided by Eq. 2.56, whereas in Paper V the migration-barrier prediction is performed with the ANN. The algorithm to calculate the cluster parameters is quite straight forward [105, 106]. Provided that a reliable AKMC kinetic model is available, a cluster of a given size, composition, and at a given temperature is placed in the centre of a simulation cell with periodic boundary conditions. During the simulation, the cluster evolves with the usual AKMC algorithm until it dissociates, i.e. when it emits at least one of its constituents. This procedure is repeated N times in order to gather enough statistical data. At the end of each experiment, the following quantities are recorded: the cluster ~ j ), and trajectory, the relative distance covered by the cluster (i.e. the free path R the P dissociation time τ . The average dissociation time can be obtained as τ¯ = N τj /N . The diffusion coefficient can be inferred with two alternative procedures: 1. from the square of the free path of each simulation, using Einstein’s definition
46
CHAPTER 2. METHODOLOGY [58]: 2 ~ j N R X 1 D= ; N j=1 6τj
(2.58)
2. in case the mean free path is too short (for unstable or immobile clusters), the trajectories from several simulations are lashed together, to form a unique long trajectory. The latter is then divided in segments corresponding to time intervals of increasing size. The diffusion coefficient can hence be computed as a function of the size of the time interval, with Eq. 2.58. By doing this operation, a plot such as the one in Fig. 2.13a is obtained. The diffusion coefficient is then taken as the average D in the convergence (flat) zone [106]. The second method is more accurate, because when the distance covered in one simulation is too short, correlation effects might be lost, as the cluster has no time to possibly repeat back-and-forth jumps. Therefore, the diffusion coefficient might be overestimated. Finally, the mean free path is obtained either as an average of P ~ ~ the free paths Rj in each simulation: δ = 1/N j Rj , or by inversion of Eq. 2.58: √ δ = 6Dτ . 1000
b)
3.0
10–4
2.5
10–6
2.0 convergence zone
1.5 1.0
fitting nCu = 15 nCu = 100 nCu = 450 nCu = 6000
10–9
10–8
10–7
Time step [s]
10–6
10–5
4
8
12
16
10–8
Lifetime [s]
a)
Diffusion coefficient [10−12 m2/s]
Temperature [K] 3000 2000 1500
10–10 10–12
1/kBT [eV−1]
Figure 2.13: a) Example of calculation of diffusion coefficient (for a divacancy cluster) by lashing several trajectories from different KMC simulations and using the time step as a variable parameter. The diffusion coefficient is taken as the average in the convergence zone. b) Example of copper-cluster lifetime fitting in the Arrhenius domain. The slope of the straight line yields the cluster dissociation energy. The last step consists in deriving the dissociation energy, migration energy, and relative prefactors by performing a linear regression in the Arrhenius domain of the quantities τ¯ and D calculated at different temperatures, as is shown for instance
2.8. KINETIC MONTE CARLO METHODS
47
in Fig. 2.13b. The dissociation energy E dis and prefactor τ0 are therefore obtained as: � dis � E τ (T ) = τ0 exp , (2.59) kB T whereas the migration energy E mig and prefactor D0 are given by: E mig D(T ) = D0 exp − kB T �
� .
(2.60)
The quantities E dis , E mig , τ0 , and D0 for each cluster size and composition are therefore the main parameters used in the OKMC simulations.
Gray-alloy approach One of the main scopes of this project is to provide the theoretical background for the introduction of solute-transport mechanisms in OKMC simulations. This is not an easy task. It requires the knowledge of stability and mobility properties of a large variety of defect-solute clusters, and the complexity increases with the number of chemical species to be simulated in the alloy. Even simple solute-transport mechanisms (as for instance vacancy-solute coupled pairs) are still not included in the existing OKMC models, to the author’s knowledge. The systematic solutetransport investigation performed by this work allows to build the foundation for the implementation of direct solute transport in OKMC models. For instance, in Paper IV the stability and mobility parameters of solute-vacancy pairs are calculated by AKMC simulations parameterized with the exact ab initio migration barriers. In an existing OKMC model [111, 49] for the microstructure simulation of FeMnNi alloys, the presence of impurities was treated with a gray-alloy approach, and successfully applied to reproduce experimental results. Here, this model is used to simulate the long-term evolution of Ringhals steels. For this reason, a short presentation is provided here. Full details can be found in the aformentioned references. The OKMC model describes the evolution of vacancy- and interstitial-cluster populations under neutron irradiation. In addition to defect clusters, the model contains also carbon traps, dislocations and grain boundaries, as to reproduce as closely as possible the microstructure of a real alloy. Traps (C atoms and C2 V complexes) are modeled as immobile objects that can block defect clusters with an assigned cluster size-dependent binding energy. Their concentration is adjusted in order to match the actual carbon content in the matrix. Sinks are represented as spherical objects with the proper size and density to match the sink strength corresponding to the experimental dislocation density. Finally, grain boundaries are included by instantly removing an object when the total distance covered from the beginning of the simulation has reached the mean experimental grain radius.
48
CHAPTER 2. METHODOLOGY
The approach is defined as gray alloy because the chemical impurities (Mn and Ni) are not explicitly present in the code, but their effect is introduced by modifying the mobility parameters of defect clusters. The interstitial mobility reduction was based on the work of Terentyev et al. on FeCr alloys [33], where an MD-based analytical model was derived to describe the slowdown of interstitial clusters due to the presence of Cr solute atoms in the alloy. Analogous MD simulations have shown a similar effect by Mn impurities [112]. For this reason, the model described in [49] included the effect of Mn only, but it has been here modified in order to introduce a similar effect of Ni impurities. Recent DFT calculations [44] have shown that the binding energy of a Ni solute (EbNi ) with an interstitial loop is actually stronger than that of a Mn solute (EbMn ), which strongly suggests a similarity in the way they interfere with the loop mobility. Therefore, the diffusion coefficient of an interstitial loop of size n is defined as: " �# n ` EbMn + EbNi DnFeMnNi = exp − , (2.61) DnFe kB T where DnFeMnNi is the diffusion coefficient of a loop of size n in the multicomponent alloy, and DnFe is that of the corresponding cluster in pure-iron (which can be found in [111]). ` = 9 is an effective interaction range (in atomic-position units), and Mn/Ni Eb are the binding energy of one Mn or Ni solute atom with a loop (here attractive interactions are assigned a positive sign). On the other hand, the effect of Mn and Ni on vacancy impurities is not precisely known, and a first measurement of such parameters is provided in Paper IV. Therefore, in this gray-alloy OKMC model, vacancies are postulated to be considerably slowed down in an FeMnNi alloy up to a given size (n < 10), and completely immobilized above this size. This choice was made in order to fit the experimental measurement of vacancy-cluster density [49]. Although not yet proved, this assumption has been retained for the OKMC simulations of the Ringhals RPV steels presented in Chapter 4.
Chapter 3
Results I: Solute-transport mechanisms 3.1
Vacancy-assisted transport
In this section, the focus is on solute-transport tendencies arising from vacancy diffusion, to which Paper I and II are dedicated. The main goal is to identify the intrinsic impurity-transport mechanisms (inverse Kirkendall or vacancy drag, see Section 2.1), first for the main RPV chemical constituents observed in the radiationinduced nanofeatures (Paper I), and then for all transition-metal impurities (Paper II). As was discussed in the introduction, vacancy drag can possibly intervene as a growth mechanism for solute clusters, and be partially responsible for impurity segregation at grain boundaries or dislocations. The possibility of vacancy drag is therefore here investigated as a function of temperature. In Paper I, a network of 26 frequencies (Fig. 2.2) is developed to describe the effect of the impurity within the 5nn distance. The migration barriers for each transition are calculated by DFT, and the SCMF vacancy method is applied to obtain the transport coefficients [63]. The SCMF solution is achieved based on the computer code developed in [76], although the kinetic model is here extended in order to cover the 5nn distance. This represents the first complete analytical model able to investigate flux coupling without approximations in alloys characterized by long-ranged interactions. It provides a considerable advancement with respect to the available multifrequency models [113, 114] that were limited to 2nn interactions only and did not feature a full description of kinetic correlations. The main conclusions of Paper I are here drawn and discussed. Fig. 3.1 shows the solute-vacancy binding energies (left panel) and the wind factor (right panel). The latter is given by LBV /LBB , where LBV = −(LAB + LBB ) (A=Fe, B=solute, V=vacancy), and is positive when drag occurs. In the opposite case, the vacancy and solute fluxes are opposite to each other. All solutes characterized by a binding interaction with vacancies are subjected 49
50
CHAPTER 3. RESULTS I: SOLUTE-TRANSPORT MECHANISMS
to vacancy drag at low temperature, where correlations are enhanced by the Boltzmann factor exp(E b /kB T ). Therefore, Cu, Mn, Ni, P, and Si are expected to be dragged by vacancies, below a threshold temperature close to the Curie temperature1 in iron (1043 K [67]). At RPV temperature (≈ 300 °C) the coupling tendency is strong and suggests that such impurities can be carried by vacancies towards sinks, as for instance nucleated clusters, grain boundaries, or dislocations. Cr represents an exception, as it interacts only weakly with vacancies and is therefore not subjected to drag. This is in agreement with the lack of segregation of Cr atoms on solute-rich clusters [36, 37, 20, 38].
Binding energy [eV]
Cr Cu Mn Ni P Si
0.0 –0.1
0.5 dr ag no drag
–0.2
0.0 –0.5
–0.3 –0.4
b)
1.0 Wind factor
0.1
a)
–1.0 300°C
1nn 2nn 3nn 4nn 5nn Nearest neighbor distance
400
800 1200 1600 Temperature [K]
Figure 3.1: a) Solute-vacancy binding energy as a function of the nearest neighbor (nn) distance (negative signs stand for attractive interactions). b) Wind factor LBV /LBB as a function of temperature. Vacancy drag occurs for positive values of the ratio. The convergence of the flux-coupling tendencies with the extent of the thermodynamic interactions is also investigated in Paper I. Fig. 3.2 shows the wind factor for Cr and Ni impurities, for different thermodynamic models (1nn, 2nn, and 5nn), compared to a study [115] based on previous multifrequency models. Whereas for Cr the predictions of all models are alike, the predictions for Ni drag differ considerably. Because of the strong 2nn Ni-vacancy interaction, the 1nn model fails in reproducing the correct flux-coupling tendency, which is the reason why the predictions of [115] were incorrect. The 2nn model shows that Ni is dragged by vacancies. On the other hand, the extension to the 5nn shell is not essential. These results are confirmed also for the other impurities. Large differences between 1nn and 2nn models are consistently found, whereas the largest change of the 5nn model is seen only for Cu (namely, a mismatch of 150 K on the drag transition temperature, due to a non-negligible 5nn solute-vacancy binding interaction). Therefore, it can be concluded that any kinetic study in bcc alloys must include the effects of interactions to at least the 2nn distance. 1 The Curie temperature marks the transition between the ferromagnetic and the paramagnetic state.
3.1. VACANCY-ASSISTED TRANSPORT
Ref. [115] 1nn 2nn 5nn
Wind factor
1.0 0.5
51
Fe(Cr)
Fe(Ni)
1.0 0.5
dr ag
0.0
0.0
no drag
–0.5
–0.5
–1.0
–1.0 500
1000
1500
Temperature [K]
500
1000
1500
Temperature [K]
Figure 3.2: Wind factor for Cr and Ni impurities, as a function of temperature, obtained by using different thermodynamic models, with interaction ranges set to 1nn, 2nn, and 5nn. The blank markers refer to the results of a previous work [115].
Vacancy drag seems therefore to appear systematically at low temperatures. In order to investigate the origin of such flux-coupling tendencies, the method is extended in Paper II to include a wider range of impurities, encompassing all transition metals from Group IV to Group XII, as well as a few elements from the 3p row (Al, Si, and P). This is to achieve three main objectives. 1. Search for possible trends across the transition-metal groups, in order to investigate in detail the link between flux-coupling tendencies, defect properties (binding energies, migration energies, and attempt frequencies), and electronic-structure properties. 2. Verify the assumption according to which a 2nn solute-vacancy interaction is necessary for vacancy drag to arise, as advanced by previous studies [116, 117]. This statement is motivated by the necessity for the vacancy to visit 2nn sites during the drag path, as shown in Fig. 2.3. 3. Provide reliable predictions of solute diffusion coefficients at low temperatures, not accessible by experiments, and for impurities for which experimental diffusion coefficients are not available. The comparison with hightemperature experimental diffusion coefficients also allows for a model validation. Following the findings of Paper I, the range of thermodynamic interactions is set to the 2nn distance. The main results are reported in Fig. 3.3. All properties, with the exception of the 2nn binding energy, are characterized by common trends: bell-shaped curves for 4d and 5d elements, and M-shaped (or W-shaped) curves for the 3d ones. The latter shape is caused by the atypical behavior of Mn. Such
52
CHAPTER 3. RESULTS I: SOLUTE-TRANSPORT MECHANISMS
common trends are determined by interactions at the electronic level between impurity atoms and vacancies, both for what concerns the relaxed equilibrium states, and the saddle-point configurations. Since the drag threshold temperature (Fig. 3.3c) has a very similar shape, it is possible to state that flux-coupling tendencies are driven by such electronic interactions occurring both at equilibrium and during migration. It is thus evident that the apparently atypical behaviors of Cr (weak interaction and no drag) and Ni (strong 2nn binding energy) are not exceptions, but are part of consistent trends. Fig. 3.3c shows that the early transition metals, which have a 2nn repulsive interaction with vacancies, are also subjected to drag. This proves that vacancy drag is a more general phenomenon than expected, and given its solute electronic origin it is likely to arise also for impurity diffusion in other metallic matrices. The results can also explain the behavior of Mo impurities in RPV steels. As can be seen in the APT maps of [20], Mo is never to be found in solute-rich clusters, in spite of its non-negligible concentration (see Table 1.1). According to this work, since the drag threshold temperature for Mo is very close to the RPV operation temperature, Mo impurities are expected to undergo very weak drag tendencies, which can explain why they are not transported to solute-rich clusters. Solute jump frequencies (Fig. 3.3b) are directly related to the diffusion activation energy (Eq. 2.5), and are shown to be controlled by the solute compressibility. This leads to the curious effect that large solutes can migrate faster, which was already observed in the Ni matrix [120]. This effect is only partially compensated for by lower solute attempt frequencies and stronger correlations. The total activation energy is therefore mainly influenced by the solute migration barrier, the solute-vacancy 1nn binding energy, and the correlation factor. The slowdown effect due to correlations can be quite relevant: for instance, Fig. 3.3d shows the very low magnitude of the correlation factor, especially for the early transition metals. The method allows for the prediction of solute diffusion coefficients (shown in Fig. 11 of Paper II and in the Supplemental Material of the same paper). Because of magnetic effects, the shape of the diffusion coefficients is not linear in the Arrhenius plot. For this reason, the fitting to obtain the typical diffusion parameters (the activation energy Q and the prefactor D0 ) is temperature dependent. The fitting results in the range 400-800 K are shown in Table 3.1. In agreement with experiments, Co is predicted to be a slow diffuser, i.e. a solute with a lower mobility with respect to self diffusion. In addition, this work predicts that Re, Os, and Ir are also expected to be slow diffusers, although no experiments are available to confirm or disprove this prediction. Finally, the comparison with the available experimental data yields an outstanding agreement for center-band elements, and an increasing mismatch for elements towards the band end (with a maximal mismatch of a factor 30). The prediction exceeds in all cases the experimental values, and the mismatch seems to affect the prefactor only (with the notable exception of Mn, for which the activation energy is in complete disagreement). The bell shape of the mismatch (Fig. 3.3f) seems to indicate the effect of some quantities (possibly some entropic effects) that are missing or are not well caught by the assumptions of this model. A
3.1. VACANCY-ASSISTED TRANSPORT
b)
0.8 –0.2
0.6
–0.4
0.4
5d 4d
–0.6
3d 3p
1nn binding energy
Temperature [K]
2000 c)
Solute migration barrier
0.2 100
d)
10–2
1500
10–4
1000 Drag transition temperature
500
Correlation factor at 600 K
10–6
f)
e) Activation energy [eV]
1.0
10–13
3.0 2.8
10–14
2.6 10–15
Activation energy 400−800 K
2.4
Diffusion coefficient at 1100 K
2.2 Ti V Cr Mn Fe Co Ni Cu Zr Nb Mo Tc Ru Rh Pd Ag Hf Ta W Re Os Ir Pt Au
Al Si P
Ti V Cr Mn Fe Co Ni Cu Zr Nb Mo Tc Ru Rh Pd Ag Hf Ta W Re Os Ir Pt Au
Migration energy [eV]
a)
Al Si P
10–16
Correlation factor
Binding energy [eV]
0.0
Al Si P
Ti V Cr Mn Fe Co Ni Cu Zr Nb Mo Tc Ru Rh Pd Ag Hf Ta W Re Os Ir Pt Au
Diffusion coefficient [m2/s]
Ti V Cr Mn Fe Co Ni Cu Zr Nb Mo Tc Ru Rh Pd Ag Hf Ta W Re Os Ir Pt Au
53
Al Si P
Figure 3.3: Dependence of several properties in bcc Fe on the number of electrons in the outermost shell of the solute: a) 1nn solute-vacancy binding energy; b) solute migration energy; c) threshold temperature from drag to non-drag regime; d) correlation factor fB (Eq. 2.5) calculated at 600 K; e) solute-diffusion activation energy Q obtained from fitting in the temperature range 400-800 K; f) solute diffusion coefficient calculated at 1100 K (solid lines) compared with experimental measurements at 1100 K (blank markers) [118, 119]. The dashed lines represent the corresponding values in pure iron.
54
CHAPTER 3. RESULTS I: SOLUTE-TRANSPORT MECHANISMS
way to correct these predictions can therefore be to adjust the prefactor based on the mismatch with experiments at high temperature. Such values, when available, are provided in Table 3.1.
3.2
Interstitial-assisted transport
The solute-transport tendencies analyzed in the previous section need to be complemented with the analysis of solute transport via dumbbell mechanism, which is the main object of Paper III. Since under irradiation self-interstital atoms (dumbbells in Fe) are produced with vacancies in equal amounts, in steady-state conditions there is an equal flux of vacancies and interstitials towards sinks. For this reason, dumbbell motion can strongly contribute to solute transport. Moreover, dumbbellsolute correlations can strongly affect the mobility of single dumbbells as well as that of small dumbbell clusters, as highlighted by several works [33, 35, 49]. Discussing such correlations in the dilute limit (one dumbbell and one solute) can be beneficial to understand correlations in more complex systems. The method used here is analogous to that of vacancies. The thermodynamic range for solute-defect interactions is set to the 2nn distance, as inferred from the interaction extent predicted by DFT (Fig. 4 of Paper III). Based on this cutoff range, a multifrequency network in the LAE around the solute is built (Fig. 2 of Paper III). The corresponding migration barriers are obtained with the DFTNEB method, and the SCMF theory is applied in order to analyze the solutetransport properties. The existing SCMF model for interstitial diffusion in dilute alloys [64] is extended in order to include longer-ranged interactions, thanks to the aid of a computer code purposely developed. The combination of vacancy (Paper I) and interstitial (Paper III) transport coefficients yields then global RIS tendencies, which are presented in the next section. Experimental benchmarking is in this case more cumbersome, mainly because of the lack of interstitials in thermal equilibrium due to their large formation energy [59]. At any rate, it is qualitatively achieved in Paper III by comparing with resistivity recovery experiments [121, 122, 123] and RIS experimental observations in ferritic alloys [124, 125]. A highlight on the main results is provided in Fig. 3.4. The stability of the mixed dumbbell favors the possibility of solute transport. P, Mn, and Cr solutes are carried by dumbbells, whereas Si, Cu, and Ni solutes are not. This tendency is pronounced for P, Mn (strong binding) and Cu, Ni (strong repulsion), while for Cr and Si the interaction is weak and the overall tendency is affected by the mixeddumbbell jump frequency and all other jump frequencies in the LAE. Namely, the high migration barrier for the Fe-Si mixed dumbbell impedes Si transport, whereas Cr transport is made possible by the low barrier for the migration of the Fe-Cr dumbbell. This yields the ratio of partial diffusion coefficients shown in Fig. 3.4b. The transport of P and Mn atoms is very efficient, and is dominant over the vacancy mechanism. This is therefore likely to be the main mechanism leading to segrega-
3.2. INTERSTITIAL-ASSISTED TRANSPORT Partial diffusion coefficient ratio Dashed lines: uncorrelated ratio
1.0
0
LBB / LBB
0.6 0.4
103 100 Cr Cu Mn Ni P Si
0.2 300°C
0.0
400
800
1200
1600
b)
106
Mixed dumbbell binding energy Fe−Si +0.002 eV Fe−Cu +0.380 eV Fe−Ni +0.191 eV Fe−P −1.025 eV Fe−Cr −0.045 eV Fe−Mn −0.555 eV
0.8
109
400
800
1200
10–3
dBI / dAI
Correlation factor
a)
55
10–6 10–9
1600
Temperature [K]
Figure 3.4: a) Correlation factor for dumbbell-assisted solute diffusion as a function of temperature, and DFT mixed-dumbbell binding energies (negative values stand for attractive interactions). The dashed line marks the value of the geometric correlation factor f0 = 0.42 [58] for dumbbell diffusion in bcc crystals. b) Ratio of solute-to-iron partial diffusion coefficients (Eq. 2.17), as a function of temperature. Solute transport by a dumbbell mechanism occurs when the ratio is larger than unity. The dashed lines represent the same quantity when kinetic correlations are 0 0 not taken into account (i.e. dBI /dAI = lBB /lAA ).
tion of Mn and P atoms on solute clusters and sinks. It is worthwhile reminding, anyway, that P impurities can also move independently on an interstitial sublattice, and by continuous interchange between substitutional and foreign-interstitial position [57]. This could hence yield an even faster P migration via a general interstitial mechanism. Conversely, Cr transport is weaker and opposed to the vacancy tendency: there is thus a competition between the depletion tendency due to vacancy diffusion, and the enrichment tendency due to dumbbell diffusion. The dumbbell-solute correlation factors, corresponding to the fB factor of Eq. 2.5, are shown in Fig. 3.4a. This factor is small for Cr, Mn, P and close to unity for the other solutes. In the latter case, solute motion by mixed-dumbbell migration occurs very rarely, and the direction of two consecutive jumps is completely uncorrelated. In the former case, correlations slow down the motion of both solutes and interstitials. This is clearly visible in the uncorrelated PDC ratios shown in Fig. 3.4b (dashed lines). The effect is anyway relevant only for Cr. In this sense, the extension of this model to at least two solutes in the dumbbell LAE would lead to much stronger trapping effects, as was discussed in previous works [56, 33, 57]. Finally, it is worth mentioning that the results in terms of solute mobility and dumbbell-solute correlations are very similar to those obtained with the previous model [64], but the extension provided in this work is necessary to ensure that
56
CHAPTER 3. RESULTS I: SOLUTE-TRANSPORT MECHANISMS
the results are actually converged. The only relevant difference is seen in the LAB coefficient (Fig. 12 of Paper III), which is quite different from the prediction of the previous model. At any rate, the effect on solute transport is completely negligible because the off-diagonal coefficient for P and Mn is almost null. In conclusion, for the impurities here investigated solute transport occurs when the mixed dumbbell is stable. In this case, the diffusion coefficient is dominated by the LBB coefficient, because correlations with iron atoms are negligible. If the mixed dumbbell is not stable, no solute transport occurs. In the latter case, the calculation of PDC ratios can still be of interest if they happen to be of the same order of magnitude of the PDC ratio for vacancies, as is the case for some of the impurities discussed in the next section. It should be anyway mentioned that there might exist cases where the mixed dumbbell is unstable, but its migration energy is sufficiently low to compensate for the repulsive binding energy. In such cases, solute transport would be due to kinetics. This possibility could be investigated by extending this study to other impurities. Finally, it is worth pointing out that the LAB coefficient is always positive, as opposed to the vacancy LAB that can change sign. This entails that no mechanism of flux reversal (solute flowing in the opposite direction with respect to self interstitials in the bulk) can arise.
3.3
Radiation-induced segregation tendencies
The vacancy and dumbbell transport coefficients can be combined to analyze the steady-state RIS tendencies in the dilute limit by means of Eq. 2.19. This discussion summarizes the analysis included in Paper III. Fig. 3.5a compares the magnitudes of the partial diffusion coefficient ratios for the two types of mechanisms. Each PDC ratio is shown by setting the other ratio to one, in order to obtain a depletion tendency for positive values, and an enrichment tendency for negative values, in agreement with Eq. 2.19. In Fig. 3.5b are shown the global RIS tendencies, including the magnitude prefactor. The prefactor is calculated in this case by V,0 I,0 assuming that, at steady state, cI /cV = DV /DI = lAA /lAA , which corresponds to most of the temperature and sink-density regimes discussed in [74]. It is also assumed that there is no bias in the absorption of vacancies and interstitials. The vacancy mechanism is dominant for Ni, Cu, and Si, because the dumbbell mechanism is inactive (and the PDC ratio is almost null). Therefore, solute enrichment occurs as long as vacancy drag is ongoing, and depletion when vacancy drag terminates. This entails that, under vacancy drag, no interstitial mechanism is able to counterbalance the enrichment due to vacancies, as the interstitial PDC ratio is always positive. Just above the drag threshold temperature, the solute is slower than iron regarding vacancy diffusion, and enrichment would be expected. However, the incoming flux of Fe-Fe dumbbells counterbalances this effect, because more iron atoms are added to the sink. For Mn and P impurities, both mechanisms lead to solute enrichment, but the interstitial contribution is dominant. P and Mn are therefore preferentially
3.3. RADIATION-INDUCED SEGREGATION TENDENCIES
57
transported by dumbbells. The enrichment tendency is very strong and independent of temperature, in agreement with the heavy segregation well known for P [126, 31, 57, 20] and recently observed for Mn [46].
1600
10
1
1 dBV/dAV − 1
dBV / dAV − 1
0.1 0.01
Cr Cu Mn Ni P Si
x
1 − dBI/dAI sign change
xx
x
Solute depletion
Solute enrichment
xx
−1
x
x 0.01 x −1
−103
−103
−106
−106 −109
−109 400
1
300°C
b)
0.1 0.5 Solute depletion
0 Solute enrichment
∇cB / ∇cV
10
Temperature [K] 800 1200
1 − dBI / dAI
a)
400
–0.5 –1 400
800
1200
1600
Temperature [K]
800 1200 1600 Temperature [K]
Figure 3.5: a) Partial diffusion coefficient ratio for vacancy- (solid lines) and interstitial-assisted (dashed lines) diffusion as a function of temperature. The ratios are renormalized in order to have solute depletion in the above panel, and solute enrichment below. The sign change for a few curves is marked with ’X’. b) Global radiation-induced segregation tendencies as functions of temperature (Eq. 2.19). The concentration gradient ratio is explained in Fig. 2.5. The case of Cr is surely the most interesting. Here, the contributions to RIS by vacancy and interstitial diffusion are opposite, namely vacancies lead to solute depletion, and interstitials to solute enrichment. The balance yields a switchover at around 460 K. This is in qualitative agreement with previous RIS models [125] and with RIS experimental observation in Fe-Cr alloys [124], in which a switchover was observed at 650 °C. The quantitative disagreement can be explained by the high Cr concentration in the experimental samples (≈ 8%), for which a dilute-limit model is clearly unsuitable. This fine balance between vacancy and interstitial contributions is likely to be sensitive to experimental conditions (irradiation, sink density, local strains, and so on) and can hence explain the vast range of clashing Cr RIS tendencies observed in ferritic alloys [127, 128, 129, 130]. The other impurities consistently enrich in the low-temperature range. This is also in qualitative agreement with the experimental observations [124], where enrichment for Cu, Ni, Si was observed in the range 300 to 700 °C. For the other transition-metal impurities (those of Paper II), the RIS tendencies can be qualitatively discussed, although the interstitial transport coefficients have
58
CHAPTER 3. RESULTS I: SOLUTE-TRANSPORT MECHANISMS
not been calculated. Since for these impurities the mixed dumbbell is considerably unstable [116], the dumbbell PDC ratio is expected to be small. For vacancydragged impurities, the vacancy mechanism is thus expected to be dominant, and the enrichment-to-depletion switchover temperature should be close to that of the drag switchover. In the absence of vacancy drag, the vacancy and dumbbell PDC ratios might be of comparable magnitudes. In the latter case, obtaining the full set of interstitial transport coefficients is necessary for any conclusion about RIS to be drawn. Table 3.1 summarizes the transport properties for each of the analyzed impurities. When available, both vacancy and interstitial mechanisms are included in the balance, otherwise RIS tendencies due to vacancies only (with dBI /dAI = 1) are shown.
3.4
Effect of strain on interstitial transport
Strain fields next to solute clusters, grain boundaries, and dislocations can modify solute-defect interactions, diffusion rates, and flux correlations. For this reason, the steady-state RIS tendencies discussed in the previous section can be strongly affected as soon as the defect approaches a sink. This effect appears in both the defect properties and the transport coefficients. The SCMF method can be applied also to strained alloys, as was done for vacancy diffusion in NiSi alloys [79]. The amount of needed kinetic equations is increased by the reduced level of symmetry due to strain, and the use of computer codes such as the one mentioned in the previous section becomes necessary to analyze this complex symmetry. Here is presented a preliminary study about the effect of elementary strains (Fig. 2.9) on solute-transport properties by dumbbells in FeCr. This is achieved by computing the defect elastic dipole with DFT and by applying linear elasticity theory [78, 77] to obtain the change of dumbbell formation energy, dumbbell-solute binding energy, and pure and mixed dumbbell migration energy, according to Eqs. 2.35, 2.36, and 2.37. Furthermore, it is assumed that the PDC ratio can be approximated by the ratio of mixed-to-pure-dumbbell jump frequency (Eq. 2.38). This entails that all correlation effects, namely the effect of strains on the transport coefficients, are neglected. In future works, the effect on correlations will be introduced by means of the SCMF theory. The stability of the mixed dumbbell is strongly affected by hydrostatic strain, and the mixed dumbbell becomes unstable above ε = 0.5%. For this reason, the fraction of mixed dumbbells in the system with respect to the total dumbbell population (shown in Fig. 3.6a) becomes negligible for positive strain values (i.e. in tensile regions). For the other elementary strain types, the effect is more limited because of the compensation given by dumbbells in different orientations (e.g. a tetragonal strain can have opposite effects on h110i, h011i, and h101i dumbbells). Tetragonal strains have little effect on the PDC ratio at 300 °C, as can be seen in Fig. 3.6b. On the other hand, the other strain types can yield a non-negligible
3.4. EFFECT OF STRAIN ON INTERSTITIAL TRANSPORT
a) Relative concentration of mixed dumbbells in Fe(Cr)
59
b) Diffusion coefficient ratio in Fe(Cr) 102
0.30
573 K
Hydrostatic strain Tetragonal strain Shear strain
573 K 101
dBI / dAI
cAB / cI
0.20
Solute enrichment
0.10
100
Solute depletion
0.00
–0.01
0.00
ε
0.01
–0.01
0.00
0.01
10–1
ε
Figure 3.6: Effects of elementary strains ε on a) the fraction of mixed dumbbells in the total dumbbell population, and b) the ratio of partial diffusion coefficients for interstitial transport in FeCr. The elementary-strain types are shown in Fig. 2.9.
(a)
(b)
Figure 3.7: Variation of the interstitial partial diffusion coefficient (PDC) ratio DPDC = dBV /dAI for Cr transport in the elastically isotropic strain field of a) a screw dislocation, and b) an edge dislocation (Eqs. 2.41 and 2.42) with Burger’s vector ~b = 12 a0 h111i. The variation is calculated with respect to the PDC ratio in the absence of strain: δDPDC = DPDC (ε) − DPDC (0). The dislocation core radius is set to r0 = 3b. The solute enrichment tendency is more pronounced in the regions marked in red, which correspond to the compressive regions of the dislocation strain field.
60
CHAPTER 3. RESULTS I: SOLUTE-TRANSPORT MECHANISMS
Table 3.1: Summary of diffusion and flux-coupling properties for several impurities b in Fe: 1nn and 2nn solute-vacancy binding energy (ExV ), solute migration energy mig (Ex ) and attempt frequency (νx ), transition temperature (TT) from drag to nondrag regime, solute-diffusion activation energy (Q) and prefactor (D0 ) obtained by fitting in the temperature range 400-800 K, diffusion-coefficient mismatch with experimental values (Dx /Dexp ) at 1100 K [118, 119], transition temperature from enrichment to depletion RIS tendency, and dominant RIS mechanism at 600 K. b,1nn ExV [eV] 3p elements -0.32 Al Si -0.30 -0.38 P 3d elements -0.24 Ti -0.06 V Cr -0.06 -0.17 Mn Fe Co +0.02 Ni -0.10 Cu -0.26 4d elements Zr -0.75 Nb -0.37 Mo -0.16 Tc -0.12 Ru -0.11 Rh -0.15 -0.29 Pd Ag -0.52 5d elements Hf -0.61 Ta -0.31 W -0.13 -0.09 Re Os -0.10 Ir -0.14 Pt -0.26 Au -0.48 (V)
b,2nn ExV [eV]
Exmig [eV]
νx [THz]
Drag TT [K]
Q [eV]
D0 [cm2 /s]
Dx /Dexp at 1100 K
RIS TT [K]
Dominant mech. at 600 K
+0.02 -0.11 -0.27
0.49 0.51 0.40
5.1 3.5 2.2
954 1360 2172
2.73 2.71 2.57
10.0 11.9 10.4
3.0 6.7 14.9
986(V) 1420(V+I) enrichment
vacancy vacancy dumb/foreign
+0.17 +0.08 -0.01 -0.11 -0.10 -0.21 -0.17
0.37 0.51 0.55 0.42 0.70 0.73 0.63 0.51
8.2 10.1 9.7 5.6 10.8 8.9 9.6 4.3
750 274 262 1011 448 1087 1068
2.77 2.92 2.90 2.77 2.97 3.02 2.79 2.73
9.2 19.5 19.4 18.2 8.4 8.1 6.6 13.5
2.3 1.2 1-1.8 0.9-2.0 0.6-0.7 4.1 6.4-8.5
767(V) 281(V) 457(V+I) enrichment enrichment by V 1109(V+I) 1071(V+I)
vacancy vac/dumb(∗) vac/dumb dumbbell vac/dumb(∗) vacancy vacancy
+0.07 +0.15 +0.11 +0.04 -0.02 -0.10 -0.19 -0.23
0.08 0.34 0.57 0.68 0.73 0.74 0.64 0.45
3.4 5.8 8.9 12.2 10.8 13.1 9.6 3.7
1834 1096 593 515 483 646 1202 1942
2.37 2.65 2.82 2.85 2.89 2.86 2.67 2.44
2.7 6.2 9.9 8.2 7.9 8.6 5.8 5.2
10.2 3.8 17.5
1876(V) 1121(V) 608(V) 539(V) 550(V) 726(V) 1283(V) 2043(V)
vacancy vacancy vac/dumb(∗) vac/dumb(∗) vac/dumb(∗) vacancy vacancy vacancy
+0.16 +0.18 +0.14 +0.06 -0.01 -0.09 -0.19 -0.27
0.22 0.48 0.74 0.88 0.92 0.91 0.83 0.59
3.6 6.0 6.9 11.2 11.9 11.3 11.6 5.6
1618 973 529 388 457 596 1054 1822
2.47 2.69 2.87 3.06 3.08 3.04 2.83 2.49
4.1 6.7 5.1 11.0 12.1 11.4 9.1 4.6
6.3 1.6-2.4 28.8
1656(V) 1004(V) 605(V) enrichment by V enrichment by V enrichment by V 1383(V) 1952(V)
vacancy vacancy vac/dumb(∗) vac/dumb(∗) vac/dumb(∗) vac/dumb(∗) vacancy vacancy
Only the vacancy mechanism is considered. Both the vacancy and dumbbell mechanisms are considered. The possible presence of a dominant mechanism needs to be verified by computing the dumbbell transport coefficients.
(V+I) (∗)
perturbation. Namely, shear strain always increases Cr mobility, while in the case of large tensile strains (> 1%) Cr transport by dumbbells can be interrupted, and the enrichment tendency can turn into depletion (here the vacancy contribution to the RIS balance is neglected). These results show that the effect of strain fields can be relevant, and in cases where the RIS tendency is borderline (as is the case for Cr in Fe), local effects can lead to strong changes in the observed segregation tendencies. As a further example, the variation of the interstitial PDC ratio in the elastically isotropic strain field of a screw and an edge dislocation is shown in Fig. 3.7. The
3.4. EFFECT OF STRAIN ON INTERSTITIAL TRANSPORT
61
unstrained value of the PDC ratio is taken as reference. In both cases, the Cr enrichment tendency is enhanced, more prominently in the compressive regions. It is known that the dumbbell flux is preferentially directed towards dislocation tensile regions [131]. Hence, for edge dislocations the strain effect on solute segregation is likely to be small, because in the tensile region (for negative y-values in Fig. 3.7b) the PDC ratio is not affected. On the other hand, the enrichment tendency is more evenly distributed around a screw dislocation. For this reason, the strain effects are expected to be more important. When the strain-dependent variation of the transport coefficients is also included, this method can be useful to determine full 2-D segregation profiles and predict the segregation behavior in a vast range of experimental conditions.
Chapter 4
Results II: Kinetic Monte Carlo simulations The atomistic phenomena involved in solute precipitation and in the long-term microstructure evolution of irradiated alloys can be simulated by means of KMC methods. As was discussed in Section 2.8, the simulation reliability depends on the correct modeling of transition and event rates. The aim of this chapter is to discuss reliable KMC models that can reproduce the solute-transport tendencies highlighted in the previous chapter. For this purpose, the first application of an ANN based on ab initio calculations is presented (Section 4.3). In addition, the properties of a wide range of vacancy-solute clusters are calculated by means of AKMC simulations, with the aim of providing the necessary parameters to implement OKMC simulations with explicit solute transport (Section 4.2). Finally, the evolution of the Ringhals RPV steels is simulated by means of a gray-alloy OKMC model (Section 4.4).
4.1
Vacancy drag in AKMC simulations
In a recent work, the evolution of RPV model alloys (ternary FeMnNi, and quaternary FeMnNiCu) was simulated by means of a pair interaction-based AKMC model [40]. The authors showed the formation of two classes of precipitates, Curich (CRP’s) and Mn-Ni-rich (MNP’s) clusters. It was suggested that the formation of MNP’s would be driven by self-interstitial atoms, which can carry Mn impurities via a mixed-dumbbell mechanism and can be trapped by Ni impurities in a 1nn solute-interstitial configuration. On the other hand, the precipitation of copper clusters would be driven by vacancy drag of copper atoms. The possibility of vacancy drag of Mn and Ni impurities was mentioned, but not investigated. The conclusions drawn in [40] on the diffusion mechanisms can be verified based on the solute-transport tendencies obtained in Chapter 3, according to which Mn, Ni, and Cu solutes are dragged by vacancies at RPV temperature (≈ 300 °C). 63
64
CHAPTER 4. RESULTS II: KINETIC MONTE CARLO SIMULATIONS
The transport coefficients in AKMC simulations can be calculated by means of Eq. 2.12, and then compared with the ones obtained with the SCMF method. This is achieved here by following the evolution of one solute atom and one vacancy in a 432-atom simulation cell, and applying the FISE approach to the cohesive model of [40]. The results (triangles in Fig. 4.1) show that this KMC parameterization fails in reproducing the correct vacancy mechanism, as no vacancy drag is present. Hence, in this model the mechanisms leading to clustering, and consequently the predicted cluster composition, might be partly incorrect. Conversely, the same AKMC simulations performed with the ab initio jump frequencies (circles in Fig. 4.1) are in perfect agreement with the SCMF method. 300°C
Wind factor
1.0 0.5
dr ag
0.0
Cu Mn Ni KMC, Paper I KMC, Param. Ref. [40]
no drag
–0.5 –1.0 400
800
1200
1600
Temperature [K]
Figure 4.1: Wind factor for Cu, Mn, and Ni impurities in Fe, obtained with the SCMF method (lines), and by AKMC simulations based on DFT-computed jump frequencies (circles) or on the pair-interaction model of [40] (triangles). It is therefore necessary to find a better strategy to predict migration barriers, in order to ensure that the correct transport mechanisms are modeled. This is even more important when calculating the mobility properties of vacancy-solute clusters, as parameters for OKMC simulations. The ideal solution is represented by the direct implementation of ab initio-computed jump frequencies, which is feasible only in the case of single point defect-solute pairs, thanks to the limited amount of configurations to be considered. For instance, the properties of single vacancy-solute pairs are investigated in the first part of Paper IV, by using the jump frequencies obtained for the vacancytransport study of Paper I. The lifetimes, diffusion coefficients and mean free paths of vacancy-Mn, vacancy-Ni, and vacancy-Cu pairs are obtained with the AKMC algorithm explained in Section 2.8, and the results are shown in Fig. 4.2. Due to the strong binding energy, the vacancy-Cu pair is characterized by a higher stability than Mn and Ni. On the other hand, the lower migration barrier for the vacancyMn exchange enhances the mobility of the vacancy-Mn pair, which has an effective
4.2. STABILITY AND MOBILITY OF VACANCY-SOLUTE CLUSTERS
65
migration energy lower than that of a monovacancy. The combination of these two factors yields a long-ranged transport of Cu atoms, and of Mn atoms to a lesser extent, whereas the transport of Ni atoms is short-ranged. The previous KMC model [40] (empty markers in Fig. 4.2) considerably underestimated the transport capabilities of single vacancies, as the mean free paths were considerably lower. Vacancy transport was therefore not only occurring with the incorrect mechanism (absence of vacancy drag), but was also less efficient than the DFT-based prediction. 700 600 100
Ed = 0.84 eV Cu
10–2
d = 0.95 eV ENi
500
400
700 600
D [m2/s]
10–4 10–6
500
400 m = 0.66 eV EMn m = 0.75 eV ENi
10–13
m = 0.70 eV Evac
10–14 10–15 10–16
10–8 16
20 24 1/kBT [eV−1]
28
16
20 24 1/kBT [eV−1]
28
Temperature [K]
c) 8
Em = 0.73 eV Cu
10–12
d = 0.87 eV EMn
Lifetime [s]
Temperature [K]
b)
Mean free path [a0]
Temperature [K]
a)
700 600
500
400
V−Cu V−Mn V−Ni monovac
6 4 2 0
16
20 24 1/kBT [eV−1]
28
Figure 4.2: a) Average lifetime and dissociation energies E d , b) diffusion coefficient and migration energies E m , and c) mean free path of vacancy-solute pairs, obtained with AKMC simulations based on DFT-computed migration barriers. The monovacancy lifetime is here defined as the inverse of the vacancy jump frequency ω0 . The empty markers are obtained with the AKMC simulations based on the cohesive model of [40].
4.2
Stability and mobility of vacancy-solute clusters
The dataset shown in Fig. 4.2 and in Paper IV can be directly implemented in OKMC simulations to describe solute transport by single vacancies. This dataset should be complemented with the stability and mobility properties of mixed dumbbells, which can be obtained with analogous AKMC simulations based on DFTcomputed jump frequencies. Furthermore, the stability, mobility, and solutetransport capabilities of defect clusters should also be known. For this purpose, the properties of vacancy-Mn-Ni clusters are investigated in Paper IV. The direct use of ab initio-computed jump frequencies is prohibitive for multidefect and multi-solute systems, because of the large amount of LAE configurations. On the other hand, the pair-interaction model in [40] is inadequate because of the lack of vacancy drag. In Paper IV, this issue is addressed with a cohesive model based on DFT-computed binding energies between vacancies and solutes (Eq. 2.56), with the aim of enhancing the vacancy-solute correlations with respect to the previous pair-interaction model. With this simplified cohesive model, the properties of small vacancy-Mn-Ni clusters are obtained for clusters containing up
66
CHAPTER 4. RESULTS II: KINETIC MONTE CARLO SIMULATIONS
to four vacancies and two solute atoms of each type. A selection of the results is shown in Fig. 4.3. The panels above gather the properties of single vacancy-solute pairs, as obtained with the model based on Eq. 2.56 (full markers), and with the accurate DFT model (the same as in Fig. 4.2, here in empty markers). The results show that in this simplified binding energy-based cohesive model solute-vacancy correlations are still underestimated, more considerably in the case of vacancyMn pairs because of the wrong diffusion-coefficient prediction. The migrationbarrier prediction provided by Eq. 2.56 is therefore not sufficiently accurate to fully describe the correct diffusion mechanism. Temperature [K]
Lifetime [s]
D [m2/s]
V1Ni1 V1Mn1
10–4 10–6
d EMn = 0.85 eV
10–4 10–6
d EMn = 1.08 eV
10–8
Ed = vac
EdNi= 1.03 eV
16
20
10–15 10–17
Em = 0.74 eV
Mn Em = Ni Em = vac
0.75 eV 0.70 eV
10–11
V2 V2Ni2 V2Mn2
10–2
10–13
10–19
EdNi= 0.85 eV
100
Mean free path [a0]
V1
10–2
400
10–11
10–8
V2X2
700 600 500
0.88 eV
24
1/kBT [eV−1]
28
10–13 10–15 10–17 10–19
Em = 0.76 eV Mn
Em = 0.79 eV
Ni Em = vac
16
0.74 eV
20
Temperature [K] 700 600 500
Mean free path [a0]
100
Temperature [K]
400
D [m2/s]
Lifetime [s]
V1X1
700 600 500
24
1/kBT [eV−1]
28
400
V1Ni1 (DFT)
5
V1Mn1 (DFT)
4 3 2 1
7 5 3 1 16
20
24
28 −1
1/kBT [eV ]
Figure 4.3: Lifetime, diffusion coefficient and mean free path of vacancy-solute pairs (above), and vacancy-solute clusters containing two vacancies and two solute atoms (below), obtained with AKMC simulations based on the simplified cohesive model of Eq. 2.56. E d and E m mark the dissociation and migration energies, respectively. The empty markers refer to the results obtained with the DFT-based AKMC simulations. In the bottom panels of Fig. 4.3 are shown the properties of two-vacancy clusters containing two solute atoms, as well as the dissociation and migration energies. According to this model, the addition of solute atoms to a di-vacancy increases the stability and reduces the mobility of the complex. Moreover, the overall solutetransport capability is quite marked, especially for what concerns Mn impurities. In the gray-alloy OKMC simulations in [49], small vacancy clusters were postulated to be considerably slowed down by Mn and Ni impurities: for instance, the migration energy of a di-vacancy was increased from 0.62 eV [107] to 1.20 eV [49]. This
4.3. ANN-KMC SIMULATIONS OF THERMAL AGING IN FECU ALLOYS 67 assumption, although unjustified, was necessary to yield the correct microstructure evolution of the model FeMnNi alloy. One of the purposes of Paper IV is then to attempt to verify this assumption. Fig. 4.3 shows that a slowdown effect is present, although not to the extent postulated by [49]. Since solute-vacancy correlations are not fully caught, it is possible that the slowdown effect is here underestimated. However, the vacancy-cluster mobility might be reduced as well because of complex interactions between clusters, impurities, and carbon traps. This issue should be further investigated in future works. In spite of the limitations of the cohesive-energy model, the dataset obtained in Paper IV represents a good starting point for the introduction of solute transport by small vacancy clusters in OKMC simulations of FeMnNi alloys. It is also possible to obtain these properties with a slightly different approach, which can be directly used in gray-alloy OKMC simulations. In this case, the focus is on pure vacancy clusters, and their stability and mobility is calculated in a simulation cell containing a random distribution of Mn and Ni impurities. Under the same AKMC algorithm, the cluster is free to evolve until one or more vacancies are emitted. The results of a few simulations are provided in Fig. 4.4, where are shown the properties of a di-vacancy in an alloy with an increasing Mn content, for two values of the Ni concentration. The mobility of the vacancy cluster is not dramatically reduced by the presence of Mn impurities. On the other hand, the introduction of Ni impurities is much more impactful on both the dissociation and the migration energy. The overall vacancy-cluster mobility is therefore considerably reduced by nickel, to an extent that is closer to the assumptions of [49]. This effect is at any rate partially counterbalanced by an increase of the prefactor D0 (here not shown). The approach in Fig. 4.4 allows for the definition of the cluster properties (lifetime, diffusion coefficient, and mean free path) as continuous functions of the solute concentration, which can be therefore varied without the explicit introduction of the chemical impurities. Such data can be directly used in a gray-alloy OKMC simulation. Consistently with the results of Fig. 4.3, it is possible to conclude that according to this model Mn and Ni impurities are not sufficient to explain the partial immobilization of vacancy clusters postulated by [49].
4.3
ANN-KMC simulations of thermal aging in FeCu alloys
The KMC models discussed so far are not able to describe the proper solutetransport tendencies and correlations, because of the lack of a reliable migrationbarrier prediction. The ANN approach described in Section 2.8 represents a solution to this issue, as it provides a regression scheme for a more reliable on-the-fly calculation of migration barriers in unknown atomic configurations. In Paper V, an ANN has been purposely trained, for the first time, on ab initio-computed migration barriers, as opposed to previous works [103, 107] where an interatomic potential was used. This method is very promising because it maintains the physical properties of the cohesive model chosen for training (DFT in this case), and is therefore ca-
CHAPTER 4. RESULTS II: KINETIC MONTE CARLO SIMULATIONS b)
6.10–6
4.10–6 0.0% Ni
2.10–6
5.10–14 4.10–14 3.10–14 0.0% Ni
2.10–14 1.10–14
1.6% Ni
0.0 0.4 0.8 1.2 1.6 2.0
0.0 0.4 0.8 1.2 1.6 2.0
xMn [at.%] Dissociation energy [eV]
1.6% Ni
1.10 1.00 0.90 0.80
0.0% Ni
2 1.6% Ni
1.5 1
0.0 0.4 0.8 1.2 1.6 2.0
xMn [at.%]
1.30
e)
1.30 1.20
550 K 2.5
xMn [at.%]
1.40
d)
3
c) 550 K
0.0% Ni
0.0 0.4 0.8 1.2 1.6 2.0
xMn [at.%]
Migration energy [eV]
Lifetime [s]
1.6% Ni
550 K
Mean free path [a0]
a) 8.10–6
Diffusion coefficient [m2/s]
68
1.20 1.10
1.6% Ni
1.00 0.90 0.80 0.70
0.0% Ni
0.0 0.4 0.8 1.2 1.6 2.0
xMn [at.%]
Figure 4.4: Variation of a) lifetime, b) diffusion coefficient, and c) mean free path of a two-vacancy cluster in an FeMnNi alloy, as a function of the solute concentration, at 550 K. The AKMC simulations are based on the cohesive model described by Eq. 2.56. d) Dissociation energy and e) migration energy of the same cluster, as obtained after Arrhenius fitting in the temperature range 400-700 K.
pable of transferring the correct solute-defect correlations and transport properties from DFT to the KMC simulation. In principle, alloys of any chemical complexity can be modeled, simply by extending the set of configurations used for training, as opposed to the development of interatomic potentials [132, 41] which become overly complicated with the increasing amount of chemical elements involved. Here, the feasibility of such an approach is proven, by testing on the rather wellknown case of copper precipitation in thermally-aged FeCu alloys. This is the same system chosen for the first ANN application to migration-barrier predictions [103]. 2000 DFT-NEB migration barriers are employed for training and validation. In the overall, the DFT calculations required a total computational effort of about three million core-hours, which is surely a non-negligible but feasible amount. After the ANN training, the properties of Cu clusters containing one vacancy are obtained by means of AKMC simulations. Finally, the evolution of FeCu alloys is simulated with a hybrid AKMC-OKMC approach described in the Section 2.8, where the AKMC transition rates are provided by the ANN, and the OKMC rates are based on the aforementioned copper-cluster properties. Some of the Cu-cluster properties are shown in Fig. 4.5. In Fig. 4.5a are reported the diffusion coefficients with increasing cluster size, at different temperatures and in comparison with previous AKMC simulations [97] based on an
4.3. ANN-KMC SIMULATIONS OF THERMAL AGING IN FECU ALLOYS 69 ab initio-based pair interaction model. It should be noticed that in this kind of AKMC simulations, the simulation time needs to be rescaled based on the real vacancy concentration, which strongly depends on the binding energy between the vacancy and the Cu cluster. For the sake of simplicity, in Fig. 4.5a the time is rescaled by fitting the results obtained for the Cu monomer to the Cu diffusion coefficient calculated in Paper II, and the curves as functions of cluster size are shifted accordingly. This simplified procedure neglects the effect of the increasing vacancy-cluster binding energy with size. The latter would lead to a higher equilibrium vacancy concentration, hence to a lower the simulation time and a larger cluster diffusivity with respect to the obtained results. One of the main findings in [97] was that large copper clusters (n ≈ 100) are not only mobile, but are even more mobile than clusters of smaller sizes. This entails that direct coagulation of large precipitates should play an important role in thermal aging, as was confirmed subsequently by the first ANN-based work [103]. According to the results obtained here with the DFT-ANN method, the diffusion coefficient does not increase with cluster size. However, because of the increasing cluster stability, the mean free path does increase with size, as is shown in Fig. 4.5b, and the effect gradually fades with increasing temperature. This occurs because, according to DFT, vacancy and copper atoms are strongly correlated, and the vacancy thus stays longer inside the copper cluster, rather than around its surface. Hence, the DFT-ANN method yields an increasing mobility with cluster size in terms of longer distances covered, rather than in terms of diffusion coefficient. The mobility of large-sized clusters plays therefore still an important role, although it occurs more slowly. It should be mentioned, anyway, that introducing the aformentioned effect of the vacancy-cluster binding energy in the time rescaling would reduce the mismatch between these results and those in [97]. It is also interesting to observe the arising of "magic numbers" characterized by a sudden drop of the cluster mobility. They correspond to particularly stable cluster configurations, where the clusters atoms fill a full shell of nearest-neighbor positions: for instance, n = 15 corresponds to a cluster with one atom in the centre and 14 atoms fully covering the 1nn and 2nn shells. The thermal-aging evolution of a Fe-1.34%Cu alloy (from Paper V) obtained with the hybrid KMC approach is shown in Fig. 4.6. The simulation time is rescaled based on the real vacancy concentration (obtained by means of Eq. 2.1), as well as on the time spent by the vacancy next to copper atoms, according to the procedure explained in [103]. The microstructure evolution is generally well reproduced, although it is seemingly anticipated with respect to the experimental behavior. This might be due to the effect of entropic contributions. For instance the copper attempt frequency is here assumed to be equal to that of iron (6 THz), although it was found in Paper II to be more than two times smaller. Moreover, in the simulation of a low-Cu alloy (shown in Paper V), the cluster density is greatly overestimated. This is probably related to the specific DFT method (PAW-PBE) chosen for the training set of migration barriers, which is known to underestimate the solubility limit of Cu in Fe [116, 133]. This confirms the ability of the ANN
CHAPTER 4. RESULTS II: KINETIC MONTE CARLO SIMULATIONS
Diffusion coefficient [m2/s]
a)
10–23
500 K 600 K 750 K 500 K, Ref. [97] 600 K, Ref. [97]
10–26 10–29 10–32 10–35 1
10
100
Cu cluster size [n. atoms]
b) Mean free path [a0]
70
101
100
10–1
10–2
10–3
750 K 900 K 1125 K 1500 K Extrapolations
101
102
103
104
Cu cluster size [n. atoms]
Figure 4.5: (a) Diffusion coefficient and (b) mean free path of copper clusters containing one vacancy, with increasing cluster size, obtained with AKMC simulations based on the DFT-ANN approach. The dashed lines refer to the results of a previous AKMC model [97]. The extrapolated curves are obtained by fitting the corresponding diffusion coefficients √ D and lifetimes τ at high temperatures, and calculating the mean free path as 6Dτ .
approach to transfer the physical information of the used cohesive model (also the incorrect parts) into the KMC simulation. In this specific case, the choice of another DFT method would be useful to obtain results more in agreement with experiments. The model might also be improved by splitting the thermodynamic and kinetic descriptions. For instance, two separate ANN networks can act in parallel: the first one for the prediction of the end-state equilibrium energies, and the second one for the prediction of saddle-point energies, both based on DFT data. This approach will be investigated in future works. In general, this work demonstrates the feasibility of the DFT-ANN approach and its potential advantages for a consistent and efficient prediction of migration barriers in KMC simulations. The increasing computational power of modern supercomputers will allow for the calculation of larger sets of DFT migration barriers, which will in turn lead to the application of this approach to alloys of increasing chemical complexity, including several solute species, multiple defects, and interstitial-type defects.
4.4
Microstructure evolution of Ringhals steels
This thesis has thoroughly investigated the transport of solutes by point defects, and provides solute-defect cluster parameters for direct application in OKMC simulations of RPV microstructure evolution. Although an OKMC code featuring the explicit presence and transport of chemical impurities is still not available, the gray-alloy approach [49] can be applied to perform the first microstructure-evolution simulations of the Ringhals RPV steels. The microstructure analysis performed so
a)
71 1025
10
Exp. 973 K Exp. 873 K Exp. 773 K 973 K 873 K 773 K
1024
1023
1
b) Cluster density [m−3]
Average cluster radius [nm]
4.4. MICROSTRUCTURE EVOLUTION OF RINGHALS STEELS
1022 10–4 10–3 10–2 10–1 100 101 102 Annealing time [h]
10–4 10–3 10–2 10–1 100 101 102 Annealing time [h]
Figure 4.6: Simulation of thermal-aging evolution of a Fe-1.34%Cu alloy, by means of a hybrid AKMC-OKMC model based on the DFT-ANN parameterization: a) average radius, and b) total number density of copper clusters. The experimental data refer to various APT and SANS characterizations (the references can be found in Paper V).
far on surveillance samples consists in the APT characterization of solute clusters by [20], and the electron-microscope observations by [25] and [26], according to which no large defect clusters are observed. These gray-alloy simulations can give a first insight into the atomistic phenomena occurring in these specific RPV steels, which are characterized by a simultaneously high concentration of manganese and nickel. The experimental data needed for the OKMC simulations are summarized in Table 4.1. The relevant conditions of one of the last surveillance samples removed by Ringhals unit R4 are compared to those of the FeMnNi model alloy [134] simulated in [49]. The damage dose and flux are expressed in terms of displacements per atom (dpa), and are calculated based on the vessel irradiation history [135]. The simulations are performed with the chemical composition indicated by [20]. The Mn and Ni concentrations affect only the mobility of interstitial clusters, whereas the mobility of vacancy clusters is kept fixed to the values assumed in the previous work [49]. The amount of carbon in the matrix was measured by means of internal friction, and it was found mainly in the form of C2 V complexes [136]. The latter are therefore assumed to be the only type of traps in the system. Unfortunately, the average dislocation density and grain size are not available. For this reason, they are assumed to be equal to the model alloy. All other parameters and assumptions are unchanged with respect to the model-alloy case and can be found in [49]. The results are shown in Fig. 4.7, in terms of density and average size of vacancy clusters (above) and interstitial clusters (below). They are also compared with the model FeMnNi alloy [49] . Experimentally, vacancy clusters can be observed by PAS and TEM, the latter only above a size threshold of about 45 vacancies [49].
72
CHAPTER 4. RESULTS II: KINETIC MONTE CARLO SIMULATIONS
Vacancy clusters FeMnNi (PAS) FeMnNi (TEM) Ringhals (PAS) Exp. FeMnNi (PAS)
1025 1024
102
1023 101 1022 1021 1020 10–6
FeMnNi (PAS) FeMnNi (TEM) Ringhals (PAS) Exp. FeMnNi (PAS) 10–5
10–4
10–3
Size [n. vacancies]
Cluster density [m−3]
1026
100 10–2
10–1
10–6
10–5
10–4
10–3
10–2
10–1
Interstitial clusters 1027 1026 1025 1024
FeMnNi (APT) FeMnNi (TEM) Ringhals (APT) Exp. FeMnNi (TEM)
FeMnNi (APT) FeMnNi (TEM) Exp. FeMnNi (APT) Exp. FeMnNi (TEM) Ringhals (APT) Exp. Ringhals (APT)
102
101
1023 1022 1021 1020 –6 10
10–5
10–4
10–3
Dose [dpa]
10–2
10–1
10–6
10–5
10–4
10–3
10–2
10–1
Size [n. interstitials]
Cluster density [m−3]
1028
100
Dose [dpa]
Figure 4.7: Simulated microstructure evolution of Ringhals RPV steels with an OKMC gray-alloy approach, compared with the simulated evolution of a model FeMnNi alloy [134, 49]. For vacancy clusters, the curves marked with TEM refer to TEM-visible clusters larger than 45 vacancies, whereas those marked with PAS refer to the whole vacancy-cluster population. For interstitial clusters, the threshold for TEM-visible objects is 90 interstitials. The curves marked with APT refer to the population of invisibile intersitital clusters, assumed to correspond to the solutecluster population. The experimental points for the Ringhals samples are taken from [20], whereas those of the model FeMnNi alloy are to be found in [49].
4.4. MICROSTRUCTURE EVOLUTION OF RINGHALS STEELS
73
Table 4.1: Experimental characterization of the model FeMnNi alloy [134, 49] and of one of Ringhals surveillance capsules [15, 20], employed in the OKMC simulations of Fig. 4.7.
Composition [at.%] Irradiation temperature [°C] Neutron flux [n/cm2 s] Dpa flux [dpa/s] Dpa dose [dpa] Carbon in matrix [at ppm] Dislocation density [m−2 ] Average grain size [µm]
FeMnNi model alloy [134] 1.2% Mn, 0.7% Ni 290 [49] 9.5·1013 [134] 1.4·10−7 [49] 0.2 [49] 134 [49] 7·1013 [134] 88 [134]
Ringhals welds (R4, capsule U) [20] 1.37% Mn, 1.58% Ni 284 [20] 1.5·1011 [20] 2.7·10−10 [135] 0.11 [135] 100 [136] not available not available
TEM can also observe large interstitial clusters, above approximately 90 interstitials [49], but the smaller ones are invisible. However, if MNP’s form on immobilized interstitial clusters, APT solute-cluster density should correspond to the density of invisible loops. This was for instance the case in the model alloy (Fig. 4.7c), where the two densities matched perfectly. The OKMC simulations on Ringhals welds (blue lines in Fig. 4.7) show, consistently with the electron-microscope observations, that at such low dose-rate levels no TEM-visible defect clusters are formed. The average size of vacancy clusters remains close to one vacancy throughout the whole simulation. This occurs because the lower dose rate allows the defects to flow towards the sinks before a new primary-damage event occurs. However, it can be observed in Fig. 4.7c that the density of interstitial clusters does not match the APT solute-cluster density. This might suggest either a fault in the model parameterization, or that solute precipitates form not only on interstitial clusters, but also on vacancy clusters, possibly trapped by carbon atoms. Given the missing information about dislocation density and grain size, more simulations are performed by modifying such parameters and verifying their effect on the evolution of the interstitial-cluster population. Firstly, the grain size has been reduced by up to two orders of magnitude, but no major effects have been found. Furthermore, the bias factor has been modified according to the bias calculations in bcc iron performed in [131], setting ZI /ZV to 1.2, with respect to ZI /ZV = 2.5 used in [49] and in Fig. 4.7. With this new bias factor, the predicted cluster density match the APT solute-cluster population (Fig. 4.8a). Finally, the dislocation density has been increased up to ρD = 3·1014 m−2 , since ρD in Ringhals welds is expected to be higher than in the model alloy. The results depicted in Fig. 4.8b show that this parameter leads to a further improvement, although the effect is smaller than that of the dislocation bias. This first microstructure-evolution simulations of the Ringhals RPV steels confirm therefore that the observed solute clusters are likely to form on invisible in-
74
CHAPTER 4. RESULTS II: KINETIC MONTE CARLO SIMULATIONS Interstital clusters 1026 1025
1026 Exp. Ringhals (APT) ZI / ZV = 2.5 ZI / ZV = 1.2
Exp. Ringhals (APT) ρ D = 7e13 m−2 , ZI / ZV = 2.5 ρ D = 7e13 m−2 , ZI / ZV = 1.2 ρ D = 3e14 m−2 , ZI / ZV = 1.2
1024
1025 1024
1023
1023
1022
1022
1021
1021
1020 10–6
10–5
10–4
10–3
10–2
Dose [dpa]
10–1
10–6
10–5
10–4
10–3
10–2
10–1
b) Cluster density [m−3]
Cluster density [m−3]
a)
1020
Dose [dpa]
Figure 4.8: OKMC-simulated microstructure evolution of Ringhals RPV steels, where a) the dislocation defect-absorption bias ratio ZI /ZV has been modified from 2.5 to 1.2 match that of previous calculations [131], and b) the dislocation density ρD has been varied as a parametric quantity. The experimental APT measurements were performed in [20].
terstitial loops. However, it is difficult to assess the reason why the modified bias factor, outcome of an accurate modeling work [131], yields the correct evolution of the Ringhals steels, but not that of the model FeMnNi alloy. In order to perform a more accurate simulation, more microstructure characterization of the Ringhals surveillance samples is needed, namely the missing information regarding dislocation density and grain size, as well as PAS measurements of the vacancy-cluster density. When more experimental information is available, the parameterization of the gray-alloy model will need to be revised, in order to yield the correct evolution of both the model alloy and the RPV steel. Moreover, the assumption concerning the largely reduced vacancy-cluster mobility is still to be fully justified with more investigations of vacancy-Mn-Ni cluster properties (possibly with an ANN approach). As a further step, the model will be greatly improved when the chemical impurities are introduced explicitly, and solute-transport mechanisms by point defects and defect clusters are properly modeled. This will allow for an ultimate verification of the dynamics of the clustering process, as well as for an investigation of the actual role of vacancy clusters in the evolution of solute precipitates. Once ready, this model will be able to predict the evolution of RPV steels even beyond the timeframe covered nowadays by surveillance programs.
Chapter 5
Conclusions The primary objective of this thesis was the investigation of the atomistic-level mechanisms leading to the formation of embrittling solute-rich clusters in lowcopper reactor pressure vessel (RPV) steels. Given the apparent lack of thermodynamic driving forces inducing solute precipitation, it has been suggested [37, 40, 45] that such clusters nucleate on interstitial loops immobilized by manganese impurities, and grow collecting other impurities carried by incoming point defects. This mechanism is only possible if the point defects are able to transport solute atoms along. No experimental evidence of such a mechanism has emerged yet, because of the small size of these loops, but the gathering of solutes around loop-shaped objects has been recently observed [46]. The first part of the thesis consisted therefore in a systematic investigation of impurity-transport mechanisms in ferritic alloys, with the aim of proving from a modeling standpoint the actual possibility for such a mechanism to occur. This was achieved by combining ab initio calculations of atomic transition rates with a mean-field atomistic diffusion model that allows for an accurate analysis of solutedefect flux-coupling tendencies. The results show that all impurities observed in the embrittling nanofeatures (mainly Mn, Ni, and Si, but also Cu and P) are dragged by vacancies. Impurity drag by vacancies is found to be a common phenomenon occurring in iron (and likely as well in other metals) for all solutes characterized by a binding interaction with vacancies. It was also found that manganese and phosphorus impurities can diffuse via a dumbbell mechanism, which makes them considerably prone to radiation-induced segregation. The model predicts also a consistent enrichment of the aformentioned solutes on grain boundaries and dislocations, in agreement with the experimental evidence [124]. These flux-coupling tendencies prove therefore that the suggested dynamic formation mechanism can indeed take place under the vessel operating conditions. The second part focused on the development of kinetic Monte Carlo (KMC) models able to closely reproduce the impurity-transport properties uncovered in the first part. Introducing explicit solute-transport mechanisms in KMC simu75
76
CHAPTER 5. CONCLUSIONS
lations requires the determination of stability and mobility parameters of defectsolute clusters. This was here achieved for vacancy-manganese-nickel clusters by performing atomistic KMC simulations with different parameterizations. Such simulations showed that manganese and nickel impurities can effectively reduce the mobility of vacancy clusters, although not to the extent postulated in a previous work [49]. In order to include the correct correlations and transport tendencies, a new approach was here suggested for an accurate on-the-fly prediction of migration barriers. This approach featured an artificial neural network based on ab initio calculations. The first application to thermal aging in FeCu alloys showed the arising of strong vacancy-copper correlations, and produced a thermal-aging evolution close to the experimental one, within the limitations of the chosen DFT method. Finally, the microstructure evolution simulation of Ringhals RPV steels showed that large defect clusters are not expected to form, in agreement with the microstructure characterizations [25, 26]. According to this preliminary model, it is possible that the observed solute clusters form around small interstitial loops, but the obtained loop population is not sufficient to account for all solute clusters observed by atom-probe tomography [20]. The mismatch can be due to the limitations of the model, but might also suggest that immobilized vacancy clusters (i.e. small voids) act as nucleation centers for solute clusters, in a mechanism analogous to that of immobilized interstitial loops. Based on these achievements, the following future developments are suggested. 1. Extend the calculation of transport coefficients to concentrated Fe-X binary alloys and to multicomponent alloys, in order to describe the effect on the transport properties of inhomogeneous concentration fields and of synergies among impurities. The effect of external strains should also be investigated more carefully, in order to analyze the variation of such coefficients next to large defects (e.g. dislocation lines). 2. Implement in a computer code the computational framework for the calculation of transport coefficients by interstitials in concentrated alloys [60], and extend the self-consistent mean-field model to describe the transport properties of small interstitial clusters. 3. Introduce solute-transport mechanisms by defects in kinetic Monte Carlo simulations, in order to prove that solute clusters can form on interstitial loops. This must be achieved by completing the dataset of solute-defect cluster properties, for both vacancy- and interstitial-type clusters. 4. Pursue the development of ab initio-based artificial neural networks for the accurate prediction of migration barriers in further systems relevant for RPV alloys, such as an FeMnNi model alloy. This approach can be used also for the determination of defect-solute cluster properties mentioned in the previous point.
77 5. Improve the simulations of microstructure evolution of Ringhals RPV steels by introducing the transport of solutes explicitly and refining the simulation parameters. For this purpose, further microstructure characterization is needed in order to provide the missing microstructural information (part of this effort is already ongoing). This would allow to tune the simulation with the best parameterization, and can potentially provide a powerful tool to simulate the evolution of this steel beyond the lifetime covered by the surveillance program. In addition, it would allow for the investigation of flux effects, especially if combined with accelerated-irradiation experiments. This would help in assessing the reliability of surveillance samples, which are exposed to a higher flux than the actual one received by the RPV. This thesis provides an important contribution to the general ongoing effort to understand embrittling phenomena in ferritic steels at the atomistic level, and represents a step forward towards an ultimate modeling tool of microstructure evolution of irradiated ferritic alloys. The microstructure evolution can then be linked with the macroscopic change of mechanical properties, by analyzing the interaction between dislocations and e.g. solute clusters. This can be achieved with atomistic techniques such as molecular dynamics [34] and dislocation dynamics [137], but a wide multi-disciplinary effort is still needed in order to reach a satisfactory and inclusive prediction of hardening end embrittlement in RPV steels. The methods here described can be of interest for a much broader range of materials and applications. The combined ab initio-mean field approach is indeed useful for the determination of impurity diffusion mechanisms, flux-coupling tendencies and solute diffusion coefficients in a wide variety of alloys under irradiation. It can be also applied to investigate the kinetics of alloys under metallurgical processing, where it is important to know and control the microstructure evolution at different temperatures. In addition, the introduction of neural networks in microstructure-evolution simulations can combine their powerful regression capabilities with density-functional theory, which represents to date the most accurate cohesive model available. The increasing computational power will allow in the near future for the extension of this approach to complex alloys such as RPV steels, as well as to other materials of interest for Generation-IV and fusion applications.
Bibliography [1]
R. E. H. Sims, H. H. Rogner, and K. Gregory, “Carbon emission and mitigation cost comparisons between fossil fuel, nuclear and renewable energy resources for electricity generation,” Energy Policy, vol. 31, pp. 1315–1326, 2003.
[2]
D. Maisonnier, I. Cook, S. Pierre, L. Boccaccini, L. Di Pace, L. Giancarli, P. Norajitra, and A. Pizzuto, “DEMO and fusion power plant conceptual studies in Europe,” Fusion Engineering and Design, vol. 81, pp. 1123–1130, 2006.
[3]
T. Abram and S. Ion, “Generation-IV nuclear power: A review of the state of the science,” Energy Policy, vol. 36, pp. 4323–4330, 2008.
[4]
V. H. M. Visschers and M. Siegrist, “Fair play in energy policy decisions: Procedural fairness, outcome fairness and acceptance of the decision to rebuild nuclear power plants,” Energy Policy, vol. 46, pp. 292–300, 2012.
[5]
N. M. A. Huijts, E. J. E. Molin, and L. Steg, “Psychological factors influencing sustainable energy technology acceptance: A review-based comprehensive framework,” Renewable and Sustainable Energy Reviews, vol. 16, pp. 525–531, 2012.
[6]
“Investigation of long-term safety in the Swedish nuclear power industry and measures owing to the accident at Fukushima Dai-ichi,” Tech. Rep. SSM20101557-10, Strålsäkerhetsmyndigheten (Swedish Radiation Safety Authority), 2013.
[7]
S. L. Dudarev, J. L. Boutard, R. Lässer, M. J. Caturla, P. M. Derlet, M. Fivel, C.-C. Fu, M. Y. Lavrentiev, L. Malerba, M. Mrovec, D. Nguyen-Manh, K. Nordlund, M. Perlado, R. Schäublin, H. Van Swygenhoven, D. Terentyev, J. Wallenius, D. Weygand, and F. Willaime, “The EU programme for modelling radiation effects in fusion reactor materials: An overview of recent advances and future goals,” Journal of Nuclear Materials, vol. 386-388, pp. 1–7, 2009. 79
80
BIBLIOGRAPHY
[8]
B. D. Wirth, K. Nordlund, D. G. Whyte, and D. Xu, “Fusion materials modeling: Challenges and opportunities,” MRS Bulletin, vol. 36, pp. 216– 222, 2011.
[9]
M. L. Grossbeck, “Effect of Radiation on Strength and Ductility of Metals and Alloys,” in Comprehensive Nuclear Materials (R. J. M. Konings, T. R. Allen, R. E. Stoller, and S. Yamanaka, eds.), pp. 99–122, Amsterdam: Elsevier, 2012.
[10]
P. J. Maziasz and J. T. Busby, “Properties of Austenitic Steels for Nuclear Reactor Applications,” in Comprehensive Nuclear Materials (R. J. M. Konings, T. R. Allen, R. E. Stoller, and S. Yamanaka, eds.), pp. 267–283, Amsterdam: Elsevier, 2012.
[11]
C. English and J. Hyde, “Radiation Damage of Reactor Pressure Vessel Steels,” in Comprehensive Nuclear Materials (R. J. M. Konings, T. R. Allen, R. E. Stoller, and S. Yamanaka, eds.), pp. 151–180, Amsterdam: Elsevier, 2012.
[12]
F. A. Garner, “Radiation Damage in Austenitic Steels,” in Comprehensive Nuclear Materials (R. J. M. Konings, T. R. Allen, R. E. Stoller, and S. Yamanaka, eds.), pp. 33–95, Amsterdam: Elsevier, 2012.
[13]
“Integrity of reactor pressure vessels in nuclear power plants: assessment of irradiation embrittlement effects in reactor pressure vessel steels,” Tech. Rep. NP-T-3.11, International Atomic Energy Agency, 2009.
[14]
P. Efsing, J. Roudén, and M. Lundgren, “Long term irradiation effects on the mechanical properties of reactor pressure vessel steels from two commercial PWR plants,” in Effects of Radiation on Nuclear Materials: 25th Volume (T. Yamamoto, ed.), pp. 52–68, West Conshohocken: ASTM International, 2012.
[15]
P. Efsing, C. Jansson, G. Embring, and T. Mager, “Analysis of the Ductile-toBrittle Transition Temperature Shift in a Commercial Power Plant with High Nickel Containing Weld Material,” Journal of ASTM International, vol. 4, pp. 1–12, 2007.
[16]
B. Z. Margolin, V. A. Nikolayev, E. V. Yurchenko, Y. A. Nikolayev, D. Y. Erak, and A. V. Nikolayeva, “Analysis of embrittlement of WWER-1000 RPV materials,” International Journal of Pressure Vessels and Piping, vol. 89, pp. 178–186, 2012.
[17]
H. Hein, E. Keim, J. May, and H. Schnabel, “Some recent research results and their implications for RPV irradiation surveillance under long term operation,” in IAEA Technical Meeting on Degradation of Primary Components of Pressurised Water Cooled Nuclear Power Plants: current issues and future challanges, 5-8 November 2013, Vienna, Austria, 2013.
BIBLIOGRAPHY
81
[18]
A. Kryukov, R. K. Nanstad, and M. Brumovsky, “Common comparison of the irradiation embrittlement of WWER/PWR reactor pressure vessel steels,” Nuclear Engineering and Design, vol. 273, pp. 175–180, 2014.
[19]
World Nuclear Association, “Nuclear Power in Sweden.” http://www. world-nuclear.org/info/Country-Profiles/Countries-O-S/Sweden/, 2015. [Online, accessed on 21 October 2015].
[20]
M. K. Miller, K. A. Powers, R. K. Nanstad, and P. Efsing, “Atom probe tomography characterizations of high nickel, low copper surveillance RPV welds irradiated to high fluences,” Journal of Nuclear Materials, vol. 437, pp. 107–115, 2013.
[21]
US Nuclear Regulatory Commission, “Regulatory guide 1.99, rev. 2,” pp. 1– 10, 1988.
[22]
P. Efsing, J. Roudén, and P. Nilsson, “Flux Effects on Radiation Induced Aging Behaviour of Low Alloy Steel Weld Material with High Nickel and Manganese Content,” in Effects of radiation on nuclear materials: 26th volume (M. Kirk and E. Lucon, eds.), pp. 119–134, West Conshohocken: ASTM International, 2014.
[23]
M. G. Burke, R. J. Stofanak, T. J. Williams, K. Wilford, J. M. Hyde, H. Thompson, R. M. Boothby, C. A. English, W. L. Server, and P. Efsing, “Complementary LEAP & SANS evaluation of surveillance-irradiated low-Cu/high-Ni welds.” Presented at IGRDM, December 4-9, Santa Barbara, USA, 2011.
[24]
P. D. Styman, J. M. Hyde, D. Parfitt, K. Wilford, M. G. Burke, C. A. English, and P. Efsing, “Post-irradiation annealing of Ni–Mn–Si-enriched clusters in a neutron-irradiated RPV steel weld using Atom Probe Tomography,” Journal of Nuclear Materials, vol. 459, pp. 127–134, 2015.
[25]
W. Karlsen, “Analytical TEM examination of RPV weld metal microstructure,” Tech. Rep. VTT-R-01951-10, VTT Technical Research Centre of Finland, 2010.
[26]
M. G. Burke, T. N. Nuhfer, J. J. Haugh, and P. Efsing, “Characterization of irradiation damage in high Ni-Mn welds with low Cu: HREM characterization.” Presented at IGRDM, December 4-9, Santa Barbara, USA, 2011.
[27]
H. Thompson, “Post-irradiation annealing behaviour of surveillanceirradiated low-Cu/high-Ni welds.” Presented at IGRDM, December 4-9, Santa Barbara, USA, 2011.
[28]
G. R. Odette and R. K. Nanstad, “Predictive Reactor Pressure Vessel Steel Irradiation Embrittlement Models: Issues and Opportunities,” JOM Journal of the Minerals Metals and Materials Society, vol. 61, pp. 17–23, 2009.
82
BIBLIOGRAPHY
[29]
M. Lambrecht, E. Meslin, L. Malerba, M. Hernandez-Mayoral, F. Bergner, P. Pareige, B. Radiguet, and A. Almazouzi, “On the correlation between irradiation-induced microstructural features and the hardening of reactor pressure vessel steels,” Journal of Nuclear Materials, vol. 406, pp. 84–89, 2010.
[30]
D. Terentyev, L. Malerba, G. Bonny, A. T. Al-Motasem, and M. Posselt, “Interaction of an edge dislocation with Cu–Ni-vacancy clusters in bcc iron,” Journal of Nuclear Materials, vol. 419, pp. 134–139, 2011.
[31]
G. R. Odette and G. E. Lucas, “Embrittlement of nuclear reactor pressure vessels,” JOM Journal of the Minerals Metals and Materials Society, vol. 53, pp. 18–22, 2001.
[32]
M. K. Miller and K. F. Russell, “Embrittlement of RPV steels: An atom probe tomography perspective,” Journal of Nuclear Materials, vol. 371, pp. 145–160, 2007.
[33]
D. Terentyev, L. Malerba, and A. V. Barashev, “On the correlation between self-interstitial cluster diffusivity and irradiation-induced swelling in Fe–Cr alloys,” Philosophical Magazine Letters, vol. 85, pp. 587–594, 2005.
[34]
D. Terentyev, X. He, G. Bonny, A. Bakaev, E. Zhurkin, and L. Malerba, “Hardening due to dislocation loop damage in RPV model alloys: Role of Mn segregation,” Journal of Nuclear Materials, vol. 457, pp. 173–181, 2015.
[35]
K. Yabuuchi, M. Saito, R. Kasada, and A. Kimura, “Neutron irradiation hardening and microstructure changes in Fe-Mn binary alloys,” Journal of Nuclear Materials, vol. 414, pp. 498–502, 2011.
[36]
M. K. Miller, K. F. Russell, M. A. Sokolov, and R. K. Nanstad, “APT characterization of irradiated high nickel RPV steels,” Journal of Nuclear Materials, vol. 361, pp. 248–261, 2007.
[37]
E. Meslin, B. Radiguet, P. Pareige, and A. Barbu, “Kinetic of solute clustering in neutron irradiated ferritic model alloys and a French pressure vessel steel investigated by atom probe tomography,” Journal of Nuclear Materials, vol. 399, pp. 137–145, 2010.
[38]
P. B. Wells, T. Yamamoto, B. Miller, T. Milot, J. Cole, Y. Wu, and G. R. Odette, “Evolution of manganese–nickel–silicon-dominated phases in highly irradiated reactor pressure vessel steels,” Acta Materialia, vol. 80, pp. 205– 219, 2014.
[39]
G. R. Odette and G. E. Lucas, “Recent progress in understanding reactor pressure vessel steel embrittlement,” Radiation Effects and Defects in Solids, vol. 144, pp. 189–231, 1998.
BIBLIOGRAPHY
83
[40]
R. Ngayam-Happy, C. S. Becquart, C. Domain, and L. Malerba, “Formation and evolution of MnNi clusters in neutron irradiated dilute Fe alloys modelled by a first principle-based AKMC method,” Journal of Nuclear Materials, vol. 426, pp. 198–207, 2012.
[41]
G. Bonny, D. Terentyev, A. Bakaev, E. E. Zhurkin, M. Hou, D. Van Neck, and L. Malerba, “On the thermal stability of late blooming phases in reactor pressure vessel steels: an atomistic study,” Journal of Nuclear Materials, vol. 442, pp. 282–291, 2013.
[42]
E. Meslin, B. Radiguet, and M. Loyer-Prost, “Radiation-induced precipitation in a ferritic model alloy: An experimental and theoretical study,” Acta Materialia, vol. 61, pp. 6246–6254, 2013.
[43]
G. Bonny, D. Terentyev, E. E. Zhurkin, and L. Malerba, “Monte Carlo study of decorated dislocation loops in FeNiMnCu model alloys,” Journal of Nuclear Materials, vol. 452, pp. 486–492, 2014.
[44]
C. Domain. Private communication, 2015.
[45]
L. Malerba, “Advances in modelling nanostructural evolution in iron alloys: what do models tell about late blooming phases?.” Presented at the LONGLIFE final workshop, 15-16 January 2015, Dresden, Germany (available online at: http://projects.tecnatom.es/webaccess/LONGLIFE/ index.php?option=com_docman&task=cat_view&gid=242&Itemid=19).
[46]
B. Radiguet, S. Cammelli, E. Meslin, M. Hernandez-Mayoral, and P. Pareige, “Effect of neutron fluence on radiation-induced microstructure of low Cu RPV steels.” Presented at TMS, March 15-19, Orlando, USA, 2015.
[47]
Y. Nagai, Z. Tang, M. Hasegawa, T. Kanai, and M. Saneyasu, “Irradiationinduced Cu aggregations in Fe: An origin of embrittlement of reactor pressure vessel steels,” Physical Review B, vol. 63, p. 134110, 2001.
[48]
Y. Nagai, K. Takadate, Z. Tang, H. Ohkubo, H. Sunaga, H. Takizawa, and M. Hasegawa, “Positron annihilation study of vacancy-solute complex evolution in Fe-based alloys,” Physical Review B, vol. 67, p. 224202, 2003.
[49]
M. Chiapetto, L. Malerba, and C. S. Becquart, “Nanostructure evolution under irradiation in FeMnNi alloy: A "grey alloy" object Monte Carlo model,” Journal of Nuclear Materials, vol. 462, pp. 91–99, 2015.
[50]
C. S. Becquart and C. Domain, “Modeling Microstructure and Irradiation Effects,” Metallurgical and Materials Transactions A, vol. 42, pp. 852–870, 2010.
84
BIBLIOGRAPHY
[51]
S. Bugat, A. Zeghadi, and G. Adjanor, “A not-so-short description of the PERFECT platform,” Journal of Nuclear Materials, vol. 406, pp. 166–174, 2010.
[52]
R. L. Klueh and A. T. Nelson, “Ferritic/martensitic steels for next-generation reactors,” Journal of Nuclear Materials, vol. 371, pp. 37–52, 2007.
[53]
F. Danoix, E. Bémont, P. Maugis, and D. Blavette, “Atom Probe Tomography I. Early Stages of Precipitation of NbC and NbN in Ferritic Steels,” Advanced Engineering Materials, vol. 8, pp. 1202–1205, 2006.
[54]
Z. Mao, C. K. Sudbrack, K. E. Yoon, G. Martin, and D. N. Seidman, “The mechanism of morphogenesis in a phase-separating concentrated multicomponent alloy,” Nature Materials, vol. 6, pp. 210–216, 2007.
[55]
C. L. Fu, M. Krčmar, G. S. Painter, and X.-Q. Chen, “Vacancy Mechanism of High Oxygen Solubility and Nucleation of Stable Oxygen-Enriched Clusters in Fe,” Physical Review Letters, vol. 99, p. 225502, 2007.
[56]
C. Domain and C. S. Becquart, “Diffusion of phosphorus in α-Fe: An ab initio study,” Physical Review B, vol. 71, p. 214109, 2005.
[57]
E. Meslin, C.-C. Fu, A. Barbu, F. Gao, and F. Willaime, “Theoretical study of atomic transport via interstitials in dilute Fe-P alloys,” Physical Review B, vol. 75, p. 094303, 2007.
[58]
A. R. Allnatt and A. B. Lidiard, Atomic Transport in Solids. Cambridge University Press, 2003.
[59]
C. Domain and C. S. Becquart, “Ab initio calculations of defects in Fe and dilute Fe-Cu alloys,” Physical Review B, vol. 65, p. 024103, 2001.
[60]
V. Barbe and M. Nastar, “Phenomenological coefficients in a concentrated alloy for the dumbbell mechanism,” Philosophical Magazine, vol. 86, pp. 3503– 3535, 2006.
[61]
A. Seeger, “Lattice Vacancies in High-Purity α-Iron,” Physical Status Solidi A, vol. 167, pp. 289–311, 1998.
[62]
A. D. Le Claire, “Solute diffusion in dilute alloys,” Journal of Nuclear Materials, vol. 69-70, pp. 70–96, 1978.
[63]
M. Nastar, “A mean field theory for diffusion in a dilute multi-component alloy: a new model for the effect of solutes on self-diffusion,” Philosophical Magazine, vol. 85, pp. 3767–3794, 2005.
[64]
V. Barbe and M. Nastar, “Phenomenological coefficients in a dilute BCC alloy for the dumbbell mechanism,” Philosophical Magazine, vol. 87, pp. 1649–1669, 2007.
BIBLIOGRAPHY
85
[65]
T. R. Anthony, “Atom Currents Generated by Vacancy Winds,” in Diffusion in Solids: Recent Developments (A. S. Nowick and J. J. Burton, eds.), pp. 353–378, New York: Academic Press, 1975.
[66]
M. Nastar and F. Soisson, “Radiation-Induced Segregation,” in Comprehensive Nuclear Materials (R. J. M. Konings, T. R. Allen, R. E. Stoller, and S. Yamanaka, eds.), pp. 471–496, Amsterdam: Elsevier Inc., 2012.
[67]
C. Kittel, Introduction to Solid State Physics. Wiley, 8th ed., 2004.
[68]
N. Sandberg, Z. Chang, L. Messina, P. Olsson, and P. Korzhavyi, “Modeling of the magnetic free energy of self-diffusion in bcc Fe,” Physical Review B, vol. 92, p. 184102, 2015.
[69]
A. D. Le Claire, “Correlation effects in diffusion in solids,” in Physical Chemistry: an advanced treatise (H. Eyring, ed.), New York: Academic Press, 1970.
[70]
L. Onsager, “Reciprocal relations in irreversible processes. II.,” Physical Review, vol. 38, pp. 2265–2279, 1931.
[71]
A. R. Allnatt and E. L. Allnatt, “Computer simulation of phenomenological coefficients for atom transport in a random alloy,” Philosophical Magazine A, vol. 49, pp. 625–635, 1984.
[72]
E. Clouet and M. Nastar, “Classical nucleation theory in ordering alloys precipitating with L12 structure,” Physical Review B, vol. 75, p. 132102, 2007.
[73]
W. G. Wolfer, “Drift Forces on Vacancies and Interstitials in Alloys with Radiation-Induced Segregation,” Journal of Nuclear Materials, vol. 114, pp. 292–304, 1983.
[74]
R. Sizmann, “The effect of radiation upon diffusion in metals,” Journal of Nuclear Materials, vol. 69, pp. 386–412, 1978.
[75]
T. Garnier, Transfert des propriétés thermodynamiques et cinétiques de l’échelle atomique à l’échelle macroscopique pour la simulation des transformations de phase diffusives. PhD thesis, Université Paris Sud, 2012.
[76]
T. Garnier, M. Nastar, P. Bellon, and D. R. Trinkle, “Solute drag by vacancies in body-centered cubic alloys,” Physical Review B, vol. 88, p. 134201, 2013.
[77]
C. Varvenne, F. Bruneval, M.-C. Marinica, and E. Clouet, “Point defect modeling in materials: Coupling ab initio and elasticity approaches,” Physical Review B, vol. 88, p. 134102, 2013.
[78]
D. J. Bacon, D. M. Barnett, and R. O. Scattergood, “Anisotropic continuum theory of lattice defects,” Progress in Materials Science, vol. 23, pp. 51–262, 1980.
86
BIBLIOGRAPHY
[79]
T. Garnier, V. R. Manga, D. R. Trinkle, M. Nastar, and P. Bellon, “Stressinduced anisotropic diffusion in alloys: Complex Si solute flow near a dislocation core in Ni,” Physical Review B, vol. 88, p. 134108, 2013.
[80]
D. Hull and D. J. Bacon, Introduction to dislocations. Oxford: ButterworthHeinemann, 2011.
[81]
J. Roesler, H. Harders, and M. Baeker, Mechanical behaviour of engineering materials. Berlin: Springer-Verlag, 2006.
[82]
R. G. Parr and W. Yang, Density-Functional Theory of Atoms and Molecules. Oxford: Oxford University Press, 1989.
[83]
N. M. Harrison, “An Introduction to Density Functional Theory,” in Computational Materials Science (R. Catlow and E. Kotomin, eds.), pp. 1–26, Amsterdam: IOS Press, 2003.
[84]
W. Kohn and L. J. Sham, “Quantum Density Oscillations in an Inhomogeneous Electron Gas,” Physical Review, vol. 137, pp. A1697–A1705, 1965.
[85]
J. P. Perdew, J. A. Chevary, S. H. Vosko, K. A. Jackson, M. R. Pederson, D. J. Singh, and C. Fiolhais, “Atoms, molecules, solids, and surfaces: Applications of the generalized gradient approximation for exchange and correlation,” Physical Review B, vol. 46, pp. 6671–6687, 1992.
[86]
J. P. Perdew, K. Burke, and Y. Wang, “Generalized gradient approximation for the exchange-correlation hole of a many-electron system,” Physical Review B, vol. 54, pp. 16533–16539, 1996.
[87]
P. E. Blöchl, “Projector Augmented-Wave Method,” Physical Review B, vol. 50, pp. 17953–17979, 1994.
[88]
N. W. Ashcroft and N. D. Mermin, Solid state physics. Brooks/Cole, Cengage Learning, 1976.
[89]
H. Jonsson, G. Mills, and K. W. Jacobsen, “Nudged Elastic Band Method for Finding Minimum Energy Paths of Transitions,” in Classical and quantum dynamics in condensed phase simulations (B. J. Berne, G. Ciccotti, and D. F. Coker, eds.), World Scientific, 1998.
[90]
G. Henkelman, B. P. Uberuaga, and H. Jonsson, “A climbing image nudged elastic band method for finding saddle points and minimum energy paths,” The Journal of Chemical Physics, vol. 113, pp. 9901–9904, 2000.
[91]
G. E. Lucas and R. Schäublin, “Vibrational contributions to the stability of point defects in bcc iron: A first-principles study,” Nuclear Instruments and Methods in Physics Research Section B: Beam Interactions with Materials and Atoms, vol. 267, pp. 3009–3012, 2009.
Belmont:
BIBLIOGRAPHY
87
[92]
G. H. Vineyard, “Frequency factors and isotope effects in solid state rate processes,” Journal of Physics and Chemistry of Solids, vol. 3, pp. 121–127, 1957.
[93]
Y. Mishin, M. R. Sørensen, and A. F. Voter, “Calculation of point-defect entropy in metals,” Philosophical Magazine A, vol. 81, pp. 2591–2612, 2001.
[94]
A. B. Bortz, M. H. Kalos, and J. L. Lebowitz, “A new algorithm for Monte Carlo simulation of Ising spin systems,” Journal of Computational Physics, vol. 17, pp. 10–18, 1975.
[95]
C. S. Becquart, A. Barbu, J.-L. Bocquet, M. J. Caturla, C. Domain, C.-C. Fu, S. I. Golubov, M. Hou, L. Malerba, C. J. Ortiz, A. Souidi, and R. E. Stoller, “Modeling the long-term evolution of the primary damage in ferritic alloys using coarse-grained methods,” Journal of Nuclear Materials, vol. 406, pp. 39–54, 2010.
[96]
C. S. Becquart and C. Domain, “Introducing chemistry in atomistic kinetic Monte Carlo simulations of Fe alloys under irradiation,” Physical Status Solidi B, vol. 247, pp. 9–22, 2010.
[97]
F. Soisson and C.-C. Fu, “Cu-precipitation kinetics in α-Fe from atomistic simulations: Vacancy-trapping effects and Cu-cluster mobility,” Physical Review B, vol. 76, p. 214102, 2007.
[98]
E. Vincent, C. S. Becquart, and C. Domain, “Microstructural evolution under high flux irradiation of dilute Fe-CuNiMnSi alloys studied by an atomic kinetic Monte Carlo model accounting for both vacancies and self interstitials,” Journal of Nuclear Materials, vol. 382, pp. 154–159, 2008.
[99]
G. Henkelman and H. Jónsson, “A dimer method for finding saddle points on high dimensional potential surfaces using only first derivatives,” The Journal of Chemical Physics, vol. 111, pp. 7010–7022, 1999.
[100] F. Soisson and C.-C. Fu, “Atomistic simulations of copper precipitation and radiation induced segregation in α-iron,” Solid State Phenomena, vol. 139, pp. 107–112, 2008. [101] N. Castin, R. Pinheiro Domingos, and L. Malerba, “Use of computational intelligence for the prediction of vacancy migration energies in atomistic kinetic monte carlo simulations,” International Journal of Computational Intelligence Systems, vol. 1, pp. 340–352, 2008. [102] N. Castin, L. Malerba, G. Bonny, and M. I. Pascuet, “Modelling radiationinduced phase changes in binary FeCu and ternary FeCuNi alloys using an artificial intelligence-based atomistic kinetic Monte Carlo approach,” Nuclear Instruments and Methods in Physics Research Section B: Beam Interactions with Materials and Atoms, vol. 267, pp. 3002–3008, 2009.
88
BIBLIOGRAPHY
[103] N. Castin and L. Malerba, “Calculation of proper energy barriers for atomistic kinetic Monte Carlo simulations on rigid lattice with chemical and strain field long-range effects using artificial neural networks,” The Journal of Chemical Physics, vol. 132, p. 074507, 2010. [104] N. Castin, Atomistic kinetic Monte Carlo simulation of precipitation and segregation in metals for nuclear applications, using a novel methodology based on artificial neural networks. PhD thesis, Université Libre de Bruxelles, 2011. [105] N. Castin, M. I. Pascuet, and L. Malerba, “Modeling the first stages of Cu precipitation in α-Fe using a hybrid atomistic kinetic Monte Carlo approach,” The Journal of Chemical Physics, vol. 135, p. 064502, 2011. [106] M. I. Pascuet, N. Castin, C. S. Becquart, and L. Malerba, “Stability and mobility of Cu–vacancy clusters in Fe–Cu alloys: A computational study based on the use of artificial neural networks for energy barrier calculations,” Journal of Nuclear Materials, vol. 412, pp. 106–115, 2011. [107] N. Castin, M. I. Pascuet, and L. Malerba, “Mobility and stability of large vacancy and vacancy-copper clusters in iron - An atomistic kinetic Monte Carlo study,” Journal of Nuclear Materials, vol. 429, pp. 315–324, 2012. [108] C. M. Bishop, Neural networks for pattern recognition. Oxford: Oxford University Press, 1995. [109] N. Castin, L. Malerba, and R. Chaouadi, “Prediction of radiation induced hardening of reactor pressure vessel steels using artificial neural networks,” Journal of Nuclear Materials, vol. 408, pp. 30–39, 2011. [110] C. M. Bishop, “Neural networks and their applications,” Review of Scientific Instruments, vol. 65, p. 1803, 1994. [111] V. Jansson and L. Malerba, “Simulation of the nanostructure evolution under irradiation in Fe-C alloys,” Journal of Nuclear Materials, vol. 443, pp. 1–12, 2013. [112] N. Anento, N. Castin, A. Serra, and L. Malerba, “Assessment of stability and mobility of SIA and vacancy clusters in target ternary alloy,” Tech. Rep. D13.16, PERFORM 60 FP7 project (grant agreement no. FP7-232612), 2013. [113] P. Y. Serruys and G. Brebec, “Détermination des rapports de fréquences de saut de la facune par électromigration dans les alliages binaires cubiques centrés dilués,” Philosophical Magazine A, vol. 46, pp. 661–675, 1982. [114] Y. Okamura and A. R. Allnatt, “Calculations of phenomenological coefficients for matter transport by the matrix method of random walk theory,” Journal of Physics C: Solid State Physics, vol. 16, p. 1841, 1983.
BIBLIOGRAPHY
89
[115] S. Choudhury, L. Barnard, J. D. Tucker, T. R. Allen, B. D. Wirth, M. Asta, and D. Morgan, “Ab-initio based modeling of diffusion in dilute bcc Fe-Ni and Fe-Cr alloys and implications for radiation induced segregation,” Journal of Nuclear Materials, vol. 411, pp. 1–14, 2011. [116] P. Olsson, T. P. C. Klaver, and C. Domain, “Ab initio study of solute transition-metal interactions with point defects in bcc Fe,” Physical Review B, vol. 81, p. 054102, 2010. [117] C. S. Becquart and C. Domain, “Solute–point defect interactions in bcc systems: Focus on first principles modelling in W and RPV steels ,” Current Opinion in Solid State & Materials Science, vol. 16, pp. 115–125, 2012. [118] A. D. Le Claire and G. Neumann, “Impurity diffusion in iron group metals,” in Diffusion in Solid Metals and Alloys (H. Mehrer, ed.), pp. 1–10, Berlin: Springer-Verlag, 2001. [119] G. Neumann and C. Tuijn, “Self-diffusion and impurity diffusion in group VIII metals,” in Self-diffusion and impurity diffusion in pure metals: handbook of experimental data, Oxford: Elsevier, 2011. [120] A. Janotti, M. Krčmar, C. L. Fu, and R. C. Reed, “Solute Diffusion in Metals: Larger Atoms Can Move Faster,” Physical Review Letters, vol. 92, p. 085901, 2004. [121] F. Maury, P. Lucasson, A. Lucasson, F. Faudot, and J. Bigot, “A study of irradiated FeCr alloys: deviations from Matthiessen’s rule and interstitial migration,” Journal of Physics F - Metal Physics, vol. 17, pp. 1143–1165, 1987. [122] F. Maury, A. Lucasson, P. Lucasson, P. Moser, and F. Faudot, “Interstitial migration in irradiated iron and iron-based dilute alloys. II. Interstitial migration and solute transport in FeNi, FeMn and FeCu dilute alloys,” Journal of Physics: Condensed Matter, vol. 2, pp. 9291–9307, 1990. [123] H. Abe and E. Kuramoto, “Interaction of solutes with irradiation-induced defects of electron-irradiated dilute iron alloys,” Journal of Nuclear Materials, vol. 271, pp. 209–213, 1999. [124] J. P. Wharry and G. S. Was, “A systematic study of radiation-induced segregation in ferritic–martensitic alloys,” Journal of Nuclear Materials, vol. 442, pp. 7–16, 2013. [125] J. P. Wharry and G. S. Was, “The mechanism of radiation-induced segregation in ferritic–martensitic alloys,” Acta Materialia, vol. 65, pp. 42–55, 2014.
90
BIBLIOGRAPHY
[126] R. G. Faulkner, S. H. Song, P. E. J. Flewitt, M. Victoria, and P. Marmy, “Grain boundary segregation under neutron irradiation in dilute alloys,” Journal of Nuclear Materials, vol. 255, pp. 189–209, 1998. [127] G. Gupta, Z. Jiao, A. N. Ham, J. T. Busby, and G. S. Was, “Microstructural evolution of proton irradiated T91,” Journal of Nuclear Materials, vol. 351, pp. 162–173, 2006. [128] Z. Lu, R. G. Faulkner, N. Sakaguchi, and H. Kinoshita, “Effect of hafnium on radiation-induced inter-granular segregation in ferritic steel,” Journal of Nuclear Materials, vol. 351, pp. 155–161, 2006. [129] E. A. Marquis, S. Lozano-Perez, and V. De Castro, “Effects of heavy-ion irradiation on the grain boundary chemistry of an oxide-dispersion strengthened Fe–12wt.% Cr alloy,” Journal of Nuclear Materials, vol. 417, pp. 257–261, 2011. [130] E. A. Marquis, R. Hu, and T. Rousseau, “A systematic approach for the study of radiation-induced segregation/depletion at grain boundaries in steels,” Journal of Nuclear Materials, vol. 413, pp. 1–4, 2011. [131] Z. Chang, D. Terentyev, and N. Sandberg, “Anomalous bias factors of dislocations in bcc iron,” Journal of Nuclear Materials, vol. 461, pp. 221–229, 2015. [132] G. J. Ackland, D. J. Bacon, A. F. Calder, and T. Harry, “Computer simulation of point defect properties in dilute Fe-Cu alloy using a many-body interatomic potential,” Philosophical Magazine A, vol. 75, pp. 713–732, 1997. [133] O. I. Gorbatov, Theoretical investigation of copper precipitation in steel. PhD thesis, KTH Royal Institute of Technology, Stockholm, 2015. [134] M. Hernandez-Mayoral and D. Gómez-Briceño, “Transmission electron microscopy study on neutron irradiated pure iron and RPV model alloys,” Journal of Nuclear Materials, vol. 399, pp. 146–153, 2010. [135] J. Roudén and P. Efsing. Private communication, 2015. [136] M. Konstantinovic. Private communication, 2015. [137] G. Monnet, “Investigation of precipitation hardening by dislocation dynamics simulations,” Philosophical Magazine, vol. 86, pp. 5927–5941, 2006.