on Double Star TC1, Cluster, Polar, IMAGE, LANL geostationary satellites and ground-based ... may eventually evolve to enable disruption of the cross-tail current over a wide region of .... paradigm first comes from the auroral images from Viking,. POLAR, and .... measurement at the L1 position (http://omniweb.gsfc.nasa.
Click Here
JOURNAL OF GEOPHYSICAL RESEARCH, VOL. 113, A07S25, doi:10.1029/2007JA012761, 2008
for
Full Article
Multispacecraft and ground-based observations of substorm timing and activations: Two case studies X. Cao,1 Z. Y. Pu,1,2 H. Zhang,1 V. M. Mishin,3 Z. W. Ma,4 M. W. Dunlop,5 S. Y. Fu,1 L. Xie,1 C. J. Xiao,6 X. G. Wang,7 Q. G. Zong,8 Z. X. Liu,9 M. V. Kubyshkina,10 T. I. Pulkkinen,11 H. U. Frey,12 A. Korth,13 M. Fraenz,13 E. Lucek,14 C. M. Carr,14 H. Reme,15 I. Dandouras,15 A. N. Fazakerley,16 G. D. Reeves,17 R. Friedel,17 K. H. Glassmeier,18 and C. P. Escoubet19 Received 27 August 2007; revised 22 November 2007; accepted 14 December 2007; published 21 May 2008.
[1] Two case studies are performed to investigate substorm timing and activations based
on Double Star TC1, Cluster, Polar, IMAGE, LANL geostationary satellites and ground-based geomagnetic field measurements. In both events, an earthward flow associated with plasma sheet thinning is measured by Cluster 8–10 min ahead of the auroral breakup. A couple of minutes after the breakup, either TC1 at �X-10 RE first detects plasma sheet expansion and then the LANL satellites near the midnight measure energetic electron injections at geostationary orbit or the LANL satellites first measure the electron injections and then TC1 detects the plasma sheet expansion. More than about 20 min later, Cluster at X�16 RE and Polar (at higher latitude) successively observe plasma sheet expansion. The open magnetic flux of the polar cap, Y, is found to continually increase during the early substorm phase and then to rapidly fall when the IMF turns northward. When Y reaches its minimum value, bright and broad auroral activities start to decrease. Tailward progression of the magnetic dipolarization and a poleward expansion of auroral bulges are shown to closely map to one another. These results suggest that substorm activations start in the midtail before ground onset and then move earthward, which leads to an expansion onset in the near-Earth tail around X� -(8–9) RE. After onset, the activations progress both earthward and tailward. Substorm onset is possibly related to plasma sheet reconnection of close field lines, while tail lobe reconnection of open field lines release more energy to support the full expansion of the substorm. In a fully developed expansion phase, an initial dipolarization in the near-Earth may eventually evolve to enable disruption of the cross-tail current over a wide region of the magnetotail. Citation: Cao, X., et al. (2008), Multispacecraft and ground-based observations of substorm timing and activations: Two case studies, J. Geophys. Res., 113, A07S25, doi:10.1029/2007JA012761.
1. Introduction [2] During substorms a great amount of energy derived from the solar wind-magnetosphere interaction is stored in the magnetotail and then explosively released to the auroral ionosphere and inner magnetosphere. The sudden eruption 1
School of Earth and Space Science, Peking University, Beijing, China. Also at State Key Laboratory of Space Weather, CSSAR, CAS, Beijing, China. 3 Institute of Solar-Terrestrial Physics, Russian Academy of Sciences, Irkusk, Russia. 4 Institute of Fusion Theory and Simulation, School of Science, Zhejiang University, Hangzhou, China. 5 Space Science and Technology Department, RAL, Chilton, UK. 6 National Astronomical Observatories, CAS, Beijing, China. 7 School of Physics, Peking University, Beijing, China. 8 Center for Atmospheric Research, University of Massachusetts, Lowell, Massachusetts, USA. 2
Copyright 2008 by the American Geophysical Union. 0148-0227/08/2007JA012761$09.00
of energy at the expansion onset and the continuous energy dissipation in the substorm expansion phase manifest a fundamental mode of energy transport in geospace. Understanding substorm energy transport and the expansion onset mechanism is essential for solar terrestrial physics and space weather research [McPherron, 1979]. 9
State Key Laboratory of Space Weather, CSSAR, CAS, Beijing, China. Institute of Physics, University of St. Petersburg, Ulyanovskaya, Russia. 11 Finnish Meteorological Institute, Space Research, Helsinki, Finland. 12 Space Science Laboratory, University of California, Berkeley, California, USA. 13 Max Planck Institute for Solar System Research, Katlenburg-Lindau, Germany. 14 Blackett Laboratory, Imperial College London, London, UK. 15 Centre d’Etude Spatiale des Rayonnements, Toulouse, France. 16 Mullard Space Science Laboratory, University College London, Dorking, UK. 17 Los Alamos National Laboratory, Los Alamos, New Mexico, USA. 18 IGM, TU Braunschweig, Braunschweig, Germany. 19 ESA/ESTEC, Noordwijk, Netherlands. 10
A07S25
1 of 13
A07S25
CAO ET AL.: OBSERVATIONS OF SUBSTORM ACTIVATIONS
[3] Substorms consist of a chain of processes responsible for the release and dissipation of magnetic energy stored in the magnetotail. The three primary components of these causally related activations are (1) magnetic reconnection in the mid- or near-Earth magnetotail that result in earthward/ tailward plasma flows with speeds comparable to the local Alfve´n velocity [McPherron, 1979; Baker et al., 1996]; (2) cross-tail current disruption (CD) which leads to the diversion of current into the ionosphere and a dipolarization of the magnetic field in the inner magnetotail [McPherron et al., 1973; Lui et al., 1988; Lui, 1996], and (3) auroral breakup in the auroral ionosphere, followed by rapid (mostly poleward) motion and expansion of the auroral bulge [Akasofu and Chapman, 1962; Rostoker et al., 1987; Nakamura et al., 1993]. Despite vast numbers of groundbased and spacecraft measurements and a number of theoretical studies in the last 40 years, the chronological relationship between these phenomena remains a controversial question [Fairfield, 1992]. [4] Although a number of substorm paradigms exist, two of them epitomize the main ideas and reveal the primary observational requirements. These are the ‘‘near-Earth current disruption’’ (NECD) and the ‘‘near-Earth neutral line’’ (NENL) paradigms [Angelopoulos et al., 2002]. According to the NECD paradigm: (1) the inner magnetotail (�8 – 10 RE) is the source region of free energy and is where the cross-tail current density reaches peaks prior to the expansion phase [Kaufmann, 1987; Ohtani et al., 1992]. (2) Instabilities local in this region lead to current disruption (CD) and the formation of the substorm current wedge (SCW), thus triggering the expansion onset. (3) After onset, depolarization of the magnetic field propagates tailward, initiating magnetic reconnection and bursty bulk flows (BBFs). (4) Flows cause neither the CD nor the auroral breakup [Lui, 1991; Lyons, 2000]. On the other hand, the updated NENL paradigm [Baumjohann, 2002] suggests the following: (1) the BBFs originate from reconnection in the midtail, transport energy into the inner tail, and typically are stopped outside the inner region at �13–15 RE [Shiokawa et al., 1997]. (2) Magnetic flux then piles up against this boundary, ultimately leading to a more dipolar tail configuration, and hence, to the substorm dipolarization [Shiokawa et al., 1998]. (3) The pressure gradient built up by the flow braking causes a reduction and diversion of the duskward, cross-tail current, to form the SCW [Birn et al., 1999]. In addition to the NENL and NECD paradigms, a synthesis scenario of reconnection and CD has also been proposed [Pu et al., 1999, 2001; Zhang et al., 2007], suggesting that flow braking might yield favorable conditions for instabilities to grow near the inner edge of the plasma sheet, eventually leading to dipolarization at substorm onset. [5] Observational evidence in support of the NECD paradigm first comes from the auroral images from Viking, POLAR, and ground-based photometers [Elphinstone et al., 1995; Frank and Sigwarth, 2000; Lyons and Samson, 1992]. The breakup arcs seem to map equatorward of open field lines close to the Earth [Angelopoulos et al., 2002]. The Charge Composition Explorer (CCE) in the near-Earth current sheet obtained distinct signatures of CD at expansion onset: a highly fluctuated magnetic field and its complex geometry, magnetic field dipolarization and related crosstail current reduction, and localized particle energization
A07S25
[Lui, 1996]. Tailward progression of CD after expansion onset has been clearly seen by Jacquey et al. [1991, 1993], Perraut et al. [2003], and recently by Lui et al. [2006], in agreement with the NECD prediction. In addition, Liou et al. [2002] conducted extensive systematic studies of several substorm onsets and found the results favor the NECD scenario. On the other hand, Geotail measurements of a number of substorms have shown that midtail reconnection occurs mostly at XGSM�-(20 – 30) RE and precedes the ground onset time on a timescale of �10 min [Nagai et al., 1998]. Cao et al. [2006] show by a statistical study of data from three Cluster satellites that more than 95% of substorms are accompanied by BBFs and hence BBFs may contribute more to the transport of magnetic flux, mass, and energy than what was estimated by previous studies based on single satellite measurements. Miyashita et al. [2000] conducted a statistical study of the timing of plasma flow onset with expansion onset to show that plasma flows in the midtail occurred prior to expansion onset. Furthermore, Baker et al. [2002] reported a case study of a substorm with Cluster, IMAGE, and geostationary satellites. They illustrated the fact that magnetic reconnection seen by the Cluster spacecraft started about 7 min before the corresponding ground signature of substorm expansion onset. Zong et al. [2004, 2007] found an intense substorm event in which Cluster observed an earthward moving BBF/ plasmoid 14 min ahead of the first injection in the geostationary orbit. Ohtani et al. [1999] have also shown a similar result with a case study of Geotail, geostationary, and ground-based data. Apparently, these observations favor the NENL paradigm. Therefore, there are observational supports for both paradigms, based on existing in situ and ground-based measurements [Lui, 2004]. The controversy between the two paradigms remains unsettled. [6] The most critical issue for distinguishing between the two competing substorm paradigms is to conduct accurate timing of tail reconnection onset with respect to onsets of near-Earth substorm activities. In order to do so, one requires in situ particle and field observations from multispacecraft in the middle and inner magnetotail, in conjunction with simultaneous and ground-based auroral and magnetometer measurements. There have been such attempts in the previous studies [e.g., Ohtani et al., 1999; Baker et al., 2002; Perraut et al., 2003]. Nevertheless, the timing of activity onset for differentiating the paradigms turns out to be difficult because the timing difference is small [Lui, 2004] and usually the spacecraft are not in appropriate positions. From July to October the apogees of Cluster and Double Star TC1 are both in the magnetotail at �20 RE and �13 RE from the Earth, respectively, allowing the middle and near-Earth tail substorm activities to be monitored. We have taken advantage of this conjunction to make a statistical study during substorms of plasma sheet expansion and magnetic field compression, associated with flux pileup [Zhang et al., 2007]. In this paper we use TC1, Cluster, Polar, IMAGE, geostationary satellites, and groundbased Pi2 measurements to perform two case studies of various substorm activations, with attention to determining a possible time sequence among these phenomena. [7] The paper is organized as follows. In section 2 we briefly describe the data used in the study and the relevant instruments on board Cluster and TC-1. In section 3 we
2 of 13
CAO ET AL.: OBSERVATIONS OF SUBSTORM ACTIVATIONS
A07S25
A07S25
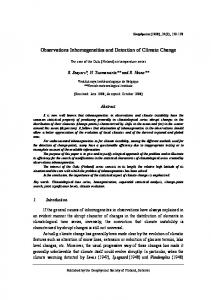
Figure 1. Spacecraft locations and the plasma sheet configuration for the substorm on 14 September 2004 at �1825 UT obtained from the mapping approach of Kubyshkina et al. [1999, 2002] and Ganushkina et al. [2004] with the TC1 and Cluster data. present coordinated observations of two typical substorms. In section 4 we discuss in detail the phenomena observed and the possible underlying physics. Section 5 is a brief summary.
2. Data and Instrumentation [8] In this paper, data from magnetic field, thermal ion, and electron experiments on board Double Star TC1 and Cluster are used. The TC1 spacecraft was launched in December 2003 into an equatorial orbit at 28.2° inclination, with an apogee of 13.4 RE and a perigee of 570 km [Liu et al., 2005]. Our study was facilitated by common instrumentation on the two missions. The four Cluster and TC1 all carried a Fluxgate Magnetometer (FGM) [Balogh et al., 2001; Carr et al., 2005], a Hot Ion Analyzer (HIA) (except Cluster 2) [Reme et al., 2001, 2005], and the Plasma Electron and Current Experiment (PEACE) [Johnstone et al., 1997; Fazakerley et al., 2005]. The FGM instrument measures the magnetic field vector at high time resolution; the HIA instrument provides a full three-dimensional energy/velocity distribution of ions (protons) from thermal energies up to about 32 keV/q and moments with a time resolution up to 4 s, and the PEACE instrument offers electron number density, temperature, and velocity distribution every 4 s in the energy range from 0.7 eV to �30 keV. We also use the magnetic field data measured by Polar, auroral data from IMAGE, energetic particle data from the Synchronous Orbit Particle Analyzer (SOPA) on board LANL satellites, as well as Pi2 and H-component geomagnetic field data obtained by the ground-based station around middle magnetic latitude (http://swdcwww.kugi.kyoto-u.ac.jp).
3. Observations 3.1. Substorm on 14 September 2004 [9] On 14 September 2004, a substorm auroral breakup started at �1822 – 1824 UT. Around this time TC1, Cluster, and Polar were located at (�10.2, �1.9, 0.6) RE, (�16.4, 0.8, 2.6) R E, and (�7.5, 3.5, �4.0) R E in the GSE coordinates, respectively. Figure 1 shows the spacecraft locations and the plasma sheet configuration at �1825 UT obtained from the mapping approach of Kubyshkina et al. [1999, 2002] and Ganushkina et al. [2004] with TC1 and Cluster data. During the early expansion phase of the substorm, the cross-tail current sheet appeared to be thin
and the tail magnetic field stretched out down-tail. Note that TC1 was located in the premidnight sector in the near-Earth tail, Cluster was postmidnight near the northern plasma sheet boundary layer, and Polar was in the southern hemisphere at higher latitudes. [10] Figure 2 gives an overview of the event in the GSE coordinate system. showing from top to bottom: the magnetic field observed by Polar (Bx in black, By in green, and Bz in red); the magnetic field, number density, and the X-component of the thermal ion bulk velocity observed by Cluster spacecraft 4; the Bz component of the interplanetary magnetic field (IMF) at 1 AU shifted from the ACE measurement at the L1 position (http://omniweb.gsfc.nasa. gov/html/HROdocum.html#3); the magnetic field and thermal ion bulk velocity (Vx in black, Vy in green, and Vz in red) measured by TC1, and the open magnetic field flux in the polar cap Y obtained with the magnetogram inversion technique by Mishin [1990]. Note that the vertical dashed line in Figure 2 marks the auroral breakup at �1822 UT. Figure 3a shows the auroral brightening observed by IMAGE/WIC that began at about 1822 UT. Figures 3b and 3c show the Pi2 pulsation of D- and H-component in the period range of 40– 150 s and the geomagnetic H-component observed at the Urumqi station in the northwest China (48° MLAT), respectively. The midlatitude Pi2 begins at �1823 UT, almost at the same time as the auroral breakup. A positive H excursion, which is usually seen in the midlatitude and low-latitude magnetogram, associated with substorms, also starts at �1823 UT. Figure 4 presents the energetic electron measurements at the geostationary orbit by LANL-02A in the premidnight sector at �23 MLT and 97A at �0430 MLT. In addition, the AE index increases from 474 nT to 595 nT during a short period of 1827 – 1833 UT and arrives at a peak of 1153 nT at �1850 UT (not shown here, see http://swdcwww.kugi.kyoto-u.ac.jp/aedir/). [11] From the auroral breakup shown in Figure 3a, we infer that the expansion phase of the substorm on 14 September starts at �1822 UT, which is further confirmed by the appearance of midlatitude Pi2 observed at �1823 (Figure 3b). Cluster 4 observed an earthward flow with a peak of Vx�400 km/s at �1812 UT at X�-16.4 RE, �10 min ahead of the expansion onset, when the IMF Bz at 1 AU was negative and the open magnetic flux Y was increasing. Meanwhile, about 3 –4 min after the onset, TC1 observed a dipolarization-associated plasma sheet expansion at 1825 – 1826 UT, characterized by a sudden drop of the Bx
3 of 13
A07S25
CAO ET AL.: OBSERVATIONS OF SUBSTORM ACTIVATIONS
Figure 2. Overview of the 14 September 2004 event in the GSE coordinate system. From top to bottom are shown the magnetic field measured by Polar (Bx in black, By in green, and Bz in red); the magnetic field measured by Cluster spacecraft 4 (Bx in black, By in green, and Bz in red), number density measured by Cluster 4; the X-component of the thermal ion bulk velocity measured by Cluster 4; the Bz component of the interplanetary magnetic field at 1 AU shifted from the ACE measurement at the L1 position; the magnetic field measured by Double Star TC1 (Bx in black, By in green, and Bz in red); the magnetic field measured by Cluster spacecraft 4 (Bx in black, By in green, and Bz in red); the thermal ion bulk velocity measured by Double Star TC1 (Vx in black, Vy in green, and Vz in red); the open magnetic field flux in the polar cap obtained with the magnetogram inversion technique MIT-2 [Mishin, 1990]. 4 of 13
A07S25
A07S25
CAO ET AL.: OBSERVATIONS OF SUBSTORM ACTIVATIONS
A07S25
Figure 3. (a) Auroral breakup of the substorm on 14 September 2004 at 1822 observed by IMAGE/ WIC; left: 1822:36 UT; right: 1824:41. (b) Pi2 pulsation (D- and H- component) during the substorm on 14 September 2004 observed at the Urumqi station in the northwest China (48° MLAT). (c) The geomagnetic H-component observed at the Urumqi station. component and a simultaneous jump of Bz, as well as a reversal of By. In addition, a few minutes later at �1830 UT, LANL-02A measures energetic electron injection at the geostationary orbit near midnight. Furthermore, �28 min after the auroral breakup, Cluster 4 saw the plasma sheet expansion with the same features occurring about 20 min earlier at the TC1 position. Finally, about 5 min later than this expansion, at 1855 UT, Polar observed a similar plasma
sheet expansion. Correspondingly, a rapid decrease of Y begins at �1830 UT and reaches its minimum at �1855 UT, while auroral activities start to weaken around 1855 (not shown here). 3.2. Substorm on 17 September 2004 [12] Another substorm auroral brightening started at �0115 UT on 17 September 2004, when TC-1, Cluster,
5 of 13
A07S25
CAO ET AL.: OBSERVATIONS OF SUBSTORM ACTIVATIONS
A07S25
Figure 4. Energetic electron injection for the substorm on 14 September 2004 measured by the geostationary spacecraft (top) LANL-02A at �23 MLT and (bottom) LANL-97A at �04:30 MLT. From top to the bottom in both two panels are shown the differential counting rate (counts s�1 cm�2 sr�1 keV�1) of energetic electrons for the energy range of 50– 75 keV, 75– 105 keV, 105– 150 keV, 150 – 225 keV, 225– 315 keV, 315– 500 keV, 500 –750 keV, 0.75 – 1.1 MeV, 1.1– 1.5 MeV, and >1.5 MeV. and Polar were located at (�10.3, �1.6, 0.6) RE, (�15.1, 0.7, 3.7) RE and (�7.5, 4.0, �4.1) RE in the GSE coordinates, respectively. Although an analysis of this event has been previously published, we briefly summarize those observations and add additional data here in order to provide a context for comparison of the two events. Zhang et al. [2007] presented detailed descriptions and discussions of the event. About 8 min ahead of the auroral breakup at �0107 UT, Cluster observed an earthward ion bulk flow with a peak of �300 km/s at X�-15.1 RE. This flow lasted for about 13 min when the IMF Bz at 1 AU was negative.
Almost at the same time as the auroral breakup, TC1 observed a beginning of magnetic field compression, which is expected to be associated with magnetic flux pileup caused by a braking of the earthward flow [Zhang et al., 2007]. Meanwhile, quite close to the auroral breakup, LANL-1990 – 095 at �23 MLT and 01A at �1.5 MLT measured energetic electron injections at the geostationary orbit at 0116 and 0117 UT, respectively (see Figure 5). Twelve minutes later than the breakup, TC1 observed plasma sheet expansion at �0127 UT with a rapid drop of Bx, a simultaneous jump of Bz, and a noticeable reversal of By
Figure 5. Energetic electron injection for the substorm on 17 September 2004 measured by the geostationary spacecraft (top) LANL-01A at �01:30 MLT and (bottom) LANL-1990 – 095 at �23 MLT. From top to the bottom in both two panels are shown the differential counting rate (counts s�1 cm�2 sr�1 keV�1) of energetic electrons for the energy range of 50– 75 keV, 75– 105 keV, 105– 150 keV, 150 – 225 keV, 225– 315 keV, 315– 500 keV, 500 –750 keV, 0.75 – 1.1 MeV, 1.1– 1.5 MeV, and >1.5 MeV. 6 of 13
CAO ET AL.: OBSERVATIONS OF SUBSTORM ACTIVATIONS
A07S25
A07S25
Figure 6. Plasma sheet expansion in substorm on 17 September 2004 observed by TC1 and Polar. (top) Magnetic field measured by Double Star TC1 (Bx in black, By in green, and Bz in red); (bottom) magnetic field measured by Polar (Bx in black, By in green, and Bz in red). [Zhang et al., 2007]. Furthermore, about 23 min after the auroral breakup, Polar observed the plasma sheet expansion with signatures similar to those seen by TC1 (Figure 6 (top) shows TC1 and Figure 6 (bottom) shows Polar). The Cluster satellites were not at suitable positions and did not detect notable signals of plasma sheet expansion. More details about this event can be found in the work of Zhang et al. [2007].
4. Discussions [13] We have presented multispacecraft observations of substorms on 14 September 2004 and 17 September 2004 by TC1, Cluster, Polar, Image, and geostationary orbit satellites, together with ground-based Pi2 measurements collected for the 14 September event only. These coordinated measurements provide a wealth of information regarding the time sequence of various substorm activities and the underlying physics. The characteristic features of the two events are similar and the following discussion will focus only on the substorm of 14 September 2004. 4.1. Plasma Flow Related to Plasma Sheet Thinning Ahead of the Expansion Onset [14] About 10 min ahead of the expansion onset of the 14 September substorm, Cluster 4 observed an earthward flow at X�-16.4 RE with a peak of Vx �400 km/s. The flow lasts for about 15 min and disappears at �1820, just 2 min before the expansion onset. Similar phenomena have often been observed by Cluster [e.g., Baker et al., 2002; Nakamura et al., 2002, 2004b; Pu et al., 2006]. The second and fourth panels of Figure 2 show that the flow is clearly related to plasma sheet thinning, since the spacecraft has rapidly moved into the lobe. Nakamura et al. [2002, 2004b] suggest that this type of flows is possibly related to the reconnection process. Pu et al. [2006] have further shown that if there was also a satellite situated in the central plasma sheet, it would observe an earthward flow, simultaneously with a prominent velocity component perpendicular to the magnetic field. [15] Unfortunately, in the 14 September event, TC1 did not observe the direct effects of the flow, probably in view of its unfavorable azimuthal position. The full width of the BBF channel is between 2 and 3 RE in the dawn-dusk direction, on average [Nakamura et al., 2004a], while
the GSE Y-coordinates of Cluster 4 and TC1 are 0.8 RE and �1.9 RE, respectively. This range may be too narrow for the flow channel to encounter both Cluster and TC1. Nevertheless, Zhang et al. [2007] have shown that in a number of substorms TC1 does observe magnetic field compression in the inner tail associated with magnetic flux pileup by breaking of earthward flows. In the 14 September substorm, the flow observed by Cluster would arrive at X�-10 RE in 3 – 4 min, about 6 –7 min prior to the auroral breakup. It is thus likely that the substorm expansion onset is triggered neither directly by the flow itself nor by the braking of the flow. One possibility would be that the flow braking needs some time to create favorable conditions for the onset of the expansion phase [Nakamura et al., 2006; Zhang et al., 2007], as the synthesis scenario of reconnection and CD has suggested [Pu et al., 1999, 2001]. 4.2. Polar Cap Open Magnetic Flux Y and Magnetic Reconnection in the Tail [16] The seventh panel of Figure 2 illustrates that during the early phase of substorms, the open magnetic flux of the polar cap, Y, continues to increase. A rapid decrease of Y begins at �1830 UT and reaches the minimum at �1855 UT. In the present study, Y is calculated with the magnetogram inversion technique MIT-2 [Mishin, 1990; Kamide and Baumjohann, 1993],where a number of ground-based magnetometer data from geomagnetic latitudes �50° are input and the 2-D model of the ionospheric conductance of Mishin et al. [1986] is used. [17] Interestingly, it is seen from Figure 2 that the earthward flow in the event was observed when the IMF Bz at 1 AU remained negative, and Y was increasing. It has been recognized that in many substorm events, midtail reconnection develops in two steps: first, plasma sheet reconnection of closed field lines (PSR) and second, tail lobe reconnection of open field lines (TLR). In accordance, the overall substorm phenomena occur in two distinct ways associated with the different topologies of reconnection [Baker et al., 2002; Mishin et al., 1997, 2001; Pu et al., 2006]. During the period of PSR, if reconnection at the dayside magnetopause continues and transports more flux to the magnetotail than that distant reconnection releases, Y will keep increasing. After the IMF northward turning
7 of 13
A07S25
CAO ET AL.: OBSERVATIONS OF SUBSTORM ACTIVATIONS
A07S25
Figure 7. (a) Pi2 fluctuations in substorm on 14 September 2004 measured by (top) TC1, (middle) Cluster, and (bottom) Polar. (b) The successive imaging of poleward boundary intensifications (PBIs) at 1751, 1753, 1755, and 1757 observed by IMAGE/WIC. occurs, both dayside and distant magnetotail reconnection cease. There will be no flux transported from the distant tail to support PSR, The magnetic field and plasma in the lobes must involve in midtail reconnection [Russell, 2000], TLR then develops and hence Y dramatically decreases [Pu et al., 2006]. It can therefore be postulated from the fourth and bottom panels of Figure 2 that the earthward flow seen by Cluster is likely to be related to the PSR tailward of Cluster, as discussed previously, and that after �1830 UT TLR transports more energy to support the full development of the substorm. This conjecture is consistent with the observation that the auroral bulge’s remaining brighter and broader after the initial poleward expansion, for more than 20 min until 1855 UT (not shown here). The conjecture is also in accordance with the fact that the AE index increases from 474 nT to 595 nT during a short period of 1827 – 1833 UT and arrives at a peak of 1153 nT at �1850 UT. We will address in a future paper the fascinating issue regarding the two types of tail reconnection (PSR and TLR) and the
related two types of substorm onset (the initial onset and major onset). 4.3. Poleward Boundary Intensifications in the Growth Phase [18] Figure 7 illustrates another interesting feature of the event related to possible tail reconnection during the substorm growth phase. Figure 7a shows that TC1 (top), Cluster 4 (middle), and Polar (bottom) all measured Pi2 fluctuations. These fluctuations appeared much earlier than the detection of the plasma sheet expansion and reached a maximum right at the plasma sheet expansion time. Furthermore, while Cluster sees Pi2, IMAGE/WIC observes poleward boundary intensifications (PBIs), which last for 22 min, from 1746 UT until 1808 UT. Figure 7b shows the successive imaging of PBIs at 1751, 1753, 1755, and 1757 UT. These PBIs are nightside geomagnetic disturbances that have auroral signatures which move equatorward from the poleward boundary of the auroral zone [Henderson
8 of 13
A07S25
CAO ET AL.: OBSERVATIONS OF SUBSTORM ACTIVATIONS
et al., 1998; Sergeev et al., 1999]. They occur under all geomagnetic conditions, both in the presence and absence of substorms. In a number of events, Lyons et al. [1999] found that each series of PBIs are associated with series of ground Pi2 pulsations. It has also been suggested that some PBIs are associated with magnetic reconnection in the magnetotail [Lam et al., 2004]. We then expect that during the PBIs observed by IMAGE, distant reconnection is proceeding with electron precipitation at the poleward border of the auroral region. There is a 14 min gap from 1808 to 1822 UT, during which no active auroral activities are seen. The relationship between PBIs and auroral brightening in this event remains unclear. 4.4. Characteristic Features of Plasma Sheet Expansion [19] TC1, Cluster, and Polar successively observe plasma sheet expansion with similar features: a sudden decrease of Bx, a simultaneous jump of Bz, and a reversal of By. These changes happen after substorm dipolarization when the tailward progression of the plasma sheet expansion arrives at the satellite positions. Readers are referred to Zhang et al. [2007] for detailed discussions of these basic features. [20] The seventh panel of Figure 2 illustrates an additional feature of the plasma sheet expansion: the earthward component of thermal ion velocity (Vx) shows a rapid jump from almost zero to greater than 400 km/s, which lasts for about 3 min. Cluster 4 also later sees a jump of Vx with a shorter lifetime. This type of short-lived earthward flow is commonly seen when plasma sheet expansion is detected [Zhang et al., 2007; Shiokawa et al., 2005] and is believed to be associated with the inductive electric field at substorm expansion [Birn and Hesse, 1998]. Note that these expansionrelated fast flows should be distinguished from those observed prior to expansion onsets. On the basis of detailed analyses of Cluster plasma and magnetic field data, Nakamura et al. [2004b] report that there are two types of fast flows in the plasma sheet: those related to dipolarization, and those associated with current-sheet thinning. The first type of flow is accompanied by a sharp enhancement in Bz, indicating a thickening of the plasma sheet and dipolarization fronts, similar to the short-lived earthward flows shown in Figure 2. The second type of flow is possibly related to the reconnection process [Nakamura et al., 2002], similar to the fast flow measured by Cluster, and which is �10 min ahead of the auroral breakup in the 14 September substorm. The timing of these two types of fast flows with respect to substorm onsets is different. It is therefore essential to make a distinction between these two types of flows when studying the relationship between fast flows and substorms. [21] Another feature of plasma sheet expansion can be found in Figure 8, in which temperatures of both thermal ions and electrons show a sharp jump (for both TC1 and Cluster). This phenomenon is also commonly seen in many substorm events [Zhang et al., 2007]. This particle energization process is characterized by a higher increase in T// than T?. It has been known that during magnetic field dipolarization, the westward inductive electric field intensely drives ions and magnetic flux earthward to generate the so-called ‘‘convection surge’’ [Quinn and Southwood, 1982], which leads to a sudden earthward displacement of curved field lines [Quinn and Southwood, 1982; Mauk,
A07S25
1986]. Delcourt et al. [1990] and Delcourt and Sauvaud [1994] show that during the course of this process, the large but short-lived electric field yields an intense acceleration of the particles in the direction parallel to the magnetic field, Korth and Pu [2001] further suggest that when magnetic field dipolarizes, the centrifugal mechanism will play an important role in accelerating particles in the parallel direction. Obviously, our observation in Figure 8 can be well explained by these mechanisms, indicating that the convection surge mechanism continues to work after the expansion onset. 4.5. Tailward Progression of Dipolarization and Substorm Paradigms [22] TC1, Cluster, and Polar’s successive observation of plasma sheet expansion strongly indicates that the current disruption region expands tailward after the expansion onset, as the NECD scenario suggested [Jacquey et al., 1991, 1993; Perraut et al., 2003]. However, the tailward progression of dipolarization at multiple activity sites is also a shared feature of the NECD and NENL paradigms [Lui, 2004; Baumjohann et al., 1999]. In the NECD paradigm, CD initiates a tailward propagating rarefaction wave that triggers reconnection and BBFs as the wave reaches the midtail [Chao et al., 1977; Lui, 1991]. In the NENL paradigm, on the other hand, it is suggested that once the tailward moving dipolarization front arrives at the reconnection site, the near-Earth neutral line disappears [Baumjohann et al., 1999]. Baumjohann et al. consider this feature the classical signature of the beginning of the recovery phase. In this study we are not able to make a detailed test of these two hypotheses with our obtained data. [23] Nevertheless, a few points can still be seen: [24] 1. The rapid drop of polar cap open-flux, Y, can be taken as an indicator of the development of TLR [Cao et al., 2005; Pu et al., 2006; Zhang et al., 2006]. In this event, Y starts to drop at �1830 UT, suggesting that TLR occurs a few minutes later than the expansion onset. The fifth and eighth panels of Figure 2 show that the rapid dissipation of Y seems to be related to the northward turning of the IMF, which is consistent with the model by Russell [2000]. It is of interest to note that after �1830 UT, the auroral bulge apparently expands and the excursion of the geomagnetic field H grows rapidly. It has been known that PSR itself can lead to expansion onset [Baumjohann, 2002]. Thus it is likely that TLR in the 14 September 2004 substorm releases more energy to support the further development of the expansion phase. [25] 2. Although Cluster observes a reversal of Vx at the time of plasma sheet expansion, the Vx reversal is not accompanied with a reversal of Bz. Therefore, it cannot be regarded as the signature of a reconnection site crossing. No signatures have been seen to suggest that tailward progression of the dipolarization initiates magnetic reconnection and bursty bulk flows in the midtail. [26] 3. Y reaches its minimum at � 1855 UT (bottom panel of Figure 2). One might refer to this minimum as an indication of the end of TLR and therefore the start of the recovery phase [Baumjohann et al., 1999]. This view certainly does not contradict the fact that the bright and broad auroral activities start to decease just around 1855 UT in this event (not shown here).
9 of 13
A07S25
CAO ET AL.: OBSERVATIONS OF SUBSTORM ACTIVATIONS
A07S25
Figure 8. Temperature of thermal ions and electrons for the substorm on 14 September 2004. The first panel shows ion temperature measured by TC1 with T// in black and T? in green, respectively; the second panel shows electron temperature measured by TC1 with T// in black and T? in green, respectively; the third panel shows ion temperature measured by Cluster 3 with T// in black and T? in green, respectively; and the bottom panel shows electron temperature measured by Cluster 3 with T// in black and T? in green, respectively. 4.6. Tailward Progression Speed of the Plasma Sheet Expansion [27] By applying multipoint analysis techniques on Cluster and TC1 measurements, Nakamura et al. [2005] find that the dipolarization-related disturbances propagate tailward with a speed of 60– 190 km/s, which is within the limits of the previously obtained tailward propagation speeds of 35– 300 km/s [Ohtani et al., 1992; Jacquey et al., 1993; Baumjohann et al., 1999]. In the present study, by mapping along the straight line tangential to the field line at the TC1 and Cluster locations to the equator, we roughly estimate that the equatorial distance between TC1 and Cluster in the 14 September 2004 event is �29.4 RE and then obtain the tailward progression speed of the plasma sheet expansion to be �82 km/s and the source region of the dipolarization to be at X �-8.5 RE. Since LANL-02A measures energetic electron injection at the geostationary orbit near the midnight later at �1830 UT, which is 7 – 8 min
later than the auroral breakup, the earthward propagation speed of substorm injection can then be found to be �25 km/s. This is close to the value of �24 km/s obtained by Reeves et al. [1996], based on a statistical study of CRRES and LANL geosynchronous energetic particle data. 4.7. Close Relationship Between the Poleward Advance of the Auroral Bulge and the Tailward Progression of Dipolarization [28] The tailward progression of current disruption would lead to the development of the substorm current system’s appearing in the ionosphere at progressively higher latitudes and hence is believed to correspond to the poleward expansion of the auroral bulge in the ionosphere [Lui, 2004]. Liou et al. [2002] investigated the characteristics of dipolarization at geosynchronous altitude in terms of relative timing and location relative to auroral breakup. On the basis of the T89 magnetic field model [Tsyganenko, 1989], they have shown that the substorm auroral bulges in the
10 of 13
CAO ET AL.: OBSERVATIONS OF SUBSTORM ACTIVATIONS
A07S25
A07S25
Figure 9. Auroral images from IMAGE/WIC at (left) �1824:41 UT, (middle) 1851:37 UT, and (right) �1855:46 UT in 14 September 2004 substorm. The foot points of TC1 (black), Cluster (blue), and Polar (pink) are positioned in the plots for comparison.
ionosphere, and the dipolarization region in the magnetosphere, map closely together. By using the mapping approach of Kubyshkina et al. [1999, 2002] and Ganushkina et al. [2004], we have made a calculation of the ionospheric foot point locations for TC1, Cluster, and Polar, based on the magnetic field measurements at the time the spacecraft observed the tailward progression of the current disruption. Our approach includes a possibility to change the amplitude of the basic T96 currents [Tsyganenko and Stern, 1996] using the tuning coefficients, which are obtained in order to minimize the difference between the model values and the spacecraft data. Figure 9 illustrates a sequence of nightside, auroral images from IMAGE/WIC at �1824:41 (left), 1851:37 (middle), and �1855:46 (right). The footprints of TC1, Cluster, and Polar are positioned in the plots for comparison. We can see that while the dipolarization front moves tailward after substorm onset, the auroral bulge is synchronously expanding and shifting poleward and the foot points of TC1 (at 1825), Cluster (at 1850), and Polar (at 1855) lie quite close to poleward boundary of the auroral bulge. This finding reveals a close relationship between the poleward advance of the auroral bulge in the ionosphere and the tailward progression of SCW. We can envisage that an initial dipolarization in the near-Earth region may eventually evolve to enable disruption of the cross-tail current down to the midtail region. This would eventually lead to a fully developed expansion phase [Lui, 2004].
5. Summary [29] We have used TC1, Cluster, Polar, IMAGE, geostationary satellites, and ground-based geomagnetic field measurements to make two case studies of various substorm activations, paying attention to a possible time sequence among these phenomena. [30] The major results for the two events are similar and can be summarized as follows: [31] 1. In both events an earthward flow associated with plasma sheet thinning is measured by Cluster 8– 10 min ahead of the auroral breakup. Prior to the breakup, TC1 does (17 September event) or does not (14 September event) observe magnetic field compression (pileup), which is probably caused by the braking of the incoming earthward
flow. A couple of minutes after the breakup, either TC1 first detects plasma sheet expansion and subsequently, the LANL geostationary satellites near midnight measure energetic electron injections (14 September event), or first they measure electron injections and then TC1 detected plasma sheet expansion (17 September event). About 20 min (or more) later, Cluster and Polar successively observe plasma sheet expansion. [32] 2. During the early phase of substorms, the open magnetic flux of the polar cap, Y, continues to increase, indicating that plasma sheet reconnection of closed field lines is probably proceeding. The rapid dissipation of Y is likely to be related to the northward turning of the IMF. When Y reaches its minimum, the bright and broad auroral activities start to decrease. [33] 3. Plasma sheet expansion is characterized by a sudden decrease of Bx, a simultaneous jump of Bz, and a reversal of By. In addition, temperatures of thermal ions and electrons both show a sharp jump with a higher increase in T// than T?. The convection surge mechanism may continue to work after the expansion onset. A common feature is that of a short-lived earthward flow, believed to be produced by inductive electric field at the expansion, and is thus distinguishable from the flows ahead of onsets, that are thought to be related to the reconnection process. [34] 4. Substorm expansion onset begins in the near-Earth tail around X� -(8 –9) RE. Substorm activations start in the midtail before onset, then approach earthward. After onset, they progress both earthward and tailward. The speed of the tailward progression of plasma sheet expansion is �82 km/s, while the speed of the earthward propagation of the substorm injection is found to be �25 km/s. [35] 5. Poleward expansion of auroral bulges and tailward progression of the dipolarization are shown to closely map to one another. An initial dipolarization in the near-Earth may eventually evolve to enable disruption of cross-tail current over a wide range of the magnetotail, leading to a fully developed expansion phase. [36] A detailed test of the NECD and NENL paradigms cannot be achieved in the present work. Further study of the mechanism that triggers expansion onset in the nearEarth tail is therefore desirable. To achieve this, more plasma and field data from multiple spacecraft aligned in
11 of 13
A07S25
CAO ET AL.: OBSERVATIONS OF SUBSTORM ACTIVATIONS
the magnetotail, together with accurate auroral imaging from both in situ and ground-based measurements, are required. [37] Acknowledgments. This work is supported by the NSFC grants (40731056, 40390152, 40536030, 40425004, 40528005, and 40374061), Chinese Key Research Project (grant 2006CB806305) and the Major Discipline Foundation of Beijing, as well as the Chinese Double StarCluster Science Team. This study was also born partly from an ISSI working group on ‘‘Comparative Cluster-Double Star measurements in the magnetotail.’’ The authors acknowledge CNSA and ESA for the successful Double Star Mission, PPARC for supporting the operations of the FGM instruments, and ACE/MAG team for IMF data,as well as World Data Center for Geomagnetism, Kyoto for Pi2 and H component geomagnetic field data. We are grateful to A. Viljanen, J. Posch, T. Iyemori, K. Yumoto, O. Troshichev, E. Kharin, S. Khomutov, O. Kusonskie, Vinnitskiy, J. Watermann, S.I. Solov’ev and PIs of the projects INTERMAGNET, CANOPUS, and GIMA for providing the geomagnetic data to calculate the open magnetic flux of the polar cap Y. We also appreciate the useful discussions with J.B. Cao, R. L. McPherron, and A. T. Y. Lui. [38] Amitava Bhattacharjee thanks Donald Mitchell and another reviewer for their assistance in evaluating this paper.
References Akasofu, S.-I., and S. Chapman (1962), Large-scale auroral motions and polar magnetic disturbances-III. The aurora and magnetic storm of 11 February 1958, J. Atmos. Terr. Phys., 24, 785 – 796, doi:10.1016/00219169(62)90199-X. Angelopoulos, V., et al. (2002), Time History of Events and Macroscale Interaction During Substorms (THEMIS) medium-class explorer mission phase A concept study report, NASA, Washington, D. C. Baker, D. N., T. I. Pulkkinen, V. Angelopoulos, W. Baumjohann, and R. L. McPherron (1996), Neutral line model of substorms: Past result and present view, J. Geophys. Res., 101(A6), 12,975 – 13,010, doi:10.1029/ 95JA03753. Baker, D. N., et al. (2002), Timing of magnetic reconnection initiation during a global magnetospheric substorm onset, Geophys. Res. Lett., 29(24), 2190, doi:10.1029/2002GL015539. Balogh, A., et al. (2001), The Cluster magnetic field investigation: Overview of in-flight performance and initial results, Ann. Geophys., 19, 1207 – 1217. Baumjohann, W. (2002), Modes of convection in the magnetotail, Phys. Plasmas, 9(9), 3665 – 3667, doi:10.1063/1.1499116. Baumjohann, W., M. Hesse, S. Kokubun, T. Mukai, T. Nagai, and A. A. Petrukovich (1999), Substorm dipolarization and recovery, J. Geophys. Res., 104, 24,995 – 25,000, doi:10.1029/1999JA900282. Birn, J., and M. Hesse (1998), Substorm effects in MHD and test particle simulations of magnetotail dynamics, in Proceedings of International Conference on Substorms (ICS-4), Hamanako, Japan, edited by S. Kokubun and Y. Kamide, p. 159, Kluwer Acad., Boston. Birn, J., M. Hesse, G. Haerendel, W. Baumjohann, and K. Shiokawa (1999), Flow braking and the substorm current wedge, J. Geophys. Res., 104(A9), 19,895 – 19,904, doi:10.1029/1999JA900173. Cao, J. B., et al. (2006), Joint observations by Cluster satellites of bursty bulk flows in the magnetotail, J. Geophys. Res., 111, A04206, doi:10.1029/2005JA011322. Cao, X., et al. (2005), Continuous lobe reconnection in the midtail and its relationship to substorms: Cluster observations of continuous lobe reconnection in the mid-magnetotail, Chin. Sci. Bull., 50(1), 1 – 6, doi:10.1360/ 03WW0153. Carr, C., et al. (2005), The Double Star magnetic field investigation: Instrument design, performance and highlights of the first year’s observations, Ann. Geophys., 23, 2713 – 2732. Chao, J. K., J. R. Kan, A. T. Y. Lui, and S.-I. Akasofu (1977), A model for thinning of the plasma sheet, Planet. Space Sci., 25, 703 – 710, doi:10.1016/ 0032-0633(77)90122-2. Delcourt, D. C., and J. A. Sauvaud (1994), Plasma sheet ion energization during dipolarization events, J. Geophys. Res., 99, 97 – 108, doi:10.1029/ 93JA01895. Delcourt, D. C., J. A. Sauvaud, and A. Pedersen (1990), Dynamics of single-particle orbits during substorm expansion phase, J. Geophys. Res., 95(A12), 20,853 – 20,865, doi:10.1029/JA095iA12p20853. Elphinstone, R. D., et al. (1995), Observations in the vicinity of substorm onset: Implications for the substorm process, J. Geophys. Res., 100, 7937 – 7969, doi:10.1029/94JA02938. Fairfield, D. H. (1992), Advances in magnetospheric storm and substorm research: 1989 – 1991, J. Geophys. Res., 97, 10,865 – 10,874, doi:10.1029/ 92JA00326.
A07S25
Fazakerley, A. N., et al. (2005), The Double Star Plasma Electron and Current Experiment, Ann. Geophys., 23, 2733 – 2756. Frank, L. A., and J. B. Sigwarth (2000), Findings concerning the positions of substorm onsets with auroral images from the Polar spacecraft, J. Geophys. Res., 105, 12,747 – 12,761, doi:10.1029/ 1999JA000356. Ganushkina, N. Y., T. I. Pulkkinen, M. V. Kubyshkina, H. J. Singer, and C. T. Russell (2004), Longterm evolution of magnetospheric current systems during storm periods, Ann. Geophys., 22(4), 1317 – 1334. Henderson, M. G., G. D. Reeves, and J. S. Murphree (1998), Are northsouth aligned auroral structures an ionospheric manifestation of bursty bulk flows?, Geophys. Res. Lett., 25(19), 3737 – 3740, doi:10.1029/ 98GL02692. Jacquey, C. J., A. Sauvaud, and J. Dandouras (1991), Location and propagation of the magnetotail current disruption during substorm onset: Analysis and simulation of an ISEE multi-onset event, Geophys. Res. Lett., 18, 389 – 392, doi:10.1029/90GL02789. Jacquey, C., J. A. Sauvaud, I. Dandouras, and A. Korth (1993), Tailward propagating cross-tail current disruption and dynamics of near-Earth tail: A multi-point measurement analysis, Geophys. Res. Lett., 20, 983 – 986, doi:10.1029/93GL00072. Johnstone, A. D., et al. (1997), PEACE: A plasma electron and current experiment, Space Sci. Rev., 79, 351 – 398, doi:10.1023/A:1004938001388. Kamide, Y., and W. Baumjohann (1993), Magnetosphere Ionosphere Coupling, Springer, New York. Kaufmann, R. L. (1987), Substorm currents: Growth phase and onset, J. Geophys. Res., 92, 7471 – 7486, doi:10.1029/JA092iA07p07471. Korth, A., and Z. Y. Pu (2001), Magnetic field configuration and fieldaligned acceleration of energetic ions during substorm onsets, Ann. Geophys., 19, 1089 – 1094. Kubyshkina, M. V., V. A. Sergeev, and T. I. Pulkkinen (1999), Hybrid Input Algorithm: An event-oriented magnetospheric model, J. Geophys. Res., 104, 24,977 – 24,993, doi:10.1029/1999JA900222. Kubyshkina, M. V., V. A. Sergeev, S. V. Dubyagin, S. Wing, P. T. Newell, W. Baumjohann, and A. T. Y. Liu (2002), Constructing the magnetospheric model including pressure measurements, J. Geophys. Res., 107(A6), 1070, doi:10.1029/2001JA900167. Lam, M., M. Pinnock, and E. Donovan (2004), Observations of the magnetotail reconnection rate: Its relationship to the occurrence of auroral poleward boundary intensifications (PBIs) and to the substorm cycle, Eos Trans. AGU, 85(47), Fall Meet. Suppl., Abstract SM13C-04. Liou, K., C.-I. Meng, A. T. Y. Lui, P. T. Newell, and S. Wing (2002), Magnetic dipolarization with substorm expansion onset, J. Geophys. Res., 107(A7), 1131, doi:10.1029/2001JA000179. Liu, Z. X., C. P. Escoubet, Z. Pu, H. Laakso, J. K. Shi, C. Shen, and M. Hapgood (2005), The Double Star mission, Ann. Geophys., 23, 2707 – 2712. Lui, A. T. Y. (1991), Extended consideration of a synthesis model for magnetospheric substorms, in Magnetospheric Substorms, edited by J. R. Kan, T. A. Potemra, S. Kokubun, and T. Iijima, 43 pp., AGU, Washington, D.C. Lui, A. T. Y. (1996), Current disruption in the Earth’s magnetosphere: Observations and models, J. Geophys. Res., 101(A6), 13,067 – 13,088, doi:10.1029/96JA00079. Lui, A. T. Y. (2004), Potential plasma instabilities for substorm expansion onsets, Space Sci. Rev., 113, 127 – 206, doi:10.1023/B:SPAC. 0000042942.00362.4e. Lui, A. T. Y., R. E. Lopez, S. M. Krimigis, R. W. McEntire, L. J. Zanetti, and T. A. Potemra (1988), A case study of magnetotail current sheet disruption and diversion, Geophys. Res. Lett., 15, 721 – 724, doi:10.1029/GL015i007p00721. Lui, A. T. Y., Y. Zheng, Y. Zhang, S. Livi, H. Re´me, M. W. Dunlop, G. Gustafsson, S. B. Mende, C. Mouikis, and L. M. Kistler (2006), Cluster observation of plasma flow reversal in the magnetotail during a substorm, Ann. Geophys., 24, 2005 – 2013. Lyons, L. R. (2000), Determination of relative timing of near-Earth substorm onset and tail reconnection, in Proceedings of International Conference on Substorms ICS-5, Eur. Space Agency Spec. Publ., ESA SP 443, 255 – 258. Lyons, L. R., and J. C. Samson (1992), Proton aurora and substorm intensifications, Geophys. Res. Lett., 19, 2171 – 2174, doi:10.1029/ 92GL02494. Lyons, L. R., T. Nagai, G. T. Blanchard, J. C. Samson, T. Yamamoto, T. Mukai, A. Nishida, and S. Kokubun (1999), Association between, Geotail plasma flows and auroral poleward boundary intensifications observed by CANOPUS photometers, J. Geophys. Res., 104, 4485 – 4500, doi:10.1029/1998JA900140. Mauk, B. H. (1986), Quantitative modeling of the ‘‘convection surge’’ mechanism of ion acceleration, J. Geophys. Res., 91(A12), 13,423 – 13,431, doi:10.1029/JA091iA12p13423.
12 of 13
A07S25
CAO ET AL.: OBSERVATIONS OF SUBSTORM ACTIVATIONS
McPherron, R. L. (1979), Magnetospheric substorms, Rev. Geophys. Space Phys., 17, 657 – 681, doi:10.1029/RG017i004p00657. McPherron, R. L., C. T. Russell, and M. P. Aubry (1973), 9. Phenomenological model for substorms, J. Geophys. Res., 78, 3133 – 3149. Mishin, V. M. (1990), The magnetogram inversion technique and some applications, Space Sci. Rev., 53, 83 – 163, doi:10.1007/BF00217429. Mishin, V. M., S. B. Lunyushkin, D. S. Shirapov, and W. Baumjohann (1986), A new method for generating instantaneous ionospheric conductivity models using ground-based magnetic date, Planet. Space Sci., 34, 713 – 722, doi:10.1016/0032-0633(86)90125-X. Mishin, V. M., et al. (1997), A Study of the CDAW9C Substorm, May 3, 1986 using magnetogram inversion technique 2, and a substorm scenario with two active phases, J. Geophys. Res., 102, 19,845 – 19,859. Mishin, V. M., et al. (2001), Two distinct substorm onsets, J. Geophys. Res., 106, 13,105 – 13,118, doi:10.1029/2000JA900152. Miyashita, Y., S. Machida, T. Mukai, Y. Saito, K. Tsuruda, and H. Hayakawa (2000), A statistical study of variations in the near and middistant magnetotail associated with substorm onsets: GEOTAIL observations, J. Geophys. Res., 105, 15,913 – 15,930, doi:10.1029/ 1999JA000392. Nagai, T., M. Fujimoto, Y. Saito, S. Machida, T. Terasawa, R. Nakamura, T. Yamamoto, T. Makai, A. Nishida, and S. Kokubun (1998), Stucture and dynamics of magnetic reconnection for substorm onsets with Geotail observations, J. Geophys. Res., 103(A3), 4419 – 4440, doi:10.1029/ 97JA02190. Nakamura, R., T. Oguti, T. Yamamoto, and S. Kokubun (1993), Equatorward and poleward expansion of the auroras during auroral substorms, J. Geophys. Res., 98, 5743 – 5759, doi:10.1029/92JA02230. Nakamura, R., et al. (2002), Fast flow during current sheet thinning, Geophys. Res. Lett., 29(23), 2140, doi:10.1029/2002GL016200. Nakamura, R. W., et al. (2004a), Spatial scale of high-speed flows in the plasma sheet observed by Cluster, Geophys. Res. Lett., 31, L09804, doi:10.1029/2004GL019558. Nakamura, R., C. Mouikis, L. Kistler, W. Baumjohann, A. Runov, Y. Asano, M. Volwerk, B. Klecker, A. Balogh, and H. Re´me (2004b), Plasma sheet fast flows and their relationships to tail current sheet dynamics: Cluster observation, in Proceedings of International Conference on Substorms 7, edited by N. Ganushkina, and T. Pulkkinen, pp. 133 – 140, Finnish Meteorol. Inst., Levi, Finland. Nakamura, R., et al. (2005), Cluster and Double Star observations of dipolarization, Ann. Geophys., 23, 2915 – 2920. Nakamura, R., et al. (2006), Fast flow, dipolarization, and substorm evolution: Cluster/Double Star multipoint observations, in Proceedings of the Eighth International Conference on Substorms, edited by M. Syrjasuo and E. Donovan, pp. 197 – 202, Univ. of Calgary, Calgary, Canada. Ohtani, S.-I., et al. (1992), Initial signatures of magnetic field and energetic particle fluxes at tail reconfiguration: explosive growth phase, J. Geophys. Res., 97, 19,311 – 19,324, doi:10.1029/92JA01832. Ohtani, S., F. Creutzberg, T. Mukai, H. Singer, A. T. Y. Lui, and M. Nakamura (1999), Substorm onset timing: The December 31, 1995, event, J. Geophys. Res., 104, 22,713 – 22,727, doi:10.1029/1999JA900209. Perraut, S., O. L. Contel, A. Roux, G. Parks, D. Chua, M. Hosshino, T. Mukai, and T. Nagai (2003), Substorm expansion phase: Observations from Geotail, Polar and IMAGE network, J. Geophys. Res., 108(A4), 1159, doi:10.1029/2002JA009376. Pu, Z. Y., et al. (1999), Ballooning instability in the presence of a plasma flow: A synthesis of tail reconnection and current disruption models for the initiation of substorms, J. Geophys. Res., 104, 10,235 – 10,248, doi:10.1029/1998JA900104. Pu, Z. Y., A. Korth, Z. X. Chen, Z. X. Liu, S. Y. Fu, G. Zong, M. H. Hong, and X. M. Wang (2001), A global synthesis model of dipolarization at substorm expansion onset, J. Atmos. Sol. Terr. Phys., 63, 671 – 681, doi:10.1016/S1364-6826(00)00183-8. Pu, Z., et al. (2006), Observational features of magnetotail open field line reconnection, Eos Trans. AGU, 87(52), Fall Meet. Suppl., Abstract SM44B-05. Quinn, J. M., and D. J. Southwood (1982), Observations of parallel ion energization in the equatorial region, J. Geophys. Res., 87(A12), 10,536 – 10,540, doi:10.1029/JA087iA12p10536. Reeves, G. D., M. G. Henderson, P. S. McLachlan, R. D. Belian, R. H. W. Friedel, and A. Korth (1996), Radial propagation of substorm injections, in International Conference on Substorms ISC 3, Eur. Space Agency Spec. Publ., ESA SP, 339, 579 – 584. Reme, H., C. Aoustin, and J. M. Bosqued (2001), First multispacecraft ion measurement in and near the Earth’s magnetosphere with the identical Cluster Ion Spectrometry (CIS) experiment, Ann. Geophys., 19, 1303 – 1354. Reme, H., et al. (2005), The HIA instrument on board the Tan Ce 1 Double Star near-equatorial spacecraft and its first results, Ann. Geophys., 23, 2757 – 2774.
A07S25
Rostoker, G., A. T. Y. Lui, C. D. Anger, and J. S. Murphree (1987), Northesouth structures in the midnight sector auroras as viewed by the Viking imager, Geophys. Res. Lett., 14, 407 – 410, doi:10.1029/GL014i004p00407. Russell, C. T. (2000), How northward turning of the IMF can lead to substorm expansion onsets, Geophys. Res. Lett., 27(20), 3257 – 3259, doi:10.1029/2000GL011910. Sergeev, V. A., K. Liou, C.-I. Meng, P. T. Newell, M. Brittnacher, G. Parks, and G. D. Reeves (1999), Development of auroral streamers in association with localized impulsive injections to the inner magnetotail, Geophys. Res. Lett., 26(3), 417 – 420, doi:10.1029/1998GL900311. Shiokawa, K., et al. (1998), High-speed ion flow, substorm current wedge, and multiple Pi 2 pulsations, J. Geophys. Res., 103, 4491 – 4507, doi:10.1029/97JA01680. Shiokawa, K., W. Baumjohann, and G. Haerendel (1997), Braking of highspeed flows in the near-Earth tail, Geophys. Res. Lett., 24(10), 1179 – 1182, doi:10.1029/97GL01062. Shiokawa, K., Y. Miyashita, I. Shinohara, and A. Matsuoka (2005), Decrease in Bz prior to the dipolarization in the near-Earth plasma sheet, J. Geophys. Res., 110, A09219, doi:10.1029/2005JA011144. Tsyganenko, N. A. (1989), A magnetospheric magnetic field model with a warped tail current sheet, Planet. Space Sci., 37, 5 – 20. Tsyganenko, N. A., and D. P. Stern (1996), Modeling the global magnetic field of the large-scale Birkeland current systems, J. Geophys. Res., 101(A12), 27,187 – 27,198, doi:10.1029/96JA02735. Zhang, H., et al. (2006), Correlation between continuous lobe reconnection in the mid magnetotail and substorm expansion onset, Chin. Sci. Bull., 51(22), 2795 – 2804, doi:10.1007/s11434-006-2198-6. Zhang, H., et al. (2007), TC-1 observations of flux pileup and dipolarization-associated expansion in the near-Earth magnetotail during substorms, Geophys. Res. Lett., 34, L03104, doi:10.1029/2006GL028326. Zong, Q.-G., et al. (2004), Cluster observations of earthward flowing plasmoid in the tail, Geophys. Res. Lett., 31, L18803, doi:10.1029/ 2004GL020692. Zong, Q.-G., et al. (2007), Earthward flowing plasmoid: Structure and its related ionospheric signature, J. Geophys. Res., 112, A07203, doi:10.1029/2006JA012112.
����������������������
X. Cao, S. Y. Fu, Z. Y. Pu, L. Xie, and H. Zhang, School of Earth and Space Science, Peking University, Beijing, 100871, China. (zypu@pku. edu.cn) C. M. Carr and E. Lucek, Blackett Laboratory, Imperial College London, London SW7 2AZ, UK. I. Dandouras and H. Reme, Centre d’Etude Spatiale des Rayonnements, F-31028 Toulouse Cedex 4, France. M. W. Dunlop, Space Science and Technology Department, RAL, Chilton, OX11 0QX, UK. C. P. Escoubet, ESA/ESTEC, Keplerlaan 1, NL-2200 AG Noordwijk, Netherlands. A. N. Fazakerley, Mullard Space Science Laboratory, University College London, Dorking, Surrey, RH5 6NT, UK. M. Fraenz and A. Korth, Max-Planck-Institute for Solar System Research, D-37191 Katlenburg-Lindau, Germany. R. Friedel and G. D. Reeves, Los Alamos National Laboratory, Los Alamos, NM 87545, USA. H. U. Frey, Space Science Laboratory, University of California, Berkeley, Berkeley, CA 94720-7450, USA. K. H. Glassmeier, IGM, TU Braunschweig, D-38106 Braunschweig, Germany. M. V. Kubyshkina, Institute of Physics, University of St. Petersburg, Ulyanovskaya 1, 198504, Russia. Z. X. Liu, State Key Laboratory of Space Weather, CSSAR, CAS, Beijing 100080, China. Z. W. Ma, Institute of Fusion Theory and Simulation, School of Science, Zhejiang University, Hangzhou, 310027, China. V. M. Mishin, Institute of Solar-Terrestrial Physics, Russian Academy of Sciences, Irkusk, 64033, Russia. T. I. Pulkkinen, Finnish Meteorological Institute, Space Research, Helsinki, FI-0010, Finland. X. G. Wang, School of Physics, Peking University, Beijing, 100871, China. C. J. Xiao, National Astronomical Observatories, CAS, Beijing, 100012, China. Q. G. Zong, Center for Atmospheric Research, University of Massachusetts, Lowell, MA 01854-3629, USA.
13 of 13