T. Behr e-mail:
[email protected]
L. Porreca T. Mokulys A. I. Kalfas R. S. Abhari Turbomachinery Laboratory, Swiss Federal Institute of Technology, 8092 Zurich, Switzerland
Multistage Aspects and Unsteady Effects of Stator and Rotor Clocking in an Axial Turbine With Low Aspect Ratio Blading This paper presents the outcome of a recent study in clocking-related flow features and multistage effects occurring in high-pressure turbine blade geometries. The current investigation deals with an experimentally based systematic analysis of the effects of both stator-stator and rotor-rotor clocking. Due to the low aspect ratio of the turbine geometry, the flow field is strongly three-dimensional and is dominated by secondary flow structures. The investigation aims to identify the flow interactions involved and the associated effects on performance improvement or degradation. Consequently a threedimensional numerical analysis has been undertaken to provide the numerical background to the test case considered. The experimental studies were performed in a twostage axial research turbine facility. The turbine provides a realistic multi-stage environment, in which both stator blade rows and the two rotors can be clocked relative to each other. All blade rows have the same blade number count, which tends to amplify clocking effects. Unsteady and steady measurements were obtained in the second stage using fast response aerodynamic probes and miniature pneumatic five-hole probes. The current comprehensive investigation has shown that multistage and unsteady flow effects of stator and rotor clocking in low aspect ratio turbines are combined in a nonlinear fashion caused by axial and radial redistribution of low energy fluid. The integral result of clocking on stage efficiency is compensated by competing loss generating mechanisms across the span. 关DOI: 10.1115/1.2101855兴
Introduction The relative clocking positions of the stator vanes and the rotor blades affect the overall performance of multistage axial turbines. An optimal clocking position of stators and rotors in a multistage turbine aims to maximize the overall efficiency as well as to optimize the unsteady mechanical loading on the airfoils. The prerequisite of an overall successful design are prediction tools that incorporate the effects caused by clocking. Finding an optimal relative circumferential position of stators and rotors in a multistage axial turbine is the subject of extensive investigations in the last decade. The prospect of increasing turbine efficiency by consciously positioning the blade rows drives the study of understanding the aspects of the flow physics, which are responsible for this effect. Thereby the main focus lies on unsteady effects caused by the relative motion of adjacent blade rows. Experimental findings could show the effect of clocking on turbine efficiency, however the level of variation is not yet clear. Jouini et al. 关1兴 conducted a series of tests on a two-stage turbine facility to investigate the effect of stator-stator and rotor-rotor clocking on the aerodynamic efficiency. It was found that for both options this efficiency revealed a sinusoidal shape with respect to the clocking position with a peak-to-peak difference of 4% in a relative basis. Spanwise variation in efficiency was detected to be small. However, the region at 90% span showed a shift in phase and higher reaction on clocking with respect to the mean due to secondary flows offsetting the wake position. Huber et al. 关2兴 conducted an investigation of different vane clocking positions in a two-stage test turbine with low aspect ratio blading. The peakContributed by the Turbomachinery Division of ASME for publication in the JOURNAL OF TURBOMACHINERY. Manuscript received by June 28, 2004; final manuscript received June 28, 2005. Review conducted by C. Scrivener.
Journal of Turbomachinery
to-peak value of aerodynamic efficiency variation was determined to be at 0.3% overall and up to 0.8% for the midspan region. Efficiencies of five radial positions showed differences in periodical shape, position of minimum and maximum, as well as their difference when plotted against the vane clocking position. Reinmöller et al. 关3兴 measured a maximum difference in relative aerodynamic efficiency in a 1.5-stage turbine of 1.0% when clocking the stator blade rows. Gombert et al. 关4兴 determined aerodynamic efficiency for different clocking positions of the first stator in a three-stage turbine with high aspect ratio blading. Although the mean peak-to-peak value of the relative efficiency at different span positions is around 1.5%, the optimum efficiency occurs at different clocking positions. The change in efficiency due to circumferential clocking of blade rows is caused by redistributing loss areas within the blade passages. It was commonly found that a maximum in efficiency could be observed when the wake of an upstream stator hits the leading edge of the subsequent stator. If the wake passes between two stator blades, degradation in efficiency occurs. In the referenced test cases 关1–3兴, low aspect ratio blade rows were investigated. In such cases a highly three-dimensional flow field dominated by secondary flow structures exists. Walraevens et al. 关5兴 gives an interpretation of the unsteady flow around a second stator of a 1.5-stage turbine with low aspect ratio blading. Tiedemann et al. 关6兴 investigated unsteady stator-rotor interactions in a singlestage high-pressure turbine with its effect on a downstream stator. Höhn et al. 关7兴 classifies effects in a multistage turbine that are acting on a stat or wake that passes eventually through a subsequent stator. In this context spanwise differences in aerodynamic efficiency behavior as an effect of circumferential clocking might be consequential. Corresponding phenomena, such as phase shifts between the optimum clocking positions, could be detected in 关1–4兴. Various numerical simulations were conducted to predict the
Copyright © 2006 by ASME
JANUARY 2006, Vol. 128 / 11
effects of clocking in multistage turbines. Griffin et al. 关8兴 correctly predicts the sinusoidal pattern of the efficiency at midspan of the test case in 关2兴 using a 2D algorithm. However, the magnitude of the maximum efficiency change is less than in the experiment 共±0.15% 兲. Differences in 2D and 3D numerical calculations of stator-stator clocking phenomena were observed by Dorney and Sharma 关9兴 and Dorney and Sondak 关10兴. When applying a 2D algorithm a maximum change in efficiency of 2% was predicted, while the 3D simulation resulted in 1%. Different opinions exist about the effect of flow unsteadiness on the variation of efficiency in downstream blade rows caused by stator clocking. Dorney and Sharma 关9兴 found highest efficiency at maximum unsteadiness, whereas Griffin et al. 关8兴 observed the opposite. The current study intends to shed further light on the issue of clocking by investigating the steady and unsteady effects of statorstator and rotor-rotor clocking in a two-stage high-pressure turbine. It will focus on the effects of clocking on performance and flow features that are especially related to the low aspect ratio of the used blade rows.
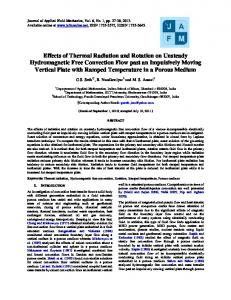
Experimental Method Research Turbine Facility. The facility accommodates two axial turbine stages. The air-loop is of a quasi-closed type and includes a radial compressor, a two-stage water to air heat exchanger, and a calibrated venturi nozzle for mass flow measurements. Downstream of the turbine the air-loop is open to atmospheric conditions. A dc generator absorbs the turbine power and controls the rotational speed of the turbine. The first and the second rotor are mechanically decoupled by a twin spool shaft design. A torque meter measures the torque of the second rotor. The turbine design allows quick and precise assembly and an easy access to the measurement planes. A number of different intrusive and nonintrusive measurement methods can be applied. The facility is equipped with a four-axis numerically controlled probe positioning system with high accuracy in every direction. The turbine entry temperature 共TET兲 is controlled to an accuracy of 0.3% and the rpm is kept constant within ±0.5 min−1 by a dc generator. The pressure difference across the turbine is stable within 0.3%. The turbine is operated at constant pressure difference across the stages. With this strategy even minor changes in mechanic efficiency due to clocking can be detected by the systems high sensible torquemeters. The alternative way of operation at constant power would not reach an equivalent level of accuracy. The interested reader can find a more detailed description of the research facility in Sell et al. 关11兴. A cross section of the turbine module is shown in Fig. 1. The first stator blade row can be continuously positioned in the circumferential direction relative to the second stator. In addition, both rotor blade rows can be clocked relatively to each other with increments of 0.25 deg. Key parameters of the rig are presented in Table 1. The Reynolds number based on axial chord is in the order of 2 ⫻ 105. The blade row geometries tested for this clocking investigation are designed to model high-pressure turbine blade geometries. In gas turbines the effects of transition are known to be crucial for the performance of the blades especially in low-pressure rather than high-pressure turbines 关12兴. In the current investigation, any possible effects caused by transition on the blades would apply in all of the tested clocking positions since all Reynolds number relevant parameters are kept constant. Measurement Technology. A number of unsteady as well as steady measurement techniques are available at the Turbomachinery Laboratory 共LSM兲. Flow parameters at frequencies up to 40 kHz, including total and static pressure, flow angles, velocity components, and Mach number, can be captured with fast response pressure probes. The steady flow field is measured with miniature five-hole probe with a tip diameter as small as 0.9 mm 关13兴. The unsteady pressure measurement technology of the Fast Response Aerodynamic Probes 共FRAP兲 was developed at the 12 / Vol. 128, JANUARY 2006
Fig. 1 “LISA” Two stages axial turbine facility
LSM 关14,15兴. The mainstream flow field is typically measured using a 1.8 mm tip diameter single sensor FRAP probe in virtualthree-sensor mode providing two-dimensional, time-resolved flow field information. The FRAP probe technology provides also temperature data at a frequency of up to 10 Hz. Clocking Test Cases. The nomenclature to identify the statorstator 共SS兲 and rotor-rotor 共RR兲 clocking cases has the format SSxxRRyy. The placeholder xx and yy represent the clocking position as a percentage of the pitchwise chord 共Fig. 2兲. Two shrouded test cases 共TC1, TC2兲 with identical profile geometries have been investigated during this clocking study. TC1 measurements were taken in a 2 ⫻ 2 matrix containing two stator-stator clocking positions 共SS00, SS50兲 and two rotor-rotor clocking positions 共RR00, RR50兲. For all four combinations the flow was measured in all three measurement planes with the steady technique. In addition both stator clocking positions were tested in all measurement planes with the unsteady technique at 0% rotor clocking 共RR00兲. In TC2 unsteady measurements were conducted in all planes for SS00RR00, SS50RR00, and SS50RR50. For a performance evaluation both rotor exit planes were tested with the coarse grid at eight different stator clocking position at RR00 and RR50. Two different measurement grids per pitch have been used during the campaign for the area traverses. In order to investigate a flow field in a measurement plane 共MP兲 a grid of 20 equidistant circumferential and 30 radial positions has been used. This grid is the standard for the conducted measurements. A coarse grid was
Table 1 Main parameter of “LISA” 2-stages axial turbine research facility Rotor speed 共RPM兲 Pressure ratio Mass flow 共kg/s兲 Blades Aspect ratio Tip diameter 共mm兲 Mach number at rotor exit/stator exit Reynolds number based on axial chord
2625 1.38 10.65 42/ 42 1.8 800 0.1/ 0.35 2 ⫻ 105
Transactions of the ASME
Fig. 2 Relative circumferential stator-stator „SS… and rotorrotor „RR… clocking positions in percent of circumferential chord. Position of measurement planes
used once for TC2 to get sufficiently representative values of the MP for an efficiency evaluation. This measurement grid consists of 7 equidistant circumferential and 15 radial positions. All area plots shown is this paper are views in the upstream direction and contain the area of two pitches. In there, the rotational direction of the rotor blades is from the right to the left.
Numerical Method The 3D steady and unsteady Navier-Stokes multistage solver Stage3D has been derived from the original Dawes code BTOB3D 关16兴, running a new discretization scheme from Jameson and Baker 关17兴. The validation on low speed turbines, comparable to LISA, has been undertaken by Emunds et al. 关18兴, where the validity of the computational approach on low Mach number axial turbines has previously been shown. The solver has an explicit five-step, fourth-order Runge-Kutta cycle, using three level multigrid convergence acceleration. The spatial discretization uses a second-order central differencing scheme. It is equipped with several turbulence models, from which the one-equation of Spalart and Allmaras 关19兴 has been chosen for the investigation in this paper. When running steady state the solver uses a so-called mixing-plane between rotating and nonrotating cascades, which mixes out circumferential variations. The averaging for the mixing planes is done, using a consistent approach from Denton 关20兴. A nonreflective treatment of outflowing characteristics is applied, which creates a high level of independency from axial spacing between blade rows and mixing planes 关21兴. The unsteady treatment makes use of fourth-order-accurate sliding meshes at the interfaces, direct periodicity at circumferential borders, as LISA is of integer blade ratio nature, and dual time stepping with a second-order time stepping scheme. The LISA rig has been modeled in this investigation using simple straight H-meshes, without discretization of shroud leakages 共see Fig. 3兲.
Results and Discussion The following presentation and interpretation of the measurement and calculation results of the flow field will refer to the three measurement planes in the order as the flow passes through them. In this context, comparisons between experimental and numerical results will be commented. Effects occurring due to stator-stator and rotor-rotor clocking will be commented on in the corresponding sections. An evaluation of performance measurements will be given in the last part of the paper. Flow Behind First Stage (MP 1). The flow in between the first and the second stage is dominated by secondary flow structures created within the first rotor blade row. Remaining flow features from the first stator are seen as quasi-stationary effects. The flow Journal of Turbomachinery
Fig. 3 CFD—Mesh configuration
of
“LISA”
two-stage
axial
turbine
field in this measurement plane is exposed to the potential field of the second stator, which has a dominating influence in the following flow parameters such as static pressure and flow yaw angle. Due to the application of five-hole probes, the measurements are pneumatically averaged and do not show pitchwise resolution of the high-frequency signal of the passing rotor blades. However, the rotor signal is still resolved in the radial direction. This fact allows the detection of quasi-steady flow features, which originate in the first stator blade row. These features are quasi-stationary in the absolute frame of reference, since they are not moving relative to the stators, but they are modulated in time by the rotor blades. According to the relative circumferential position of the first stator, the location varies, where its secondary flow structures approach the leading edge of the second stator. This dependence can be seen in the pneumatically averaged distribution of the total pressure coefficient Cpt downstream of the first rotor for eight different stator-stator clocking positions 共Fig. 4兲. The distribution of Cpt in the pneumatically averaged area plots shows only a minor influence on the position of the second stators potential field. Regions of higher and lower Cpt values can be observed from 20% to 80% span, which are corresponding to the position of the first stator. The span region from 0% to 20% is dominated by the passing rotor hub passage vortex and the flow, which is going into the second stators cavity. At the tip region the leakage jet from the rotor cavity is seen as low Cpt values from 90% to 100% span. At around 85% span, the trace of the passing rotor tip passage vortex appears. The first stator’s secondary flow structure forms a region of low total pressure 共see dotted line in Fig. 4兲, which is inclined relative to the radial direction. This flow structure can be viewed as a wake-vortex secondary flow “package.” Hence, by clocking the stators relatively to each other, it cannot be achieved that all parts of the package are aligned with the second stator’s leading edge at one certain clocking position. In the opinion of the authors the reasons for the inclination are remaining exit swirl out of the blade rows of the first stage as well as a nonconstant spanwise loading distribution on rotor one. The pneumatically averaged values of the absolute flow angles downstream of the first rotor blade row reflect the position of the secondary flow package that originates from the first stator. Depending on whether a part of the secondary flow package of the first stator hits the second stator LE or passes in between the two stator blades, it creates a more or less uniform flow angle distribution across the pitch. This effect is demonstrated in Fig. 5 for two exemplary span positions, 29% and 79%. The absolute flow JANUARY 2006, Vol. 128 / 13
Fig. 4 TC2—total pressure coefficient Cpt †ⴚ‡ downstream of Rotor 1 at eight different stator-stator positions at RR00 „coarse grid measurement, pneumatically averaged…. „a… SS00, „b… SS12.5, „c… SS25, „d… SS37.5, „e… SS50, „f… SS62.5, „g… SS75, and „h… SS87.5.
angle distribution across two pitches is shown at the stator clocking positions where it has its minimum and maximum amplitude. The shaded area represents the variation of flow angles, which occurs at the intermediate stator clocking positions. The following 14 / Vol. 128, JANUARY 2006
four cases can be distinguished for these two span positions: Case I—SS000: The part of the secondary flow package at 79% span passes in between two stator blades. A maximum peak-topeak value of the flow yaw angle can be observed at this pitch Transactions of the ASME
Fig. 5 TC2—pitchwise distribution of absolute flow yaw angle downstream of rotor 1 at „a… 79% and „b… 23% span „eight stator clocking positions at RR00…
position 共⌬ = 20 deg兲. Case II—SS250: The part of the secondary flow package at 23% span hits the LE of the second stator. The flow angle at this span position shows the smallest variation across the pitch compared to the other clocking positions 共⌬ ⬍ 1 deg兲. Case III—SS500: The part of the secondary flow package close to the tip 共79% span兲 hits the LE of the second stator. The flow angle at this span position shows the smallest variation across the pitch compared to the other clocking positions 共⌬ = 5 deg兲. Case IV—SS750: The part of the secondary flow package at 23% span passes in between two stator blades. A maximum peakto-peak value of the flow yaw angle can be observed at this pitch position 共⌬ = 14 deg兲. In order to verify this observation, unsteady measurement results for cases I and III are available and presented in Fig. 6. The time-distance diagrams show the flow angle variation across two stator pitches during a time of three rotor blade passing periods. Stationary flow features, i.e., a potential field around a stator LE, will be expressed in such plots as parallel to the vertical axis. Flow features moving with the rotor, i.e., rotor wakes, are detectable as diagonal lines oriented from the lower right to the upper left, according to the rotational direction of the rotor. In the case of the current geometry, one stator pitch corresponds to one blade passing period due to an identical number of blades in the stator and rotor stages. Both unsteady plots underline the findings from the steady measurements 共Fig. 5共a兲兲. The 50% stator clocking case at 79% span shows much more evenly distributed flow angles across the pitch compared to the 0% stator clocking case. What was explained on that exemplary span position can be applied to the whole pitch. Due to the inclined shape of the secondary flow structure created in the first stator, it is not possible to have evenly distributed flow angles across the pitch at all span positions at one certain stator clocking position. To visualize this Journal of Turbomachinery
Fig. 6 TC2—time resolved pitchwise distribution of absolute flow yaw angle downstream of rotor 1 at 79% span „a… SS00RR00 and „b… SS50RR00
fact, two different stator clocking cases are shown in Fig. 7, SS00 and SS50. The previously discussed span positions are marked as dotted lines across the circumference. The minima in flow angle at 79% span and SS00 can be located in front of the stator leading edge. If both cases are subtracted from each other, the effect of clocking on flow yaw angles can be observed 共Fig. 8兲. Each radial position shows an alternating distribution of minima and maxima of flow yaw angle differences across the span. A pitchwise averaged distribution across the span helps to evaluate the integral effect for each span position. For this case, the 50% clocking of the stators results in an underturning at the tip region down to 80% span. In the midspan region, no significant change is noticeable. From 0% to 25% span an over-under-turning effect can be observed, which results from the interaction of the rotor hub passage vortex and the derivative of the shed stator hub passage vortex. During the time of a rotor blade passage, when these two features interact with each other, the rotor hub passage vortex is weakened. The position of the second stator’s leading edge relative to this interaction zone is of high importance. If the interaction happens in front of the leading edge, a weaker rotor hub passage vortex approaches the second stator’s leading edge. Hence, the potential of loss production is reduced. If the interaction occurs in the midpitch area, the rotor vortex with its full strength approaches the leading edge of the second stator. The effect of this phenomenon can be observed in reduced performance of this span region at a stator clocking position of 50% JANUARY 2006, Vol. 128 / 15
Fig. 7 Flow yaw angle distribution downstream of rotor 1 at „a… 0% and „b… 50% stator clocking „RR00…
when compared to the 0% position. Resulting from this discussion it can be stated that, in the current case, the inlet angle distribution of the second stator depends especially on the position of the derivatives of the first stators passage vortices. The wake structure appears only in a very limited area and has minor influence. In addition the impact of the cavity flow has to be considered when clocking the stators. After the potential of the stator clocking on incidences on the second stator has been shown, now the rotor-rotor clocking will be evaluated. Figure 9 shows for the SS00 and SS50 test cases the
difference in flow yaw angles between rotor clocking of 50% and 0% pitch. When the stators are aligned the rotor clocking has very little influence on the flow angles in front of stator 2. Whereas in the SS50 case, there are significant differences, which are observed in the hub region up to 20% span, as well as close to the casing endwall. However the midspan region remains unchanged. This comparison leads to the conclusion that at the endwalls, the potential field of the downstream second rotor can have an upstream effect on the inlet flow angles of the second stator, if an appropriate stator-stator clocking position has been chosen.
Fig. 8 Difference of flow yaw angles between 50% and 0% Stator clocking „RR00… downstream of rotor 1. „a… Pitchwise distribution and „b… circumferentially massaveraged and spanwise distribution
Fig. 9 Difference between 50% and 0% rotor clocking in flow yaw angle distribution downstream of rotor 1 at „a… SS00 and „b… SS50
16 / Vol. 128, JANUARY 2006
Transactions of the ASME
Fig. 10 Spanwise total pressure distribution downstream of rotor 1—comparison of CFD and experiment
In order to evaluate the accuracy of the CFD prediction for the current case a comparison of pitchwise averaged total pressures downstream of rotor 1 between experimental and numerical results is presented in Fig. 10. The CFD model seems to predict the midspan region from 20% to 85% span, being accurate to within 70 Pa. The neighboring areas at the endwalls are affected by cavity flows and the CFD prediction is not as good. To show also the applicability to clocking studies, the area distribution of total pressure coefficients derived from experiments and CFD at stator clocking positions 0% and 50% are shown in Fig. 11. From 0% to 20% span the measurement detects underturned fluid coming from the stator 1 cavity, which propagates through the rotor. It appears as a band of low Cpt in the plot. In the tip region the cavity flow bypassing the blades of the first rotor can be recognized. Due to energy dissipation in the labyrinth of the shroud, the area from 90% to 100% span shows Cpt values, which are 10% lower compared to the unaffected region of this plane. Flow of Second Stator (MP 2). The variation of inlet flow angles in front of the second stator LE was discussed in the previous section. The modified inlet condition of the second stator
Fig. 12 CFD—static surface pressure distribution of stator 2 at 79% span for four different stator and rotor clocking cases
blade row will have an effect on the static surface pressure distribution of this stage, and therefore an influence on the stator blade loading. CFD results of the static surface pressure distribution at 90% span are presented in Fig. 12. Differences between stator positions of 0% and 50% are noticeable, whereas rotor clocking does not have a significant influence. While the frontloading of the stator does not change, the aft-loading increases when clocking the stators to 50%. This difference shows an effect of the incidence on stator 2 in this span region. The way in which a changed stator loading translates into a change in turning angle across this stator is demonstrated in Fig. 13. Experimental and numerical results show a good agreement in the midspan region from 20% to 75% span. This range has now decreased compared to the rotor 1 exit plane, due to the added rotor cavity leakage. However, both plots show strong similarities between both rotor clocking positions of the same stator clocking case. They agree as well in a span region 共50% to 70%兲 where the turning angle has decreases, and a region 共20% to 40%兲 where it increases, with setting the stator clocking to 50% of a pitch.
Fig. 11 TC1, CFD—comparison of total pressure coefficient distribution of experiment and CFD downstream of rotor 1 at RR00. „a… SS00 „Exp.…, „b… SS00 „CFD…, „c… SS50 „Exp.…, and „d… SS50 „CFD…
Journal of Turbomachinery
JANUARY 2006, Vol. 128 / 17
Fig. 13 Turning angle differences ⌬ across stator 2 of four clocking configurations „reference case is SS00RR00…: „a… Experiment „TC1… and „b… CFD
The actual effect for the second rotor is expressed in the absolute exit angle of the stator. The same similarities between the four different cases as stated for the turning angle also apply here. Figure 14 shows that at the 50% stator clocking cases the stator exit swirl increased from 70% to 90% span, and it decreased from 50% to 70%. The maximum change in these regions of 2 deg in absolute flow yaw angle was achieved by clocking only the stator 50%. Additional clocking of the rotors by 50% reduced this effect. Hence, it is possible to achieve a change in incidence on the second rotor over a wide range of the span of up to 2 deg by clocking the stators. The unsteady exit flow yaw angle development downstream of the second stator for two stator clocking positions is presented in Fig. 15. A pitchwise averaged spanwise distribution of the flow angle is plotted versus time, which is expressed in rotor blade passing periods. Due to the mass averaging, one vertical line represents the whole effective flow field at a certain moment in time. The contained information is therefore different from regular time-distance diagrams, which show only one pitch or span position. The comparison of both clocking positions shows higher flow yaw angles between 40% and 70% span for the 0% case. With that, the findings from the steady measurements 共Fig. 14兲 can be underlined also with the unsteady results. From the comparison of the two unsteady cases it becomes clear that the stator
Fig. 15 TC2—time distance diagram of flow yaw angle downstream of stator 2, pitchwise massaverages spanwise distribution versus time: „a… SS00 and „b… SS50 at RR00
clocking on the tested configuration has strong influences on certain span regions, however there are others, which are much less affected. The modified flow conditions through the stator blade row between 0% and 50% stator clocking appear also in the entropy production of this stage. In Fig. 16 the distribution of static entropy difference across the second stator is shown for both cases. The entropy was calculated according to Denton 关20兴. Comparing both cases, an overall increase in entropy across the span can be stated when clocking the stators to 50%. At the 50% clocking case the entropy is considerably higher in the region from 0% to 40% span. These different levels of entropy reflect the result of the interaction of the first rotor hub passage vortex and the secondary flow structure from the first stator. The stator trailing edge vortex that appears in the midspan region of the 0% clocking case seemed to have merged with the upper stator passage vortex at the 50% clocking case. Furthermore, the loss cores of the latter case are more detached from the trailing edge of the stator. In the opinion of the authors this is caused by the observed changes in incidence on the stator. Therefore it is reasonable that they can grow in a more unobstructed way and involve more massflow, which in the end results in a higher entropy level. Flow Behind Second Stage (MP 3). Unlike the case of the exit of the first rotor, downstream of rotor 2 no potential field of a subsequent blade row is present. The secondary flow field at this point mainly comprises of the following three influences: 1. secondary flow generated in the second stator, 2. the secondary flow structures originated in the first rotor blade row, and 3. cavity leakage flows of each upstream blade row.
Fig. 14 TC1—absolute flow angle differences ⌬ of four clocking configurations „reference case: SS00RR00… at stator 2 exit: „a… experiment „TC1… and „b… CFD
18 / Vol. 128, JANUARY 2006
Isolation of every single influence is difficult since they are all interacting with each other. The impact of the secondary flows in this plane is significant. The exit plane of rotor 2 reflects the downstream effects of the given stator clocking position. In addition the effect of the rotor clocking becomes apparent. The superTransactions of the ASME
Fig. 16 TC2—measured static entropy difference across the second stator of „a… SS00 and „b… SS50 positions „both at RR00… and „c… corresponding pitchwise averaged spanwise distributions
position of both, the stationary and the rotating clocking of the two sets of blade rows, defines the flow condition of the second rotor. Consequently the performance of the second rotor should show an influence of the stator and the rotor clocking. This can be confirmed when evaluating the turning angles of the second rotor 共Fig. 17兲. A strong underturning effect occurs for the 50% stator clocking cases from 40% to 75% span, which is a result of the change in incidence in front of the stator blade row. For the adjoining span regions 共80% to 100% and 20% to 40%兲 this changes into overturning. However, the integral value across the span of the change in turning angle is around zero. Changing the clocking position seems to improve and reduce the performance of a stage at the same time, depending on the radial position. The comparison with the numerical results shows again a good agreement with the ex-
periment at the midspan region from 25% to 75%. Out of this region the influence of the cavity flow introduces a strong deviation between the results. Besides the characteristic differences between the stator clocking positions, the influence of the rotor clocking can be also observed. Keeping the stator clocking position constant and varying the rotor clocking position causes only minor changes in the shape and level of the flow yaw angle distribution. At SS00 an increase in the relative turning angle of ⌬ = 1 deg can be observed from 10% to 40% span when clocking the rotors from 0% to 50%. However, the difference in this span region at SS50 for the same rotor clocking positions is less than ⌬ = 0.2 deg. The opposite picture appears for the span region from 70% to 90%. There the difference is in the order of ⌬ = 1.3 deg at the 50% stator clocking position, when clocking the rotors. Both span regions happen to be in the area of the rotor passage vortices. The given combination of stator and rotor clocking positions defines whether there is an increase or decrease in performance in these regions.
Performance Evaluation Experimental. Thermodynamic efficiencies of the three unsteady measured clocking configurations of TC2 are presented in Fig. 18. The graphs show the results of efficiency balances across both stages 共turbine兲, stage 1 and stage 2. The thermodynamic total-to-total efficiency has been calculated from
冉
th = 1 −
Fig. 17 Relative turning angle differences ⌬ across rotor 2 of four clocking configurations „reference case is SS00RR00…: „a… experiment „TC1… and „b… CFD
Journal of Turbomachinery
Tt,out Tt,in
冊冒冋 冉 冊 册 1−
pt,out pt,in
共−1兲/
共1兲
All three clocking cases show the difference in efficiency with respect to the reference case at 0% stator and 0% rotor clocking. The reference case has the highest thermodynamic efficiency of the evaluated cases when balancing both stages together. A maximum difference in relative thermodynamic efficiency between the clocking cases of 0.33% has been determined. When clocking the stators to 50% the efficiency of the first stage increases, while the one of the second stage drops considerably. The first stage reveals a relative increase in efficiency of 0.32%, whereas the second stage decreases by 1.3%. This tradeJANUARY 2006, Vol. 128 / 19
Fig. 19 TC2—spanwise distribution of turbine relative thermodynamic efficiency difference to the reference case of three characteristic clocking configurations
Fig. 18 TC2, CFD—relative thermodynamic efficiency difference to the reference case of three characteristic clocking configurations: „a… stage 1, „b… stage 2, and „c… turbine
off between efficiency gain in one stage and efficiency loss in the other stage reveals the multistage effect of the clocking. It shows that it cannot be assumed that clocking has only an efficiency effect on downstream stages. In the present case the flow has a highly subsonic character, which increases the potential for flow effects to be transmitted upstream. This kind of phenomena was also observed by Haldeman et al. 关22兴 when clocking a lowpressure turbine vane in a 1.5-stage transonic turbine. If in addition the rotors are also clocked to 50%, the efficiencies of both stages again come closer to the one of the SS00RR00 position. This counterbalancing effect due to the clocking of the rotors compensates in the present case to a certain extent the negative effect of the stator clocking. The observed effects of the experiments on relative efficiency between the clocking cases can also be seen in the numerical results. The CFD model shows the same trend, however it the underpredicts the effect of clocking on the efficiency of both stages, due to the insufficient modeling of endwall flows and numerical diffusion. The radial distribution of thermodynamic efficiency balanced across both stages 共Fig. 19兲 shows which span regions are affected most by the clocking. The plot shows the difference from the reference case SS00RR00. The regions where vortical structures were identified, 0% to 40% span and 80% to 100% span, show locally significant relative changes in thermodynamic efficiency up to −0.7%. The integral change in efficiency across the span corresponds with the values presented in Fig. 18共c兲. The higher overall efficiency of the SS50RR50 case compared to the SS50RR00 case comes due to a higher efficiency value close to the endwalls. Haldeman et al. 关22兴 reported as well significant spanwise differences in the effect of clocking based on static pressure measurements. They have found the effect of clocking at 10% span to be most apparent. The error analysis 关23兴 shows that the relative uncertainty in efficiency between different test cases is in the order of 0.3%. The relative uncertainty between clocking cases of the same measurement campaign will be even less, since identical test and measurement conditions apply. Due to the instrumentation of the test facility it is possible to 20 / Vol. 128, JANUARY 2006
measure rig operation parameters, such as the torque of the second stage and massflow. This allows the calculation of mechanic efficiency. The integral character of this value does not resolve any spanwise efficiency distribution. It is defined as the ratio of specific shaft power over the enthalpy difference of the isentropic expansion:
m =
冉 冊 冒 冋 冉 冉 冊 冊册 ·M ˙ m
c pTin 1 −
pt,out pt,in
共−1兲/
共2兲
The resulting values are plotted for comparison as the ratio of the actual value over the average of all values from a data set:
冋 冒 冉 兺 冊册 n
⌬m,rel = m
1 m,i n i=1
−1
共3兲
The differences from the mean are plotted in Fig. 20. From the variation of the efficiencies versus clocking positions no systematic change can be observed. The maximum peak-to-peak variation is in the order of 0.3%. This magnitude of changes in mechanic efficiency is within the relative accuracy of the test facility. Reasons for these minor changes are suspected to be the strong three-dimensional character of the flow at each clocking position. Especially the second stage receives a highly complex flow field, containing secondary flow features from the upstream blade rows. The mixture of positive and negative effects of the current clocking position across the span results in a rather small change in mechanical efficiency. Numerical. A series of 2D and 3D unsteady computations was performed for the different clocking cases 共SS-RR: 0-0, 50-0, 0-50, 50-50兲. The 2D calculation considered only the midspan position, whereas the 3D method evaluates the whole span. In
Fig. 20 TC2—total-to-total mechanic efficiency of the second stage at eight stator and two rotor clocking positions
Transactions of the ASME
Fig. 21 CFD—overall aerodynamic loss deviation from reference case SS00 RR00
contrast to the 2D, which only accounts for profile losses, the 3D calculation realizes the full modeling of secondary flow propagation through the engine and the influences due to wall friction. In Figs. 21 and 22 the results of both kinds of calculations are presented. All plots show difference values of the aerodynamic loss compared to the reference case of 0% stator clocking and 0% rotor clocking. The direct comparison shows several systematic differences, which illustrates the insufficiency of the 2D algorithms for the current low aspect ratio application. In Fig. 21 the differences in aerodynamic loss are presented for each clocking case. The 2D results show a variation of the losses at midspan only in the order one-tenth of what has been calculated with the 3D algorithm. The reason for this is the strong influence of vortical structures in the flow field. Hence, the losses due to vortices and endwalls have a predominant character over losses created by wakes, which makes the midspan region not representative for the overall flow. However, in both calculations the reference case 0-0 has the lowest losses compared to the clocking positions. A closer look at the development of losses per row is given in Fig. 22. The most significant difference between the 2D and 3D methods appears in the losses of the second stator. An opposite result has been derived for this blade row with the two methods. There at the midspan, only the influence of the wake
Fig. 22 CFD—aerodynamic loss deviation from reference case 0-0 clocking for each blade row: „a…… 2D and „b… 3D
Journal of Turbomachinery
clocking appears since vortices are not existent in the model. The more realistic result comes therefore again from the 3D calculation, where the influence of the clocking on the vortex propagation is also taken into account. The second stage shows generally a higher reaction on clocking than the first one and has also the bigger contribution to the overall losses. It can be concluded from the 3D numerical results that the rotor clocking, compared to the stator clocking, has only low impact on the stator losses. However, the relatively high loss generation of the second rotor for all clocking cases seems to indicate that the loss of rotor 2 depends on the same order of magnitude on two influences: 共1兲 the relative position of rotor 2 to the first rotor’s secondary flow remainders and 共2兲 changes in loading of the second stator due to the clocking of the stators. The second rotor seems to be the weakest part in the development of losses, as it can suffer under its own clocking position as well as ill-conditioned inflow characteristics from previous stator rows. Observed efficiency changes are in the order of −0.35% from the reference case for the stator clocking and about −0.32% for the rotor clocking, while the combined case 50-50 differs in the order of −0.25%.
Conclusions Stator-stator as well as rotor-rotor clocking effects have been investigated in a comprehensive experimental and numerical effort. The test case was a two-stage low aspect ratio axial turbine. Thus, a combined view on the flow field and the performance of blade rows and turbine was achieved. In addition, a 2D and 3D numerical study was performed to study the numerical effects of the current clocking case. An overall change of relative mechanical efficiency of ±0.15% was experimentally determined. The maximum relative change in thermodynamic efficiency between two oppositional stator clocking positions was in the order of 0.3%. Evaluating the applied measurement techniques it was found that steady, pneumatically averaged five-hole probe measurements are sufficient to derive overall performance values of turbine stages. In order to understand the influence of clocking on the interaction of flow features between neighboring blade rows, highly resolved unsteady measurements of the related flow fields are necessary. The application of numerical methods for clocking investigations on turbines with low aspect ratio blading requires the use of 3D unsteady algorithms with a full nonlinear treatment. It allows correct modeling of secondary flow propagation through different blade rows and accurate prediction of flow angles. In 2D approaches the use of mixing algorithms between blade rows prevents the modeling of convective flow features that are dominant in such kinds of geometries. In the current case, the region from 0% to 40% span behind the first rotor is clearly dominated by a strong vortical structure, which is a combination of cavity leakage from the first stator and vortices of the first rotor. The current study has demonstrated that the evaluation of overall performance of a certain clocking position requires the consideration of all stages. The performance of a downstream stage is set by its relative clocking position with respect to the preceding stage. However, in the upstream direction an effect influencing efficiency was detected. In the current test case the change from 0% to 50% stator clocking position caused a relative degradation of thermodynamic efficiency of the second stage by 1.3%. This was accompanied by an efficiency increase in the first stage of the order of 0.3%. The applied numerical methods show the same trend. However, due to insufficient modeling of cavity leakage flows involved in the experiment as well as numerical diffusion, this effect is underpredicted. At this point it has to be pointed out again that this rather small effect on efficiency is characteristic for the tested geometry. It must not lead to a general conclusion, that clocking has a minor influence on efficiency. JANUARY 2006, Vol. 128 / 21
In the flow field of the investigated low aspect ratio blading vortex, interaction and propagation are more important than the influence of wakes. Vortices close to the endwalls are enhanced by leakage flows from the cavities. The wakes of the stators and the rotors are strongly affected by their adjoining vortical structures. Due to the resulting deformation of the wakes they cannot be clearly distinguished anymore in the flow field. Therefore an alignment of wakes relative to the leading edges of a subsequent bladerow is not as important as it is in high aspect ratio geometries. Vortical structures can be seen as the instrument of redistributing low energy fluid in the radial direction. The convection and interaction of secondary flow structures results in local variations of flow angles, incidences, and loading. Therefore, clocking is affecting the performance characteristic of each radial position differently. The combination of the resultant performance characteristics across the span causes a nonlinear behavior of the overall stage. In order to have an overall efficiency benefit due to clocking, the blade design has to ensure that an efficiency increase can be achieved on the majority of the span by setting up a certain clocking position.
Acknowledgment The authors gratefully acknowledge the support and the precious suggestions of Dr. Pfau and Dr. Schlienger. The geometries of the blades used in this investigation were developed during the course of the AG-Turbo project “500 MW auf einer Welle” funded by the German Federal Ministry of Economy 共BMWI兲 under File Nos. 0327060D and 0327060F. In particular, Dr. E. Janke, Dr. H.-P. Schiffer, and Dr. H. Richter of Rolls-Royce Deutschland are acknowledged for their continuous support and kind permission to publish the results presented in this paper.
Nomenclature c p ⫽ Specific heat capacity at constant pressure, J/kg K cv ⫽ Specific heat capacity at constant volume, J/kg K Cps ⫽ Static pressure coefficient, Cps = 共p − p3兲 / 共pt0 − p 3兲 Cpt ⫽ total pressure coefficient, Cpt = 共pt − p3兲 / 共pt0 − p 3兲 ˙ ⫽ massflow, kg/s m M ⫽ torque, N m P ⫽ pressure, Pa R ⫽ perfect gas constant, J/kg K R ⫽ radius, m S ⫽ specific entropy, J/kg K T ⫽ temperature, K Greek
⫽ ⫽ ⫽ ⫽
Abbreviations 5HP ⫽ CFD ⫽ FRAP ⫽ LE ⫽ MP ⫽ RR ⫽ SS ⫽ TC ⫽ TE ⫽ TET ⫽
turning angle, deg flow yaw angle, deg isentropic coefficient, = c p / cv, rotational velocity, 1 / s five-hole probe computational fluid dynamics fast response aerodynamic probe leading edge measurement plane relative rotor-rotor clocking position relative stator-stator clocking position test case trailing edge turbine entry temperature
22 / Vol. 128, JANUARY 2006
Subscripts t th rel m 0 1 2 3 Superscripts ⫺ ⫽
⫽ ⫽ ⫽ ⫽ ⫽ ⫽ ⫽ ⫽
total thermal relative frame of reference Mechanical turbine inlet measurement plane 1 measurement plane 2 measurement plane 3
⫽ circumferentially averaged ⫽ average across the pitch area
References 关1兴 Jouini, D. B. M., Little, D., Bancalari, E., Dunn, M., Haldeman, C., and Johnson, P. D., 2003, “Experimental Investigation of Airfoil Wake Clocking Impacts on Aerodynamic Performance in a Two Stage Turbine Test Rig,” ASME Paper No. GT-2003–38872. 关2兴 Huber, F. W., Johnson, P. D., Sharma, O. P., Staubach, J. B., and Gaddis, S. W., 1996, “Performance Improvement Through Indexing of Turbine Airfoiles: Part 1—Experimental Investigation,” J. Turbomach., 118, pp. 630–635. 关3兴 Reinmöller, U., Stephan, B., Schmidt, S., and Niehuis, R., 2002, “Clocking Effects in a 1.5 Stage Axial Turbine—Steady and Unsteady Experimental Investigations Supported by Numerical Simulations,” J. Turbomach., 124, pp. 52–60. 关4兴 Gombert, R., and Höhn, W., 2001, “Unsteady Aero-dynamical Blade Row Interactions in a New Multistage Research Turbine—Part I: Experimental Investigation,” ASME Paper No. 2001-GT-0306. 关5兴 Walraevens, R. E., Gallus, H. E., Jung, A. R., Mayer, J. F., and Stetter, H., 1998, “Experimental and Computational Study of the Unsteady Flow in a 1.5 Stage Axial Turbine with Emphasis on the Secondary Flow in the Second Stator,” ASME Paper No. 98-GT-254. 关6兴 Tiedemann, M., and Kost, F., 2001, “Some Aspects of Wake-Wake Interactions Regarding Turbine Stator Clocking,” J. Turbomach., 123, pp. 526–533. 关7兴 Höhn, W., and Heinig, K., 2000, “Numerical and Experimental Investigation of Unsteady Flow Interaction in a Low-Pressure Multistage Turbine,” J. Turbomach., 122, pp. 628–633. 关8兴 Griffin, L. W., Huber, F. W., and Sharma, O. P., 1996, “Performance Improvement Through Indexing of Turbine Airfoiles: Part II—Numerical Simulation,” J. Turbomach., 118, pp. 636–642. 关9兴 Dorney, D. J., and Sharma, O. P., 1996, “A Study of Turbine Performance Increase Through Airfoil Clocking,” AIAA Paper No. 96–2816. 关10兴 Dorney, D. J., and Sondak, D. L., 1996, “Three-Dimensional Simulation of Airfoil Clocking in a 1–1/2 Stage Turbine,” AIAA Paper No. 96–2816. 关11兴 Sell, M., Schlienger, J., Pfau, A., Treiber, M., and Abhari, R. S., 2001, “The 2-stage Axial Turbine Test Facility LISA,” ASME Paper No. 2001-GT-0492. 关12兴 Hourmouziadis, J., 1989, “Aerodynamic Design of Low Pressure Turbines,” Lecture 8, AGARD LS-167. 关13兴 Treiber, M., Kupferschmied, P., and Gyarmathy, G., 1998, “Analysis of the Error Propagation Arising from the Measurements with a Miniature Pneumatic 5-hole Probe,” XIVth Symposium on Measuring Techniques for Transonic and Supersonic Flows in Cascades and Turbomachines, Limerck. 关14兴 Kupferschmied, P., Köppel, O., Gizzi, W. P., and Gyarmathy, G., 2000, “Time Resolved Flow Measurements with Fast Aerodynamic Probes in Turbomachinery,” Meas. Sci. Technol., 11, pp. 1036–1054. 关15兴 Pfau, A., Schlienger, J., Kalfas, A. I., and Abhari, R. S., 2002, “Virtual Four Sensor Fast Response Aerodynamic Probe 共FRAP兲,” Proceedings of the XVIth Bi-Annual Symposium on Measuring Techniques in Transonic and Supersonic Flows in Cascades and Turbomachines, Cambridge, UK, September 23–24. 关16兴 Dawes, W. N., BT0B3D, 1991, “A Computer Program for the Analysis of Three-Dimensional Viscous Compressible Flow in Tubomachinery Blade Rows,” Manual for BT0B3D. 关17兴 Jameson, A., and Baker, T. J., 1984, “Multigrid Solutions of the Euler Equations for Aircraft Configurations,” AIAA Paper No. 84–0093. 关18兴 Emunds, R., Jennions, I. K., Bohn, D., and Gier, J., 1997, “The Computation of Adjacent Blade-Row Effects in a 1.5 Stage Axial Flow Turbine,” ASME Paper No. 97-GT-81. 关19兴 Spalart, P. R., and Allmaras, S. R., 1992, “A One-Equation Turbulence Model for Aerodynamic Flows,” AIAA Report 92–0439. 关20兴 Denton, J. D., 1993, “Loss Mechanisms in Turbomachines,” ASME J. Turbomach., 115, pp. 621–656. 关21兴 Saxer, A. P., and Giles, M. B., 1993, “Quasi-Three-Dimensional Nonreflecting Boundary Conditions for Euler Equations Calculations,” J. Propul. Power, 9共2兲, pp. 263–271. 关22兴 Haldeman, C., Dunn, M. G., J., Barter, J. W., Green, B. R., and Bergholz, R. F., 2004, “Experimental Investigation of Vane Clocking in a One and 1 / 2 Stage High Pressure Turbine,” ASME Paper No. GT2004–53477. 关23兴 Pfau, A., 2003, “Loss Mechanisms in Labyrinth Seals of Shrouded Axial Turbines.” ETH Ph.D. dissertation no. 15226.
Transactions of the ASME