MULTIVARIATE GEOGRAPHIC CLUSTERING IN A METACOMPUTING ENVIRONMENT USING GLOBUS* G. Mahinthakumar[ Oak Ridge National Laboratory Center for Computational Sciences P. O. Box 2008 Oak Ridge, TN 37831–6203 voice: 423–241–5628 fax: 423–241–2850
[email protected] William W. Hargrove University of Tennessee Energy, Environment, and Resources Center Systems Development Institute 10521 Research Drive, Suite 100 Knoxville, TN 37932 voice: 423–241–2748 fax: 423–241–3870
[email protected]
Forrest M. Hoffman[ Oak Ridge National Laboratory Environmental Sciences Division P. O. Box 2008 Oak Ridge, TN 37831–6036 voice: 423–576–7680 fax: 423–576–8543
[email protected] Nicholas T. Karonis High Performance Computing Laboratory Department of Computer Science Northern Illinois University Dekalb, IL 60115 voice: 815–753–6937 fax: 815–753–0342
[email protected]
ABSTRACT The authors present a metacomputing application of multivariate, nonhierarchical statistical clustering to geographic environmental data from the 48 conterminous United States in order to produce maps of regions of ecological similarity, called ecoregions. These maps represent finer scale regionalizations than do those generated by the traditional technique: an expert with a marker pen. Several variables (e.g., temperature, organic matter, rainfall etc.) thought to affect the growth of vegetation are clustered at resolutions as fine as one square kilometer (1 km2). These data can represent over 7.8 million map cells in an n–dimensional (n = 9 to 25) data space. A parallel version of the iterative statistical clustering algorithm is developed by the authors using the MPI (Message Passing Interface) message passing routines. The parallel algorithm uses a classical, self–scheduling, single–program, multiple data (SPMD) organization; performs dynamic load balancing for reasonable performance in heterogeneous metacomputing environments; and provides fault tolerance by saving intermediate results for easy restarts in case of hardware failure. The parallel algorithm was tested on various geographically distributed heterogeneous metacomputing configurations involving an IBM SP3t, an IBM SP2t, and two SGI Origin 2000t’s. The tests were performed with minimal code modification, and were made possible by Globust (a metacomputing software toolkit) and the Globus–enabled version of MPI (MPICH–G). Our performance tests indicate that while the algorithm works reasonably well under the metacomputing environment for a moderate number of processors, the communication overhead can become prohibitive for large processor configurations. CLUSTERING Statistical clustering is the division, arrangement, or classification of a number of (nonidentical) objects into subgroups or categories based on their similarity. Hierarchical clustering provides a series of divisions (based on some measure of similarity) into all possible numbers ________________________ *The submitted manuscript has been authored by a contractor of the U.S. Government under contract No.
DE–AC05–96OR22464. Accordingly, the U.S. Government retains a nonexclusive, royalty–free license to publish or reproduce the published form of this contribution, or allow others to do so, for U.S. Government purposes [Oak Ridge National Laboratory, managed by Lockheed Martin Energy Research Corp. for the U.S. Department of Energy under contract number DE–AC05–96OR22464
of groups— from one single group which contains all objects to as many groups as there are objects, with each object being in a group by itself. Hierarchical clustering, which results in a complete similarity tree, is computer–intensive; therefore, the assemblage to be classified is limited to relatively few objects. Nonhierarchical clustering provides only a single, user–specified level of division into groups; however, it can be used to classify a much larger number of objects. Multivariate geographic clustering employs nonhierarchical clustering on the individual pixels in a digital map from a Geographic Information System (GIS) to classify the cells into types or categories. The classification of satellite imagery into land cover or vegetation classes using spectral characteristics of each cell from multiple images taken at different wavelengths is a common example of multivariate geographic clustering. Rarely, however, is nonhierarchical clustering performed on map cell characteristics aside from spectral reflectance values. In Figure 1 we show how the clustering is performed by transforming from geographic space to data space. Geographic Space
Data Space Temperature A B C D E F GH
1 2 3 4 5 6
6
5
2 43
1
A B CD E FG H
Temperature
Descriptive variables become axes of the data space. Map cell values become coordinates for the respective axis.
H1
G7
Organic Matter
Organic
Rainfall
Matter
Rainfall
Perform multivariate non-hierarchical statistical clustering.
Group map cells with similar values for these descriptive variables.
Temperature
A6 E6 D5 A8 G7 H1 E4 B7 G8 F2 D6 C6 F8 1 2 3 4 Cluster Bins
C6 A6 F2
Reassemble map cells in geographic space and color them according to their cluster number.
H1
A8
B7
D5 E4 D6 E6 G8 G7 F8
Rainfall
Organic Matter
Figure 1. A schematic representation of the clustering process. Maps showing the suitability or characterization of regions are used for many purposes, including identifying appropriate ranges for particular plant and animal species, identifying suitable crops for an area or identifying a suitable area for a given crop, and identifying plant hardiness zones for gardeners. In addition, ecologists have long used the concept of the eco2
region, an area within which there are similar ecological conditions, as a tool for understanding large geographic areas (Bailey, 1983, 1994, 1995, 1996; Omernick, 1986). Such regionalization maps, however, are usually prepared by individual experts in a rather subjective way and are essentially objectifications of expert opinion. Our goal was to make repeatable the process of map regionalization based not on spectral cell characteristics, but on characteristics identified as important to the growth of woody vegetation. By using nonhierarchical multivariate geographic clustering, we intended to produce several maps of ecoregions across the entire nation at a resolution of 1 km 2 per cell. At this resolution, the 48 conterminous United States contains over 7.8 million map cells. Nine characteristics from three categories—elevation, edaphic (or soil) factors, and climatic factors—were identified as important. The edaphic factors are (1) plant–available water capacity, (2) soil organic matter, (3) total Kjeldahl soil nitrogen, and (4) depth to seasonally–high water table. The climatic factors are (1) mean precipitation during the growing season, (2) mean solar insolation during the growing season, (3) degree–day heat sum during the growing season, and (4) degree–day cold sum during the nongrowing season. The growing season is defined by the frost–free period between mean day of first and last frost each year. A map for each of these characteristics was generated from best–available data at a 1–km2 resolution for input into the clustering process (Hargrove and Luxmoore, 1998). Given the size of this input data and the significant amount of computer time typically required to perform statistical clustering, we decided a parallel computer was needed for this task.
Figure 2. National map clustered on elevation, edaphic, and climate variables into 3000 ecoregions using similarity colors. In our studies we have used the clustering algorithm to generate maps with 500, 100, 2000, and 3000 ecoregions. These maps appear to capture the ecological relationships among the 3
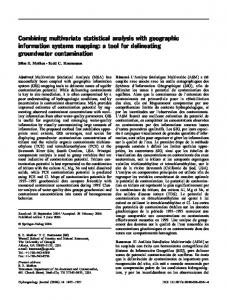
nine input variables. This multivariate geographic clustering can be used as a way to spatially extend the results of ecological simulation models by reducing the number of runs needed to obtain output over large areas. Simulation models can be run on each relatively homogeneous cluster rather than on each individual cell thus reducing the computational burden. The clustered map can be populated with simulated results cluster by cluster (like a paint–by– number picture). This cluster fill–in simulation technique has been successfully used by the Integrated Modeling Project to assess the health and productivity of southeastern forests. In Figure 2 we show an example of final map obtained after the clustering and smoothing operations. GLOBUS AND MPICH–G The Globus metacomputing tool kit (Foster and Kesselman, 1997) (see www.globus.org) and the Globus–enabled version of MPICH (Gropp et.al., 1996), called MPICH– G (see www–unix.mcs.anl.gov/mpi/mpich), is used in this implementation. MPICH–G provides a transparent interface to run MPI–based applications under a heterogeneous metacomputing environment. THE ALGORITHM In our implementation of nonhierarchical clustering, the 3 characteristic values (principal components) of the 9 input variables are used as coordinates to locate each of the 7.8 million map cells (number of observations) in a 9–dimensional environmental data space. The map cells can be thought of as galaxies of ”unit–mass stars” fixed within this 9–dimensional volume. The density of ”unit–mass stars” varies throughout the data space. ”Stars” which are close to each other in data space have similar values of the nine input variables, and might, as a result, be included in the same map ecoregion or ”galaxy.” The clustering task is to determine, in an iterative fashion, which ”stars” belong together in a ”galaxy,” the number of which is specified by the user. The coordinates of a series of ”galaxy” centroids, or its ”centers of gravity,” are calculated after each iteration, thus allowing the ”centers of gravity” to ”walk” to the most densely populated parts of the data space. In Figure 3 we show how the United States appears when clustered in ecological 3–space defined by the 3 principal component axes collapsed from the nine input variables. Each spot in this data space represents a mean centroid for one of 3000 clusters, and, in this visualization, the size and color of each of the centroids relate to how many of the 1–km 2 cells are members of this cluster. The largest cluster is 22,000 km2, and the size distribution of clusters is a negative exponential. The largest cluster ‘‘galaxies’’ are close to the center of the data ‘‘universe’’. The nonhierarchical algorithm, which is nearly perfectly parallelizable, consists of two parts: initial centroid determination (called seed finding) and iterative clustering until convergence is reached. The algorithm begins with a series of ”seed” centroid locations in data space––one for each cluster desired by the user. In the iterative part of the algorithm, each map cell is assigned to the cluster whose centroid is closest, by simple Euclidean distance, to the cell. After all map cells are assigned to a centroid, new centroid positions are calculated 4
for each cluster using the mean values for each coordinate of all map cells in that cluster. The iterative classification procedure is repeated, each time using the newly recalculated mean centroids, until the number of map cells which change cluster assignments within a single iteration is smaller than a convergence threshold. Once the threshold is met, the final cluster assignments are saved.
Figure 3. Clusters (or galaxies) in a 3–dimensional data space. Sphere color and size are indicative of the number of map cells in each cluster (or the total mass of each galaxy if each map cell is represented by a unit–mass star). Seed centroid locations are ordinarily established using a set of rules which sequentially examine the map cells and attempt to preserve a subset of them which are as widely separated in data space as possible. This inherently serial process is difficult to parallelize; if the data set is divided equally among N nodes and each node finds the best seeds among its portion of the cells and then if a single node finds the ”best–of–the–best,” this set of seeds is not as widely dispersed as a single serially obtained seed set. On the other hand, the serial seed–finding process is quite slow on a single node, while the iterations are relatively fast in parallel. It is not sensible, in terms of the time to final solution, to spend excessive serial time polishing high–quality initial seeds because the centroids can ”walk” relatively quickly to their ulti5
mate locations in parallel. Thus, we opted to implement this ”best–of–the–best” parallel seed–finding algorithm. It has proven to produce reasonably good seeds very quickly. The iterative portion of the algorithm is implemented in parallel using the MPI message passing routines by dividing the total number of map cells into parcels or aliquots, such that the number of aliquots (naliquot) is larger than the number of nodes. We use a classical self– scheduling (master–slave) relationship among nodes and perform dynamic load balancing because of the heterogeneous nature of the metacomputing environment on which the algorithm is run. This dynamic load balancing is achieved by having a single master node act as a ”card dealer” by first distributing the centroid coordinates and then distributing an aliquot of map cells to all nodes. Each slave node assigns each of its map cells to a particular centroid and then reports the results back to the master. If there are additional aliquots of map cells to be processed, the master will send a new aliquot to this slave node for assignment. In this way, faster and less busy nodes are effectively utilized to perform the majority of the processing. If the load on the nodes changes during a run, the distribution of the work load will automatically be shifted away from busy or slow nodes onto idle or fast nodes. At the end of each iteration, the master node computes the new mean centroid positions from all assignments and distributes the new centroid locations to all nodes along with the first new aliquot of map cells. Because all nodes must be coordinated and in step at the beginning of each new iteration, the algorithm is inherently self–synchronizing. If the number of aliquots is too low (i.e., the aliquot size is too large), the majority of nodes may have to wait for the slowest minority of nodes to complete the assignment of a single aliquot. On the other hand, it may be advantageous to exclude particularly slow nodes so that the number of aliquots—and therefore the amount of internode communication—is also reduced, thus often resulting in shorter run times. Large aliquots work best for a parallel machine with few or homogeneous nodes or very slow internode communication, while small aliquots result in better performance on machines with many heterogeneous nodes and fast communication. Aliquot size is a manually tunable parameter, which makes the code portable to various architectures, and can be optimized by monitoring the waiting time of the master node in this algorithm. To provide some fault–tolerance, the master node saves centroid coordinates to a disk at the end of each iteration. If one or more nodes fails or if the algorithm crashes, the program can simply be restarted using the last–saved centroid coordinates as initial seeds, and processing will thus resume in the iteration in which the failure occurred. PRELIMINARY RUNS USING THE INTEL PARAGONS Our preliminary runs, which were performed before the extended abstract was submitted included 2 Intel Paragonst (128 processor XPS/5 and 512 processor XPS/35) at Oak Ridge National Laboratory (ORNL), an IBM SP2 (80 processors) at Argonne National Laboratory (ANL), and an SGI Origin 2000 (128 processors) at the National Center for Supercomputing Applications (NCSA). Since then, the Intel Paragons at ORNL have been replaced by an 6
IBM SP3 (124 processors). Therefore our more recent results presented in the next section do not include the Intel Paragons. This section presents the results from our earlier runs. Globus and MPICH–G were first installed and tested on the Intel Paragons at ORNL. Globus was already available on the NCSA Origin 2000 and the ANL IBM SP, so no new installation of Globus was required for these machines. However, MPICH–G had to be installed on these machines. Considerable work was expended in getting Globus working on the Paragons because it was the first successful Globus installation on an Intel Paragon. The communication component of Globus is called Nexust. Nexus can use the native communication library within a parallel architecture (e.g., MPI, MPL, NX etc.) and TCP/IP or UDP for communication across different machines. The Paragon’s communication library, NX, was not fully implemented within Nexus with the original Globus distribution. Working with the Globus developers, we completed the Nexus communication module to include the INX protocol for the Paragons. This facilitated more efficient communication within the Paragons. Previously, communication within the Paragon was possible only when using normal TCP/IP. In these preliminary runs, the clustering application code was compiled using MPICH–G on the Intel Paragons, SGI Origin 2000, and the IBM SP. The MPICH–G was built to use the INX communication protocol within the Paragons, IBM’s native MPI within the IBM SP, and the standard (TCP/IP) protocol within the Origin 2000. The communication across different architectures was facilitated by TCP/IP. Some initial tests were performed to evaluate the Globus overhead on the Intel Paragons. A 16–processor local run on the XPS/5 indicated that the Globus overhead was about 10% compared to a version compiled without Globus. However, when the number of processors was increased to 64, the Globus version was about 20 times slower than the non–Globus version. Further analysis indicated that most of the Globus slowdown was caused by frequent polling by the processors to check for incoming messages. When the polling frequency was reduced by increasing the GLOBUS_NEXUS_SKIP_POLL environment variable from the default 100 to 10 000, the slowdown was improved from 20 times to about 1.8 times. The other primary parameter that was adjusted to improve performance is the number of aliquots (naliquot) parameter (described in a previous section), which is inputted to the clustering code. This parameter was reduced from 2300 to 512, thus resulting in a Globus overhead of about 20% for the 64–processor configuration. It should be noted that the Globus overhead problem was specific to the Paragons and not observed on the other architectures. Preliminary tests were performed to study the performance of the code under different metacomputing configurations involving Intel Paragons. The heterogeneous test used a simple configuration with moderate number of processors on 4 different machines: 4 processors each on the Intel Paragon XPS/5 at ORNL, the Intel Paragon XPS/35 at ORNL, the IBM SP2 at ANL (ANL SP2), and the SGI Origin 2000 at NCSA (NCSA O2K). We performed several tests by progressively adding each machine to the configuration. Preliminary timings for 1 iteration of the clustering algorithm are presented in Table 1. 7
Table 1. Preliminary timings involving the Intel Paragons Machine Configuration
Time (secs)
XPS/5
290
XPS/5, XPS/35
200
XPS/5, XPS/35, ANL SP2
170
XPS/5, XPS/35, ANL SP2, NCSA O2K
190
HETEROGENEOUS METACOMPUTING ENVIRONMENT For the more comprehensive performance tests performed in this study the following machines are used in various combinations: S
IBM SP3 at ORNL (124 processors)
S
IBM SP2 at ANL (80 processors)
S
SGI Origin 2000 (also called O2K) at NCSA (128 processors—250 MHz)
S
SGI Origin 2000 (also called O2K) at ANL (96 processors—250 MHz)
Although all of the above machines had more than 64 processors available, we used only a maximum of 64 processors on each machine in our tests. The the clustering application code was compiled using MPICH–G on the IBM SPs, and the SGI Origin 2000s. The MPICH–G was built to use the IBM’s native MPI communication protocol within the IBM SPs, and the shared memory protocol within the Origin 2000s. The communication across different architectures was facilitated by TCP/IP. In order to build MPICH–G over native MPI, the mpi.h include file has to be slightly modified to avoid name conflicts between the MPICH–G and the native MPI (Personal communication, Warren Smith, ANL). Contrary to the Intel Paragon case presented earlier, the Globus overhead (overhead of calling the native communication library through the MPICH–G and Nexus layers) was measured to be less than 5% for all of the above architectures for a test case with 64 processors. PERFORMANCE TESTS The test problem used in this paper consisted of 890,950 observations (num_obs), 3 principal components (num_coord), and 500 clusters (num_clust). The number of aliquots (naliquot or the number of pieces in which the problem is divided) is set to 256 unless otherwise stated. The number of observations is based on a 4 km 4 km resolution map of the entire United States. For a larger problem the number of observations can be as large as 7.8 million (1 km 1 km resolution), the number of principal components can be as large as 25, and the number of clusters as large as 50000. A problem of this size runs for 4 days on an SGI Origin 2000 using 16 processors. We intend to present results for this run (in a metacomputing environment) in our final presentation. The number of floating point operations performed by the slave nodes in 1 iteration of the algorithm (primarily in the distance calculation) is roughly equal to 8
3*num_obs*num_clust*num_coord. The number of operations performed by the master node is negligible compared to the slave nodes. For this reason, when we list the number of processors in our results, we count only the number of slave processors. However, the location of the master node in a metacomputing environment can play an important role in the performance results because of differences in communication efficiency (the master node communicates with all the slave nodes in the beginning and at the end of each iteration). For example, a 64 node run performed on the Origin 2000 at ANL with all slave processors at ANL but with the master node on the ORNL SP3 takes about 73 seconds for 5 iterations. However, if all 65 nodes (including the master node) reside at ANL, then the time is 60 seconds for 5 iterations. This discrepancy can vary depending on the network load. Results on individual machines For relative comparisons of each machine, we first present timings for 5 iterations of the algorithm on each machine (Table 2). The timings are obtained using the globus_utp timer calls. All the jobs were submitted from the ORNL SP3. The master node resided on the local machine for these runs. Table 2. Timings in seconds for 5 iterations of the algorithm Machine name
Time for 5 iterations (secs) 4 processors
16 processors
64 processors
ORNL SP3
570
155
45
NCSA O2K
551
139
35
ANL O2K
560
177
60
ANL SP2
1148
300
83
In these runs the fastest timing is obtained for the 64–processor run on the NCSA O2K. However, the relative performances of ORNL SP3, NCSA O2K, and the ANL O2K are roughly equal. The ANL SP2 which uses the old IBM power2 nodes does not give good single node performance but achieves reasonable speedup (13.9/16). The best speedup of 15.8/16 is obtained on the NCSA O2K (128–processor O2Ks are known to exhibit good parallel efficiency up to 64 processors). In the timings presented in this study the distance calculation was performed using the pow function which can be inefficient on some architectures. We recently discovered that the single processor performance (on ORNLs SP3) can be improved significantly by replacing pow with simple multiplication. In the final presentation we will update our results by incorporating this change. Results in a heterogeneous metacomputing environment The heterogeneous runs were performed using combinations of 4, 16, or 64 processors on each machine. The number of aliquots processed by each machine indicates the amount of work performed by each machine. The percentage of work performed by each machine can be obtained from this information. In Table 3 we present the percentage of work performed by each machine and the total time for 5 iterations for various machine configurations. The 9
’–’ indicates that the machine did not participate in the run. The master node resides on the machine that shows the percentage of work performed in red text. In some cases the ORNL SP3 participated only as a master node. Since the master node performs negligible amount of work, these are reflected as 0 work performed. Table 3. Performance results for heterogeneous configurations Work performed by each machine (%) ORNL SP3
ANL O2K
NCSA O2K
ANL SP2
Number of processors on each
Total number of processors
Time for 5 iterations (secs)
60
40
–
–
4
8
355
33
33
34
–
4
12
206
28
28
29
15
4
16
187
61
39
–
–
16
32
107
0
–
–
100
64
64
104
30
26
25
19
16
64
94
0
65
–
35
64
128
135
From Table 3 we see that in general we see some improvement in timings as we progressively increase the number of processors in the configuration. The exception is the 128 node run using the 2 ANL machines. In this case, the master node resided at ORNL thus increasing the cost of communication. Effect of naliquot As defined previously, naliquot is the number of pieces (number of aliquots) of the pie the problem is divided into before passing each piece to a slave processor to work on. In a homogeneous processor configuration (single machine), minimum number of messages are passed between the master and slave nodes when naliquot is equal to the total number of slave processors (the number of messages is proportional to naliquot). However, in a heterogeneous configuration the naliquot can have an impact on performance because of the differences in communication efficiency (both across network and local to each machine) and computing speeds. Increasing naliquot effectively increases the granularity of the problem and thus permitting better load balancing at the expense of more communication in a heterogeneous configuration. The effect of naliquot is examined by using a fixed machine configuration of 4 processors each on the ORNL SP3 and the ANL SP2 for a total of 8 processors. These two machines were chosen because the relative differences in speed. The results are shown in Table 4. The ORNL SP3 is roughly twice as fast as the ANL SP2. For naliquot of 8 each machine gets 4 pieces (equal to the number of processors) to work on. Therefore the total time is limited by the ANL SP2 to perform 50% of the work. It is surprising to see that even for the case of naliquot = 16, each machine gets the same amount of work. This is because the ORNL machine is not much than twice as fast as the ANL machine. This can be explained as follows: 10
in the beginning each machine gets 4 pieces (e.g., pieces 1 to 4 at ORNL SP3, and pieces 5 to 8 at ANL SP2) to work on; the ORNL machine finishes first and gets pieces 9 to 12; however, during the time the ORNL machine works on pieces 9 to 12, the ANL machine finishes pieces 5 to 8, and pieces 13 to 16 are handed over to the ANL machine. The performance improves up to a naliquot of 256 but then begins to drop. At this point there is no more improvement in load balancing but the communication cost is higher. Table 4. Effect of naliquot on performance
ORNL SP3
ANL SP2
Time for 5 iterations (secs)
8
50
50
581
16
50
50
611
64
64
36
461
128
66
34
417
256
76
24
353
512
76
24
383
naliquot
Work performed by each machine (%)
CONCLUSIONS The ability to run applications in a metacomputing or grid environment can be a big advantage given the greater number of computing resources available. Tools like Globus and MPICH–G provide the user a common interface for harnessing multiple parallel architectures. However, many applications have to be rewritten to properly take advantage of such environments due to the following reasons: (1) communication performance is several orders of magnitude higher within a tightly coupled parallel architecture compared to regular ethernet, and (2) processor and communication performance can be different from one architecture to the other. Fortunately, the application we have considered here is affected to a lesser degree by the aforementioned problems because of the adjustable granularity (naliquot), self–scheduling nature of the algorithm (less synchronization and better dynamic load balancing), and relatively small communication overhead. We have demonstrated that even for the relatively small clustering problem considered here we can achieve reasonable performance up to a moderate number of processors in a metacomputing environment. However, for large processor configurations the slow ethernet communication can be bottleneck especially for the small problem considered here. However, we can expect better performance for larger more realistic problems. REFERENCES Bailey, R. G. 1983. Delineation of ecosystem regions. Environmental Management, 7:365–373. Bailey, R. G., P. E. Avers, T. King, W. H. McNab, eds. 1994. Ecoregions and subregions of the United States (map). Washington, DC: U.S. Geological Survey. Scale 1: 7,500,000; colored. Accompanied by a supplementary table of map unit descriptions compiled and 11
edited by McNab, W. H., and R. G. Bailey. Prepared for the U.S. Department of Agriculture, Forest Service. Bailey, R. G. 1995. Description of the ecoregions of the United States. (2nd ed., 1st ed. 1980). Misc. Publ. No. 1391, Washington, D.C. U.S. Forest Service. 108 pp with separate map at 1:7,500,000. Bailey, R. G. 1996. Ecosystem Geography. Springer–Verlag. 216 pp. Foster, I., C. Kesselman. 1997. ”Globus: A Metacomputing Infrastructure Toolkit.” Intl. J. Supercomputer Applications, 11(2):115–128. Gropp, W., E. Lusk, N. Doss, and A. Skjellum. September 1996. ”A High–Performance, Portable Implementation of the MPI Message Passing Interface Standard.” Parallel Computing, 22(6):789–828. Hargrove, W. W. and R. J. Luxmoore. 1998. A New High–Resolution National Map of Vegetation Ecoregions Produced Empirically Using Multivariate Spatial Clustering. URL: http://www.esd.ornl.gov/~hnw/esri98/ Hoffman, F. M. and W. W. Hargrove. March 1999. ”Cluster Computing: Linux Taken to the Extreme.” Linux Magaine, Vol. 1, No. 1, pp. 56–59. Omernik, J. M. 1987. Ecoregions of the Conterminous United States. Map (scale 1:7,500,000). Annals of the Association of American Geographers.
12