Demo + Video + Makers' Program
MM’18, October 22-26, 2018, Seoul, Republic of Korea
MusicMapp: A Deep Learning Based Solution for Music Exploration and Visual Interaction Mohammed Habibullah Baig1 Texas A&M University College Station, TX, USA
[email protected]
Jibin Rajan Varghese1 Texas A&M University College Station, TX, USA
[email protected]
Zhangyang Wang2
Texas A&M University College Station, TX, USA
[email protected]
ABSTRACT We present MusicMapp, the world’s first large-scale interactive visualization of full-length songs as a point-cloud map, based on high-level features extracted using a customized deep convolutional recurrent neural network (Deep CRNN). MusicMapp will provide the audience with a novel way of experiencing music, opening up new horizons for research and exploration in musicology, regarding how music is perceived, consumed, and interacted with. The demo of MusicMapp will highlight a series of features, including but not limited to: 1) a cloud-based Android App visualizing songs as a point cloud; 2) personalized music exploration and recommendation; and 3) a social-network sharing mechanism built among the users exploring songs.
CCS CONCEPTS • Applied computing → Sound and music computing; • Computing methodologies → Dimensionality reduction and manifold learning; • Human-centered computing → Information visualization;
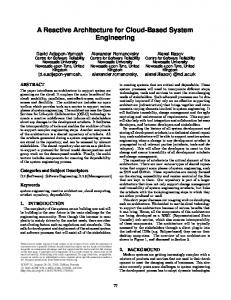
the inherent transitive nature of music across categories such as genre, lyrics sentiment and mood. As a result, they tend to generate a flat list of similar songs and cannot extrapolate automatically. We believe that an interactive visualization of music on a map, that can depict semantic similarity of songs and recommend new music, would greatly enhance user experience. This motivated us to develop MusicMapp, a novel method of classifying, recommending and visualizing music as a point-cloud map of songs, using the latest visualization techniques powered by a custom-built deep network for feature extraction. Our system allows to either discover new similar songs on the map proximity, or try out songs in any unexplored area, all in highly straightforward and user-friendly ways. MusicMapp is optimized to run a training iteration on 1000 songs in less than one minute, and the generated maps have already been tested on more than 23,000 songs from the Free Music Archive(F.M.A.) dataset [6], as shown in Fig. 1.
KEYWORDS Music Classification; Deep Learning; Clustering; Visualization
ACM Reference Format: Mohammed Habibullah Baig, Jibin Rajan Varghese, and Zhangyang Wang. 2018. MusicMapp: A Deep Learning Based Solution for Music Exploration and Visual Interaction. In 2018 ACM Multimedia Conference (MM ’18), October 22-26, 2018, Seoul, Republic of Korea. ACM, New York, NY, USA, 3 pages. https://doi.org/10.1145/3240508.3241394
1
Figure 1: The MusicMapp point cloud map of over 23,000 songs from the F.M.A. dataset.
INTRODUCTION
The explosion of digital music has made it impossible to listen and analyze the vast volumes of music consumed daily by users worldwide. Therefore, machine learning based approaches for music classification and recommendation are catching the attention from both academia and industry. However, there is a lack of variety in the options how users can interact with music. Traditional play-list based recommendation systems apply hard labels on categories of music from annotated meta-data, and often fail to capture
2
TECHNICAL NOVELTY
The system consists of two components: recommendation and visualization. For the first component, semantic music features such as genre and sentiments must be identified/predicted with high accuracy. We apply a Deep Convolutional Recurrent Neural Network (Deep CRNN) to extract discriminative high-level features to represent songs, followed by a dimensionality reduction. The resulting compact vectors are then visaulized into point cloud. We next introduce more details of each step. A A full technical report of MusicMapp can be found publicly [1].
Permission to make digital or hard copies of part or all of this work for personal or classroom use is granted without fee provided that copies are not made or distributed for profit or commercial advantage and that copies bear this notice and the full citation on the first page. Copyrights for third-party components of this work must be honored. For all other uses, contact the owner/author(s). MM ’18, October 22–26, 2018, Seoul, Republic of Korea © 2018 Copyright held by the owner/author(s). ACM ISBN 978-1-4503-5665-7/18/10. https://doi.org/10.1145/3240508.3241394
1253
Demo + Video + Makers' Program
2.1
MM’18, October 22-26, 2018, Seoul, Republic of Korea
Pre-Processing: Audio Feature Extraction
We use mel-spectrogram as the representation of songs in the preprocessing step. We generate the Mel-Spectrogram[7] of raw MP3 files, whereby we use 96 mel-bins with 256 frame hops at a sampling rate of 12000Hz, with the Fast Fourier Transform window size of 512 frames around each frame. The quasi-logarithmic spacing of mel-frequency scale roughly resembles the resolution of the human auditory system, making this a powerful representation for speech-related applications. The resulting vectorized features (of size 96x1366) constitutes a compact input feature space for training Deep CRNN next.
2.2
Learning High-Level Music Features
The spectrogram and song meta-data are fed to the neural network for extracting high-level features. The main challenge while training the neural network model is to ensure the learned features to be sufficiently discriminative, so that the song map is not too cluttered in some local regions. We propose to combine a gated recurrent neural network [2] with convolutional layers [8] aggregating lower level features, and the recurrent units fire if a particular high-level feature is sustained for a longer period of time, e.g. temporal features like legato, staccato and vibrato in vocals. The Deep CRNN converges fast in our training case with the ADAM solver and the softmax loss. The output of the CRNN, which are higher level features e.g. probabilities of song belonging to each of available genres, is fed to the visualization algorithms.
2.3
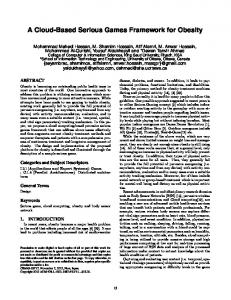
Figure 2: The MusicMapp cloud-based android application, with user interaction. A user can also see which other music regions other users are actively listening to, and this makes the experience a social one. MusicMapp also allows the user to tag favourite songs by placing pins on the map. We are also working on incorporating the popularity of the songs in the user’s play-list by highlighting the corresponding songs, to give the personalized MusicMapp a warm start.
Visualization and User Interface
We then look for interesting patterns in the softmax features, in order to generate a visually appealing and informative map. Our system incorporates dimensionality reduction techniques such as Principal Component Analysis[3], T-distributed Stochastic Neighbor Analysis[4] and Uniform Manifold Approximation and Projection ( UMAP) [5] to generate various maps based on the selected clustering criteria with regard to genres, sentiment in lyrics and mood [9]. MusicMapp efficiently captures nuances of music transition across various genres, e.g. Pop music gradually transitioning into hip-hop, rock transitioning into metal etc. Additionally, the user can interactively control the clustering/scattering of songs on MusicMapp, with hyper-parameters of UMAP and t-SNE like perplexity, no-of-neighbours, and the minimum distance between songs. Based on our user subjective survey on various maps, we find maps generated with UMAP to be more visually appealing to users, and set it as default.
3
Figure 3: Web interface for user interaction.
DEMONSTRATION Furthermore, we integrate the basic functionality of a music player into our application, providing users with a familiar interface to search for a particular song, browse traditional play-lists, among other features. There will also be a background demo of the neural network model and clustering algorithm in action, where the emphasis is to speed up the processing of massive songs at scale. The entire song collection is available on the cloud for the demo and we also plan to provide a web based interface (Fig 3) to the map which streams the songs online.
Fig 1 shows one example of generated music map per genres, using MusicMapp. We can provide more different maps of music generated based on different criteria. The user is able to touch points on the map to explore songs using a cloud based mobile application as shown in Fig 2. Songs on the map are initially depicted as grey-out points, and later get colour hues upon listening, leading to a personalized map of songs for a user as he explores the music on the system. MusicMapp assigns a different color for each category in the clustering.
1254
Demo + Video + Makers' Program
MM’18, October 22-26, 2018, Seoul, Republic of Korea
REFERENCES
[5] McInnes, Leland, and John Healy. ”UMAP: Uniform Manifold Approximation and Projection for Dimension Reduction.” arXiv preprint arXiv:1802.03426 (2018). [6] Kirell Benzi, Defferrard, Pierre Vandergheynst, and Xavier Bresson. ”FMA: A Dataset For Music Analysis” arXiv eprint arXiv:1612.0184 (2016). [7] ,McFee, Brian and Raffel, Colin and Liang, Dawen and Ellis, Daniel PW and McVicar, Matt and Battenberg, Eric and Nieto, Oriol.”librosa: Audio and music signal analysis in python”,in Proceedings of the 14th python in science conference,2015. [8] Van den Oord, Aaron and Dieleman, Sander and Schrauwen, Benjamin.”Deep content-based music recommendation”, In Advances in neural information processing systems, 2013. [9] , Y. Xiong and F. Su and Q. Wang. ”Automatic music mood classification by learning cross-media relevance between audio and lyrics”, In 2017 IEEE International Conference on Multimedia and Expo (ICME), 2017.
Rajan Varghese, Mohammed Habibullah Baig, [1] Jibin https://www.dropbox.com/s/v3gw01nag636b7e/Report.pdf [2] Choi, Keunwoo, Gyorgy Fazekas, Mark Sandler, and Kyunghyun Cho. ”Convolutional recurrent neural networks for music classification.”, In Acoustics, Speech and Signal Processing (ICASSP), 2017 IEEE International Conference on, pp. 2392-2396. IEEE, 2017. [3] S. Wold, K. Esbensen, and P. Geladi. ”Principal component analysis”, In Chemometrics and intelligent laboratory systems, 1987. [4] Maaten, Laurens van der, and Geoffrey Hinton. ”Visualizing data using t-SNE.”, In Journal of machine learning research Nov (2008): 2579-2605.
1255