Oncogene (2018) 37:1669–1684 https://doi.org/10.1038/s41388-017-0060-8
ARTICLE
Mutant p53 gain of function underlies high expression levels of colorectal cancer stem cells markers Hilla Solomon1 Nathan Dinowitz1 Ioannis S. Pateras2 Tomer Cooks3 Yoav Shetzer1 Alina Molchadsky1 Meital Charni1 Stav Rabani1 Gabriela Koifman1 Ohad Tarcic1 Ziv Porat4 Ira Kogan-Sakin1 Naomi Goldfinger1 Moshe Oren1 Curtis C. Harris3 Vassilis G. Gorgoulis2 Varda Rotter1 ●
●
●
●
●
●
●
●
●
●
●
●
●
●
●
●
1234567890();,:
Received: 11 September 2016 / Revised: 7 November 2017 / Accepted: 10 November 2017 / Published online: 18 January 2018 © The Author(s) 2018. This article is published with open access
Abstract Emerging notion in carcinogenesis ascribes tumor initiation and aggressiveness to cancer stem cells (CSCs). Specifically, colorectal cancer (CRC) development was shown to be compatible with CSCs hypothesis. Mutations in p53 are highly frequent in CRC, and are known to facilitate tumor development and aggressiveness. Yet, the link between mutant p53 and colorectal CSCs is not well-established. In the present study, we set to examine whether oncogenic mutant p53 proteins may augment colorectal CSCs phenotype. By genetic manipulation of mutant p53 in several cellular systems, we demonstrated that mutant p53 enhances colorectal tumorigenesis. Moreover, mutant p53-expressing cell lines harbor larger subpopulations of cells highly expressing the known colorectal CSCs markers: CD44, Lgr5, and ALDH. This elevated expression is mediated by mutant p53 binding to CD44, Lgr5, and ALDH1A1 promoter sequences. Furthermore, ALDH1 was found to be involved in mutant p53-dependent chemotherapy resistance. Finally, analysis of ALDH1 and CD44 in human CRC biopsies indicated a positive correlation between their expression and the presence of oncogenic p53 missense mutations. These findings suggest novel insights pertaining the mechanism by which mutant p53 enhances CRC development, which involves the expansion of CSCs sub-populations within CRC tumors, and underscore the importance of targeting these sub-populations for CRC therapy.
Introduction Colorectal cancer (CRC) is the third most frequent cause for cancer-related deaths in the world [1]. Its development is
Electronic supplementary material The online version of this article (https://doi.org/10.1038/s41388-017-0060-8) contains supplementary material, which is available to authorized users. * Varda Rotter
[email protected] 1
Department of Molecular Cell Biology, Weizmann Institute of Science, Rehovot, Israel
2
Molecular Carcinogenesis Group, Department of HistologyEmbryology, School of Medicine, University of Athens, Athens, Greece
3
Laboratory of Human Carcinogenesis, National Cancer Institute, National Institutes of Health, Bethesda, MD, USA
4
The Flow Cytometry Unit, Life Sciences Faculty, Weizmann Institute of Science, Rehovot, Israel
associated with series of defined genetic alterations that promote the transformation of normal epithelial mucosa into carcinoma, including aberrations in APC, K-Ras, and p53 [2, 3]. However, recent studies revealed inter-tumoral as well as intra-tumoral heterogeneity, associated with changes in gene expression or in epigenetics [1, 4]. This heterogeneity can be explained by the hierarchical model for cancer development, which predicts that only a small subset of cells within tumors, termed cancer stem cells (CSCs), has the ability to proliferate and propagate the tumor as well as to differentiate into various lineages [5]. Moreover, it is accepted that CSCs are the entity that endows tumors with chemotherapy resistance, and are responsible for tumor relapse [1, 6]. The epithelial homeostasis of the intestine relies on the presence of highly active normal stem cells in the bottom of the intestine crypt that self-renew, while generating new functional epithelia in high frequency [7]. However, when normal stem cells gain genetic or epigenetic modifications they can evolve into CSCs, leading to cancer development
1670
H. Solomon et al.
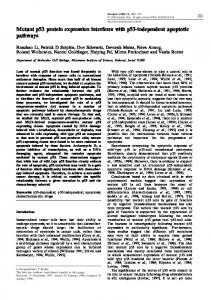
Fig. 1 Mutant p53 gain of function endows colorectal cancer cell lines with higher oncogenic potential. The colorectal adenocarcinomaderived cell line, SW480 that endogenously expresses mutant p53R273H,P309S was stably infected with shRNA against p53 (shp53) or with shRNA against nonspecific sequence (shCon), as a control. a Western Blot displays mutant p53 protein levels. GAPDH serves as loading control. This figure combines two independent detections of p53 and GAPDH of the same gel. The two original images are presented in Supplementary Figure 1. b The shCon and shp53 SW480 cell lines (2 × 10⁵ or 1 × 10⁴) were injected into left and right limb of nude mice, respectively, followed by tumor growth surveillance. After 8–10 weeks mice were sacrificed and tumors size was measured. Asterisks denotes statistical significance (p < 0.01, n = 6). c Three independent newly infected shCon and shp53 SW480 cell lines were mixed and were injected (7 × 10⁵) into left and right limb of nude mice, respectively, followed by tumor growth surveillance. After 5 weeks mice were sacrificed and tumors weight was measured.
Asterisks denotes statistical significance (p < 0.05, n = 5). d Photos of tumors presented in c that illustrate the significant differences in the size of tumors obtained from injection of shCon and shp53 SW480 cells. e The established SW480 cell lines were treated with 5-FU (50 µM) for 72 h, followed by AnnexinV staining and ImageStream X analysis (Materials and methods). Graph in left panel indicates on percentage of apoptotic cells upon 5-FU treatment, normalized to NT cells. Right panel is a representative photo of an apoptotic cell. f RKO isogenic cell lines that express either WTp53 (RKO+/+) or mutant p53R248W (RKO+/m), or knocked-out for p53 (RKO−/−) [20] were treated with cisplatin (2.5 µg/ml) for 72 h, followed by AnnexinV staining and ImageStream X analysis. Graph in left panel indicates on percentage of apoptotic cells upon cisplatin treatment, normalized to NT cells. Right panel is a representative photo of an apoptotic cell. Graphs represent an average of three experiments. Error bars represent SE. Asterisk denotes statistical significance. For more representative photos obtained by ImageStream X see Supplementary Figure 13 A–B
[6, 8]. Thus, to maintain normal homeostasis, stem cells of the intestine system must be tightly regulated. The tumor-suppressor p53 was found to ensure the quality and genomic stability of stem cells; hence, it serves as barrier to CSCs formation [6]. Its intact functionality is crucial for the maintenance of healthy cells and tissues, thus it is not surprising that p53 is the most frequently mutated gene in human cancer [9]. When mutated, p53 does not only lose its tumor-suppressive functions, rather it gains additional oncogenic functions, a phenomenon termed mutant p53 gain of function (GOF). Ample experimental evidence suggest that mutant p53 GOF mediates oncogenic properties such as sustained proliferation, cell death resistance, invasion and metastasis, and tumor-promoting inflammation [10–12]. p53 was found to be mutated in about 40 percent of CRC cases. The most frequently mutated codons in p53 are 175, 248, and 273 (IARC TP53 Database R18, April 2016) [13]. Interestingly, these missense mutations belong to two p53
mutations sub-groups that define p53 mutation type according to their impact on the DBD folding; “DNA-contact mutations” (R248, R273), and the “p53 conformational mutations” (R175) [14]. Indeed, it is well-accepted that mutant p53 plays an important role in CRC development [3]. Accordingly, we previously found that mutant p53 promotes inflammation-associated colorectal cancer [15]. Accumulated data suggest that mutant p53 facilitates the acquisition of CSCs phenotype. This can be deduced by the correlation between mutant p53 and undifferentiated tumors [16] as well as by the malignant phenotype of induced pluripotent stem cells (iPSCs) generated upon reprogramming of mutant p53-expressing mouse embryonic fibroblasts (MEFs) [17]. Interestingly, CSCs properties such as drug resistance and enhanced metastasis seem to interweave with mutant p53 GOF activities [11, 18]. In all, we hypothesized that mutant p53 promotes colorectal tumorigenesis by expanding colorectal CSCs subpopulation.
Mutant p53 augments colorectal cancer stem cells
Here, we manipulated mutant p53 expression in tumorderived colorectal cell lines and examined its effect on CSCs subpopulation and on tumor aggressiveness. As expected, we found that mutant p53 promotes the tumorigenic potential of colorectal cells as well as confers them with drug resistance. Then, to study the effect of mutant p53 on colorectal CSCs, we examined the expression of three well-established colorectal CSCs markers, Lgr5, ALDH, and CD44 [19] in colorectal cell lines as well as in intestinal organoid, representing a more physiological system. We found that mutant p53-expressing cells harbor larger CD44Br, Lgr5Br as well as activated ALDH (ALDHBr) subpopulations compared with p53-deficient cells. Our data suggest that ALDHBr subpopulation within mutant p53expressing cells exhibit self-renewal capacity, and that the chemotherapy resistance that is induced by mutant p53 is mediated by ALDH. Moreover, we demonstrate that mutant p53 induces the expression of CD44, Lgr5, and ALDH by binding to their promoters. Finally, these data were corroborated in human colorectal tumors, in which we found positive correlation between the presence of mutant p53 and ALDH1 as well as CD44 expression. Our data suggest that the enhanced CRC aggressiveness conferred by mutant p53 is mediated by augmented CSCs phenotype.
Results Mutant p53 gain of function endows colorectal cancer cell lines with higher oncogenic potential It is well-accepted that mutant p53 possesses GOF activities that confer cells with oncogenic potential [10]. Here, we aimed to examine the tumorigenic potential of mutant p53 in colorectal tumor-derived cell lines. To this end, the colorectal adenocarcinoma-derived cell line, SW480, endogenously expressing mutant p53R273H,P309S, was stably introduced with either shRNA against p53 (shp53) to knock-down mutant p53R273H,P309S expression, or as a controls with shRNA against nonspecific sequence (shCon) (Fig. 1a; Supplementary Figure 1, Supplementary Figure 2A) as well as shRNA control against lacZ gene (sh-lacZ) (Supplementary Figure 2A). As a first step, we aimed to evaluate whether mutant p53 confers SW480 cells with tumorigenic potential in vivo. The established SW480 cell lines were injected subcutaneously into immunecompromised mice, followed by tumor growth surveillance. Strikingly, shCon and sh-lacZ cell lines induced detectable tumors, while shp53 cell line gave rise to significantly smaller or undetectable tumors (Fig. 1b–d; Supplementary Figure 2). These results indicate that reduction in mutant p53R273H,P309S protein levels attenuates the
1671
tumorigenic potential of the cells and further supports the notion that mutant p53 expression facilitates tumorigenesis in vivo. An additional oncogenic characteristic mediated by mutant p53 GOF is drug resistance [10]. To challenge this issue we have exposed the shCon and shp53 SW480 cell lines to chemotherapy and assessed their resistance to apoptosis. SW480 cells were treated with the chemotherapy agent, 5-FU, followed by AnnexinV staining. The percentage of apoptotic cells was assessed by ImageStream X that combines fluorescence-activated cell sorting (FACS) with microscopy. This instrument allows visualizing all analyzed cells and assesses staining statistics (Fig. 1e). The results obtained show that knockdown of mutant p53R273H,P309S (shp53) significantly increased apoptosis following chemotherapy treatment compared with that seen in the shCon cells, suggesting that mutant p53R273H,P309S protects cells from chemotherapy-induced apoptosis. To corroborate these results in additional colorectal cellular system, we examined the sensitivity of the RKO isogenic cell lines to chemotherapy. RKO cells that endogenously express wild-type p53 (RKO+/+), and their counterparts that were either introduced with mutant p53R248W (RKO+/m), or knockedout for p53 (RKO−/−) [20] were treated with the chemotherapy agent cisplatin, followed by AnnexinV staining and analysis of apoptosis by ImageStream X (Fig. 1f). The results indicate that introduction of mutant p53R248W to RKO cells significantly reduced apoptosis following chemotherapy treatment compared with both RKO+/+ and RKO−/− cells. This findings support the results obtained from SW480 experiments, thus overall suggesting that mutant p53 protects cells from chemotherapy-induced apoptosis in a GOF manner. To further validate that mutant p53 GOF endows cells with drug resistance we stably introduced mutant p53R175H to H1299 cells that are null for p53 (Supplementary Figure 3) and evaluated their sensitivity to chemotherapy. The established H1299 cells were treated with cisplatin followed by detection of poly (ADP-ribose) polymerase (PARP-1) cleavage that is important for apoptosis [21] (Supplementary Figure 3). In accordance with the colorectal cell lines, mutant p53R175Hexpressing H1299 cells exhibited reduced levels of PARP-1 cleavage compared with the null cells (Supplementary figure 3). Altogether, these data further support the conclusion that mutant p53 enhances the oncogenic characteristics of cancer cell lines in a GOF manner.
Mutant p53-expressing colorectal cancer cell lines possess augmented CSCs sub-populations CRC development is compatible with the CSCs concept, whereby a small cellular subpopulation within tumors (i.e., CSCs) has accentuated tumorigenic potential that initiates
1672
H. Solomon et al.
Fig. 2 Mutant p53-expressing cells contain larger CD44Br and Lgr5Br sub-populations a, b RKO isogenic cell lines were immuno-stained with anti-Lgr5 antibody and the size of Lgr5Br sub-population was measured by ImageStream X. a Graph presenting an averaged percentage of Lgr5Br cells obtained from three independent experiments. Error bars represent SE. b Representative photo of Lgr5Br cell. c Organoids were produced from intestinal epithelial cells extracted from WTp53, p53 knock-out (p53 KO), or WTp53/mutant p53R172H heterozygous mice, as previously described [15]. Lgr5 mRNA expression levels were measured by qRT-PCR using specific primers. Graph represents an average of three independent organoids pools. Error bars represent SE. d RKO isogenic cell lines were immunostained with either anti-CD44 antibody that recognizes all CD44 isoforms and the size of CD44Br subpopulation was measured by FACS. Left: Graph presenting an averaged percentage of CD44Br cells
obtained from three experiments. Error bars represent SE. Right panel shows representative dot plots indicating on percentage of CD44Br sub-populations. e–g The established shCon and shp53 SW480 cells were immuno-stained with either anti-CD44 antibody that recognizes all CD44 isoforms and the size of CD44Br subpopulation was measured by ImageStream X. e Graph presenting an averaged percentage of CD44Br cells obtained from four experiments. f Representative plot of the mean pixel intensity of membranal CD44 in shCon and shp53 cell populations. g Representative photo of CD44Br cell obtained by ImageStream X. For more representative photos obtained by ImageStream X see Supplementary Figure 13 C–D. h mRNA expression levels of CD44 in the established SW480 tumors were measured by qRT-PCR using specific primers. Asterisk denotes statistical significance
and maintains tumor development [22]. Thus, we hypothesized that the tumorigenic effects presented in mutant p53-expressing colorectal cell lines might be due to an increased CSCs subpopulation. It was reported that three bona fide markers for cancerous colon stem cells; CD44, Lgr5, and ALDH are highly expressed during the progression to carcinoma [19] and are associated with shorter time
to disease recurrence [1]. Accordingly, we next examined whether the mutant p53-expressing colorectal cell lines also harbor larger Lgr5Br, CD44Br, and ALDHBr subpopulations. The RKO isogenic cell lines were immunostained with anti-Lgr5 antibody followed by evaluation of the size of Lgr5Br subpopulation by ImageStream X analysis (Fig. 2a, b). The results indicate on a significantly larger
Mutant p53 augments colorectal cancer stem cells
1673
Fig. 3 Mutant p53 induces larger ALDHBr subpopulation. The RKO isogenic cell lines (a) and established shCon and shp53 SW480 cells (b) were subjected to ALDH activity assay and the size of ALDHBr subpopulation was measured by FACS. Left panels show dot plots of representative experiment indicating on percentage of ALDHBr cells. Right panels show graphs of averaged percentage of ALDHBr cells obtained from three experiments. Error bars represent SE. c SW480 cell line endogenously expressing mutant p53R273H,P309S was sorted by FACS according to ALDH activity levels. Then, the sorted populations were incubated in suspension under serum free spheroids promoting media. Following 2 weeks spheroids were counted via microscopic examination. Graph represents an averaged number of spheres detected in three experiments. Right panels are photos of representative fields. d–f mRNA expression levels of ALDH1A3 in RKO cell lines
(d), ALDH1A1 in SW480 cell lines (e), and ALDH1A1 in the established SW480 tumors (f) were measured by qRT-PCR using specific primers. g–i MEFs that were extracted from wild-type p53 mice (+/+), p53 KO mice (−/−), and mutant p53R172H knock-in mice (m/m) were subjected to standard reprogramming protocol [31] followed by measurement of mRNA expression levels of Nanog g, ALDH1A1 h and ALDH3A1 i by qRT-PCR using specific primers. j ChIP analysis of SW480 cells. Endogenous mutant p53 protein was immunoprecipitated using p53-specific antibody (anti-p53 Ab). Empty beads were used as a negative control (Beads only). qRT-PCR was performed using specific primers directed to ALDH1A1, CD44 and Lgr5 promoters. Values were normalized to 1% input. Results are average of three experiments. Error bars represent SE. Asterisk denotes statistical significance
Lgr5Br cell subpopulation in mutant p53-expressing RKO cells (RKO+/m) compared with both RKO+/+ and RKO −/− cells (Fig. 2a, b). Thus, these data suggest that mutant p53 augments the Lgr5Br subpopulation. Growing body of evidence suggest that Lgr5+ cells extracted from murine intestine have the potential to create an in vitro 3-dimensional crypt–villus structure organoids that are enriched with stem cells and fully resemble the intestine [23–25]. To determine whether mutant p53 affects Lgr5Br levels also in a more physiological system, we examined organoids that were established from intestinal epithelial cells extracted from wild-type p53 (+/+), p53 knock-out (−/−), and p53 heterozygous mice-expressing mutant p53R172H (the mouse equivalent to human p53R175H) and wild-type p53 alleles (+/m) [15]. Our analysis indicate that organoids that were generated from heterozygous mice displayed significantly increased Lgr5 transcription compared with organoids generated from wild-type or p53
knock-out mice (Fig. 2c). These results are in accordance with the results obtain from RKO cell lines and together suggest that mutant p53 induces Lgr5 levels in intestinal cells. Next, to assess the size of RKO cellular subpopulation highly expressing CD44 (CD44Br), we immuno-stained the RKO cells with anti-CD44 antibody, followed by FACS analysis. As indicated in Fig. 2d, mutant p53R248W knock-in RKO cells (RKO+/m) exhibited larger CD44Br subpopulation compared with the wild-type p53 (RKO+/+) and knock-out (RKO−/−) counterparts. To corroborate these data, we immuno-stained the established SW480 cells with anti-CD44 antibody and analyzed CD44 levels by the ImageStream X instrument. In accordance with RKO cells, knocking-down the endogenous mutant p53R273H,P309S (shp53) in SW480 cell line lead to reduction in the size of CD44Br subpopulation (Fig. 2e–g). Furthermore, we measured the mRNA expression levels of CD44 in tumors that
1674
were generated upon injection of the established SW480 shCon and shp53 cell lines into immuno-deficient mice (Fig. 1c, d). The obtained results indicate on lower expression of CD44 in tumors generated from mutant p53 knock-down cells (shp53) compared with those endogenously expressing mutant p53 (shCon) (Fig. 2h). In all, these results suggest a positive correlation between mutant p53 and CD44 expression in CRC. Finally, we examined the effect of mutant p53 on ALDH levels in the various colorectal cancer cell lines and tumors. ALDH is a detoxifying enzyme that serves as a main marker for colorectal CSCs [19]. Notably, it mediates drugresistance activities [26] and its high levels predict poor prognosis and cancer relapse [27, 28]. Thus, next we examined the size of the cell subpopulation that displays high-ALDH activity (ALDHBr) within the RKO isogenic cell lines. We found that mutant p53R248W-expressing cells (RKO+/m) display larger ALDHBr subpopulation compared with their wild-type p53 and p53 KO counterparts (RKO+/+ and RKO−/−, respectively) (Fig. 3a). We further estimated the size of ALDHBr subpopulation in the established SW480 cell lines, and found that shp53 cells harbor significantly reduced ALDHBr subpopulation compared with shCon cells (Fig. 3b). This suggests that mutant p53 mediates the expansion of the ALDHBr subpopulation within CRC cell lines. A typical feature of CSCs is their ability to form floating spheres in culture [26, 29]. To validate that the ALDHBr subpopulation is indeed enriched with CSCs, we measured their ability to generate spheroids in vitro. Therefore, using FACS we isolated SW480 shCon cells with either high or low ALDH activity, and then measured ALDH1A1 mRNA expression levels to validate the efficiency of sorting. Indeed, ALDH1A1 levels were found to be higher in ALDHBr subpopulation compared with the ALDH negative (ALDH−) subpopulation and the whole cell line population (Supplementary Figure 4). The isolated cellular subpopulations were cultured in suspension, in serum free media optimized for spheroids maintenance. Following 2 weeks of cultivation the ALDHBr cells gave rise to a markedly larger number of typical floating spheres (Fig. 3c). This suggests that within the general mutant p53-expressing SW480 cell line population ALDHBr cells possess selfrenewal capacity, and constitute the CSCs compartment. Next, we aimed to examine whether ALDH mRNA expression is regulated by mutant p53. ALDH1A1, ALDH1A3, and ALDH3A1 were suggested to have an important functional role in CSCs [26]. Accordingly, we evaluated the mRNA expression levels of ALDH1A1 and ALDH1A3 in the SW480 and RKO cellular systems, and found that both members are expressed in both cellular systems. Notably, while ALDH1A1 levels were increased in SW480 shCon cells compared with shp53 cells (Fig. 3e),
H. Solomon et al.
ALDH1A3 expression was higher in RKO+/m and RKO −/− cells compared with wild-type p53 (RKO+/+) counterparts (Fig. 3d). To further validate that ALDH induction could be dependent on mutant p53 GOF we examined the mRNA levels of ALDH genes in the established H1299 cells (Supplementary Figure 5). Higher levels of ALDH1A1 and ALDH1A3 were detected in mutant p53R175H-expressing cells compared with p53 null cells, suggesting that the elevated levels of ALDH genes in H1299 is mediated by mutant p53 GOF. Finally, we measured the mRNA expression levels of ALDH1A1 in tumors that were generated upon injection of the established SW480 into nude mice (Fig. 1c, d). The results indicate on elevated expression of ALDH1A1 in tumors generated from mutant p53expressing cells (shCon) compared with tumors derived from SW480-expressing shp53 cells (Fig. 3f). This finding further supports the positive correlation between mutant p53 and ALDH1A1 expression observed in our in vitro models. All in all, these data suggest that mutant p53-expressing CRC cell lines possess larger cellular sub-populations that display high-ALDH activity, thus suggesting larger CSCs subpopulation that may account for their higher tumorigenic potential and drug resistance. Next, we aimed to exclude the possibility that the results described above pertaining the induced ALDH levels in mutant p53-expressing cell lines and their stable shp53 derivatives are due to additional genetic modifications that may arise following prolonged culturing. Therefore, we transiently knocked-down mutant p53R273H,P309S from SW480 cells using specific siRNA oligonucleotides (Supplementary Figure 6A) and measured the size of ALDHBr subpopulation by FACS (Supplementary Figure 6B). The results indicated that transient silencing of mutant p53R273H, P309S (p53i) reduced the size of ALDHBr subpopulation within the original SW480 cell line (siCon). To further assess whether the endogenous mutant p53R273H,P309S expressed in the SW480 cell line mediates the induction of ALDH1A1 expression, we adopted CRISPR/Cas9 technology to knock-out mutant p53R273H,P309S expression. To this end, we established two CRISPR-derived cell lines; CRISPR control, which expresses the endogenous mutant p53R273H,P309S and CRISPR p53 cell line, in which mutant p53R273H,P309S was knocked-out (Supplementary Figure 7A). Consistent with our p53 knock-down experiments using both p53-specific shRNA and p53-specific siRNA, CRISPR p53 cells exhibited significantly reduced expression of ALDH1A1 (Supplementary Figure 7B), suggesting that mutant p53R273H,P309S induces ALDH1A1 expression. In all, the results obtained from three independent mutant p53R273H,P309S silencing systems (i.e., shRNA, siRNA and CRISPR/Cas9) showed reduction in ALDH1A1 mRNA expression and diminished ALDHBr subpopulation, thereby
Mutant p53 augments colorectal cancer stem cells
1675
Fig. 4 Mutant p53-dependent chemotherapy resistance is mediated by ALDH. a, b the established shCon and shp53 SW480 and the RKO isogenic cell lines were treated with cisplatin (2.5 µg/ml) for 72 h. mRNA levels of ALDH1A1 a and ALDH1A3 b were measured in SW480 and RKO, respectively, by qRT-PCR using specific primers. c, d The established shCon and shp53 SW480-expressing mutant p53R273H,P309S were transiently transfected with pcDNA3-HA-ADH to over-express ALDH1A1. Following 24 h, cells were treated with cisplatin (2.5 µg/ml) for additional 72 h. Then, cells were collected and
subjected to AnnexinV staining and to ImageStream X analysis. Right panel indicates on percentage of dead cells. c mRNA levels of ALDH1A1 indicating on successful transfection, resulting in ALDH1A1 over-expression in the cells. d Graph indicating on percentage of apoptotic cells upon cisplatin treatment, normalized to NT cells. All graphs represent an average of three experiments. Error bars represent SE. Asterisk denotes statistical significance. OE overexpression. For more representative photos obtained by ImageStream X see Supplementary Figure 13E
supporting the conclusion that mutant p53 mediates ALDH induction. It is suggested that the origin of CSCs might be dedifferentiation of somatic cells [16], a process that is represented by cellular reprogramming [30]. Moreover, we previously found that reprogramming of mutant p53expressing MEFs lead to the generation of malignant iPSCs that can be referred as CSCs [17]. Thus, we next examined whether higher ALDH levels can be detected in mutant p53-expressing iPSCs. MEFs that were extracted from wild-type p53 mice (+/+), p53 KO mice (−/−) and mutant p53R172H KI mice (m/m) were subjected to a standard reprogramming protocol [31]. As a first step Nanog mRNA expression levels were examined to validate the stemness of the generated iPSCs (Fig. 3g). The Nanog expression levels were comparable to those of embryonic
stem cells (ESCs) and significantly higher than in MEFs, indicating successful reprogramming (Fig. 3g). ALDH1A1 and ALDH3A1 expression levels were markedly elevated in mutant p53-expressing iPSCs, compared with WTp53 (+/+) and p53 KO (−/−) iPSCs (Fig. 3h, i, respectively). This indicates that mutant p53 enhances ALDH expression in iPSCs, suggesting a positive correlation between mutant p53, ALDH levels and the generation of malignant CSCs. Finally, to further decipher the mechanism underlying mutant p53-dependent induction of ALDH1A1 we first examined whether mutant p53-dependent induction of ALDH1A1 expression results from transcriptional activation of ALDH1A1 promoter. For that purpose, genomic fragment of 1 kb of ALDH1A1 promoter was fused to luciferase reporter and the vector was introduced into the established shCon and shp53 SW480 cell lines. As depicted
1676
H. Solomon et al.
Fig. 5 Mutant p53 correlates with elevated ALDH levels in patients with colorectal carcinoma. Tumor biopsies obtained from sporadic colorectal carcinoma patients were immuno-stained for ALDH and p53, and underwent TP53 sequencing. a Diagrammatic presentation of the status of ALDHA1 along with the TP53 sequencing data for every individual case. LI labeling index. b Representative photos of ALDH
and p53 staining showing increased ALDH levels in a mutant p53 case compared to a WTp53 one. Arrows denote positive ALDH staining. Scale bar: 100 μm. c Cases with missense mutations of p53 exhibit increased ALDH levels vs. WTp53 + indel ones. Asterisk denotes statistical significance (p-value < 0.05)
in Supplementary Figure 8, mutant p53R273H,P309S-expressing cells showed higher luciferase activity than shp53 cells. This finding suggests that mutant p53 induces ALDH1A1 expression by activating its promoter. Next, we examined whether the induction of the CSCs markers involves the interaction of mutant p53 with their promoters. To this end, we performed chromatin immuno-precipitation (ChIP) assay on SW480-expressing p53R273H,P309S and SK-BR-3 cell line, expressing mutant p53R175H. We detected enrichment of ALDH1A1, CD44, and Lgr5 promoter sequences upon immune-precipitated mutant p53 using specific antibody (Fig. 3j; Supplementary Figure 9). These results suggest that the enhanced levels of ALDH1A1, CD44, and Lgr5 observed in mutant p53-expressing cells may be
mediated by mutant p53 binding to ALDH1A1, CD44, and Lgr5 promoters.
Mutant p53-dependent cell death resistance is mediated by ALDH It was reported that CSCs may facilitate drug resistance by activating ALDH [26]. Notably we observed that mutant p53 endows CRC tumor cells with drug resistance (Fig. 1e, f; Supplementary Figure 3) and induces increased ALDH expression and activity. Therefore, we hypothesized that ALDH is involved in the mutant p53-induced drug resistance. To examine this hypothesis, the established SW480 and RKO isogenic cell lines with different p53 status were treated with cisplatin and the mRNA levels of ALDH1A1
Mutant p53 augments colorectal cancer stem cells
and ALDH1A3 were estimated. Chemotherapy treatment resulted in marked induction of ALDH1A1 and ALDH1A3 expression levels (Fig. 4a, b). Notably, ALDH1A1 and ALDH1A3 expression reached to higher levels in mutant p53-expressing cells than in mutant p53-deficient cells, demonstrating the contribution of ALDH for mutant p53mediated chemoresistance. To further examine whether ALDH1A1 promotes the mutant p53-dependent cell death resistance, we over-expressed ALDH1A1 in the established SW480 cell lines by transient transfection (Fig. 4c) followed by treatment with cisplatin and AnnexinV staining. Then, to assess apoptosis levels, cells were analyzed by ImageStream X. Our analysis revealed that ALDH1A1 over-expression significantly inhibited apoptosis in SW480 cells (Fig. 4d), suggesting that ALDH1A1 is involved in mutant p53-mediated chemoresistance of SW480 cells.
Human colorectal carcinomas harboring p53 missense mutations display elevated proteins levels of ALDH and CD44 Human CRC is characterized with frequent recurrence following conventional therapy. It is well-accepted that the CSCs entity within tumors underpins chemoresistance and tumor relapse [1]. In addition, it was found that CRC exhibit high frequency of p53 mutations. Based on these notions we set out to investigate whether our observations that mutant p53 GOF is correlated with high levels of CSCs markers also applies to human CRC biopsies. Therefore, paraffinembedded tissues of human CRC tumors biopsies obtained from either sporadic colorectal carcinoma patients or colitisassociated colorectal carcinoma patients were subjected to p53 gene sequencing along with immunohistochemistry analysis of CD44, ALDH, and p53. Since p53 missense mutations endow oncogenic GOF activities [10], for the analysis we divided the tumors to two groups; WTp53/indel and p53 missense mutations. Strikingly, we observed that ALDH levels were markedly higher in both sporadic and colitis-associated CRC tumors expressing p53 missense mutations compared with tumors expressing WTp53/indel mutations (Fig. 5a–c; Supplementary Figure 10A-B). Additionally, we could detect positive correlation (Pearson correlation coefficient is ρ = 0.53) between p53 and ALDH labeling index in colitis-associated colorectal carcinoma samples (Supplementary Figure 10c). As intense p53 staining in tumor biopsies usually indicates mutant p53 expression, this result might suggest a positive correlation between high-ALDH levels and mutant p53 expression. In line with our finding pertaining ALDH expression in CRC tumors our analysis indicated that tumor samples expressing p53 missense mutations tend to exhibit higher levels of CD44 (Supplementary Figure 11).
1677
Interestingly, when we analyzed patients’ disease characteristics, we revealed that tumors expressing p53 missense mutations are associated with more aggressive cancer. Specifically, tumors expressing p53 missense mutations are more invasive (Supplementary Figure 12a), and patient harboring tumors expressing p53 missense mutations exhibited distant metastasis in higher frequency (Supplementary Figure 12b) and in more regional lymph nodes (Supplementary Figure 12C), compared with that observed in patients harboring WTp53/indel-expressing tumors. In general tumors expressing p53 missense mutations were defined as grade III and IV in higher frequency than WTp53/indel-expressing tumors (Supplementary Figure 12D). This was even more pronounced in patient harboring tumors expressing both p53 missense mutations and high levels of ALDH (>1.5 LI) compared with those expressing p53 missense mutations and lower levels of ALDH LI (Supplementary Figure 12E-H). Finally, the survival after adjuvant therapy of patients that harbor tumors expressing p53 missense mutations and higher ALDH (>1.5 LI) was in lower frequency than in patient harboring tumors expressing p53 missense mutations and lower ALDH (