Keywords: Software Product Lines, Test Configuration Generation, Search-. Based Software Engineering, Mutation, Feature Models. 1 Introduction. Software ...
Mutation-based Generation of Software Product Line Test Configurations Christopher Henard, Mike Papadakis, and Yves Le Traon Interdisciplinary Centre for Security, Reliability and Trust (SnT) University of Luxembourg, Luxembourg {christopher.henard, michail.papadakis, yves.letraon}@uni.lu
Abstract. Software Product Lines (SPLs) are families of software products that can be configured and managed through a combination of features. Such products are usually represented with a Feature Model (FM). Testing the entire SPL may not be conceivable due to economical or time constraints and, more simply, because of the large number of potential products. Thus, defining methods for generating test configurations is required, and is now a very active research topic for the testing community. In this context, mutation has recently being advertised as a promising technique. Mutation evaluates the ability of the test suite to detect defective versions of the FM, called mutants. In particular, it has been shown that existing test configurations achieving the mutation criterion correlate with fault detection. Despite the potential benefit of mutation, there is no approach which aims at generating test configurations for SPL with respect to the mutation criterion. In this direction, we introduce a search-based approach which explores the SPL product space to generate product test configurations with the aim of detecting mutants.
Keywords: Software Product Lines, Test Configuration Generation, SearchBased Software Engineering, Mutation, Feature Models
1
Introduction
Software Product Lines (SPLs) extend the concept of reusability by allowing to configure and build tailored software product through a combination of different features [1]. Each feature represents a functionality or an abstraction of a functional requirement of the software product and is itself built from components, objects, modules or subroutines. Thus, an SPL is defined as a family of related software products that can easily be configured and managed, each product sharing common features while having specific ones. The possible products of an SPL are usually represented through a Feature Model (FM) which defines the legal combination between the features of the SPL, facilitates the derivation of new products and enables the automated analysis of the product line [2]. SPLs bring many benefits such as code resuability, a faster time to market, reduced costs and a flexible productivity [3]. However, SPLs are challenging to
test due to the large amount of possible software that can be configured [4]. For instance, 20 optional features lead to 220 possible products to configure, meaning more than a million of different software product that should be tested independently. Such a testing budget is usually unavailable for economic, technical or time reasons, preventing the SPL from being exhaustively tested. Thus, defining methods for generating test suites while giving enough confidence in what is tested is required, and is now a very active research topic for the testing community [5,6,7]. In this respect, Combinatorial Interaction Testing (CIT) [8] is a popular technique that has been applied to SPLs to reduce the size of the test suites. CIT operates by generating only the product configurations exercising feature interactions. While CIT has been shown to be effective for disclosing bugs [9,10], recent work has shown mutation as a promising alternative to the CIT criterion, also correlating with fault detection [11] for existing test suites. Mutation evaluates the effectiveness of a test suite in terms of its ability to detect faults [12]. It operates by first creating defective versions of the artifact under test, called mutants and then by evaluating the ability of the test suite to detect the introduced mutants. Mutation has been identified as a powerful technique in several work, e.g., [13,14]. In this paper, defective versions of the FM are produced. A mutant is thus an altered version of the rules defining the legal feature associations. Such mutants are useful as they represent faulty implementations of the FMs that should be tested. Thus, while CIT measures the number of feature interactions of the FM exercised by the test suite, mutation measures the number of mutants detected by the test suite. However, and despite the potential benefit of mutation, there is no approach with the purpose of generating product configurations for SPL with respect to the mutation criterion. Towards this direction, we devise the first approach which generates SPL test configurations using mutation of the FM. Since the SPL product space is too large to be exhaustively explored, we introduce a search-based technique based on the (1+1) Evolutionary Algorithm (EA) [15,16] in conjunction with a constraint solver in order to only deal with products that are conform to the FM. In order to guide the search towards the detection of mutants, four search operators are proposed to both add and remove test configurations from the test suite. The proposed approach solves the challenge of generating a test suite with respect to the mutation criterion. Experiments on 10 FMs show the ability of the proposed approach to generate test suites while with the purpose of mutation. The remainder of this paper is organized as follows. Section 2 introduces the background concepts underlying the proposed approach. Section 3 describes the approach itself. Section 4 presents the conducted experiments. Finally, Section 5 discusses related work before Section 6 concludes the paper.
2 2.1
Background Software Product Line Feature Models
A Feature Model (FM) encompasses the different features of the SPL and the constraints linking them. Thus, it defines the possible products that can be
configured in an SPL. For instance, consider the FM of Figure 1. It contains 9 features. Some features are mandatory, which means included in every software product, e.g., Draw. There are other type of constraints for the features, such as implications or exclusion. For example, the presence of the Color feature in the software product requires the Color Palette one to be present too. The FM can be represented as a boolean formula. In this paper, each constraint is represented in Conjunctive Normal Form (CNF). Such formulas are a conjunction of n clauses C1 , ..., Cn , where a clause is a disjunction of m literals. Here, a clause represents a constraint between features of the FM and a literal represent a feature that is selected (fj ) or not (fj ): FM =
n ^
m _
i=1
j=1
|
! lj , where lj = fj or fj .
{z
}
constraints
For instance, the FM of Figure 1 encompasses n = 18 constraints represented as follows in Conjunctive Normal Form: f1 , (f2 ∨ f1 ), (f1 ∨ f2 ), (f3 ∨ f1 ), (f1 ∨ f3 ), (f4 ∨ f1 ), (f5 ∨ f1 ), (f1 ∨ f5 ), (f6 ∨ f3 ), (f7 ∨ f3 ), (f3 ∨ f6 ∨ f7 ), (f8 ∨ f5 ), (f9 ∨ f5 ), (f5 ∨ f8 ∨ f9 ), (f8 ∨ f9 ), (f7 ∨ f4 ), (f4 ∨ f8 ), (f9 ∨ f4 ), where RasterGraphicsEditor 7→ f1 , Draw 7→ f2 , Selection 7→ f3 , ColorP alette7→ f4 , Rendering 7→ f5 , Rectangular 7→ f6 , ByColor 7→ f7 , BlackW hite 7→ f8 , Color 7→ f9 .
Thus, with respect to the FM of Figure 1, the corresponding boolean formula is a conjunction between all the constraints: FM = f1 ∧(f2 ∨f1 )∧(f1 ∨f2 )∧(f3 ∨f1 )∧(f1 ∨f3 )∧(f4 ∨f1 )∧(f5 ∨f1 )∧(f1 ∨f5 )∧(f6 ∨f3 )∧(f7 ∨ f3 )∧(f3 ∨f6 ∨f7 )∧(f8 ∨f5 )∧(f9 ∨f5 )∧(f5 ∨f8 ∨f9 )∧(f8 ∨f9 )∧(f7 ∨f4 )∧(f4 ∨f8 )∧(f9 ∨f4 ).
2.2
Software Product Line Test Configurations
We denote as a test configuration (TC) or product configuration to test the list of features of the FM that are present or not in a given product. For instance, with RasterGraphicsEditor
Draw
Selection
Rectangular
ColorPalette
ByColor
Rendering
BlackWhite
Mandatory
Or
Requires
Optional
Exclusive Or
Excludes
Color
Fig. 1. A Feature Model of a raster graphic editor Software Product Line
respect to Figure 1, T C1 = {f1 , f2 , f3 , f4 , f5 , f6 , f7 , f8 , f9 } is a TC representing the software product proposing all the features except the rectangular selection and the black and white rendering. This TC satisfies the constraints of the FM that are described in the previous subsection. On the contrary, T C2 = {f1 , f2 , f3 , f4 , f5 , f6 , f7 , f8 , f9 } violates the constraint which specifies that f2 = Draw is a mandatory feature. In the remainder of this paper, only TCs satisfying the constraints of the FM are considered. To this end, a satisfiability (SAT) solver is used. Finally, we denote as test suite (TS) a set of TCs.
3
Mutation-based Generation of Software Product Line Test Configurations
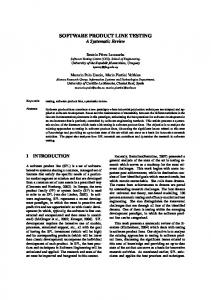
The approach for generating TCs starts by creating mutants of the SPL FM. Then, a search-based process based on the (1+1) Evolutionary Algorithm (EA) [15,16] makes use of both the FM and the mutants to produce a set of test configurations. The (1+1) EA is a hill climbing approach which has been proven to be effective in several studies [17,18]. The overview of the approach is depicted in Figure 2. The following sections describe the different steps of the approach. 3.1
Creation of Mutants of the Feature Model
The first step of the approach creates altered versions of the FM. Each altered version is called a mutant and contains a defect within the boolean formula of the FM. For instance, the two following mutants are produced from the FM example of Figure 1: M1 = H
f1 ∧(f2 ∨f1 )∧(f1 ∨f2 )∧(f3 ∨f1 )∧(f1 ∨f3 )∧(f4 ∨f1 )∧(f5 ∨f1 )∧(f1 ∨f5 )∧(f6 ∨f3 )∧(f7 ∨ f3 )∧(f3 ∨f6 ∨f7 )∧(f8 ∨f5 )∧(f9 ∨f5 )∧(f5 ∨f8 ∨f9 )∧(f8 ∨f9 )∧(f7 ∨f4 )∧(f4 ∨f8 )∧(f9 ∨f4 ). M2 = f1 ∧(f2 ∧f1 )∧(f1 ∨f2 )∧(f3 ∨f1 )∧(f1 ∨f3 )∧(f4 ∨f1 )∧(f5 ∨f1 )∧(f1 ∨f5 )∧(f6 ∨f3 )∧(f7 ∨ f3 )∧(f3 ∨f6 ∨f7 )∧(f8 ∨f5 )∧(f9 ∨f5 )∧(f5 ∨f8 ∨f9 )∧(f8 ∨f9 )∧(f7 ∨f4 )∧(f4 ∨f8 )∧(f9 ∨f4 ). H
In M1 , a literal has been negated whereas in M2 , an operator OR has been replaced by an AND one. It should be noted that the proposed approach is independent from the way the mutants have been created and from the changes they operate compared to the original FM. Feature Model
Mutants
Time/generations
Search-based process
Product configurations
Fig. 2. Overview of the approach for generating test configurations.
3.2
The Search-based Process
Once the mutants are created, the search-based process starts to generate a set of test configurations. The different steps of the approach are described in Algorithm 1 and detailed in the following. First, an initial population is created and its fitness is evaluated (line 1 and 2). Then, the population is evolved (line 3 to 10): search-operators try to improve the population by adding or removing test configurations. Individual An individual I or potential solution to the problem is a set of k ≥ 1 test configurations that are conform to the FM: I = {T C1 , ..., T Ck }. Population The population P is composed of only one individual: P = {I}. Initial Population The individual of the initial population is initialized by generating randomly a test configuration that is conform to the FM by using a SAT solver. Fitness Evaluation The fitness f of an individual I is calculated by evaluating how many mutants are not satisfied by at least one of the test configurations of I. This is called mutation score. More formally, if we denote as M = {M1 , ..., Mm } the m mutants of the FM, the fitness f of an individual I is evaluated as follows: F (I) =
|{Mi ∈ M | ∃T Cj ∈ I | T Cj does not satisfy Mi }| = mutation score, m
where |A| denotes the cardinality of the set A. It should be noted that all the test configurations considered are satisfying the FM since they belong to I. Search Operators The approach makes use of four search operators that operate on an individual I. The operators are divided into two categories: operators that add a new test configuration and operators that remove a test configuration. The operators are depicted in Figure 3.
Algorithm 1 Generation of SPL Test Configurations 1: Create an initial population P with one individual I : P = {I} containing one test configuration 2: Evaluate the fitness f of I : f = F (I) 3: while budget (time, number of generations) do 4: Select a search operator with a probability p 5: Generate a new individual I 0 using the selected search operator 6: Evaluate the fitness f 0 = F (I 0 ) 7: if f 0 ≥ f then 8: I = I0 9: end if 10: end while 11: return I
Feature Model
SAT Solver
Individual
(a) Add a random test configuration.
Individual
Random product configuration removed
(b) Remove a random test configuration
2. Score-based selection 3. Assume altered SAT constraint Solver negation
Mutants 1. Evaluation
Feature Model
4. Product configuration added
Individual
(c) Smart add of a test configuration
Mutants
3. Product configuration removed
1. Evaluation
2. Score-based selection Individual (d) Smart remove of a test configuration
Fig. 3. The search operators used to generate a test configuration set.
– Add a random test configuration. This operator is presented in Figure 3(a). It adds to the considered individual a test configuration randomly chosen from the space of all the test configurations of the FM . – Remove a random test configuration. This operator is depicted in Figure 3(b). It randomly removes a test configuration from the individual. – Smart add of a test configuration. This operator is presented in Figure 3(c). First, the altered constraints of the mutants are collected. Then, for each constraint, the number of test configurations from I that do not satisfy it is evaluated. This can be view as a mutant constraint score. Then, using this score, a proportionate selection is performed in order to choose one of these constraints. The idea is to promote the constraint that is the less not satisfied by the test configurations of I. Then, the operators tries to select a test configuration which is at the same time satisfying the FM and the
negation of the selected constraint. Doing so will result in a test configuration that is able to violate a clause of the mutant and thus do not satisfy it. – Smart remove of a test configuration. This operator is illustrated in Figure 3(d). For each test configuration of I, it is evaluated the number of mutants that are not satisfied. This can be view as a test configuration score. Then, using this score, a proportionate selection is performed in order to choose which test configuration to remove from I. The idea is to promote the removal of test configurations that are not satisfying the less amount of mutants.
4
Experiments
In this section, the proposed search-based approach, that we will denote as SB is evaluated on a set of FMs. The objective of these experiments is to answer the two following research questions: – [RQ1] Is the proposed approach capable of generating test configurations leading to an improved mutation score? – [RQ2] How does the proposed approach compare with a random one in terms of mutation score and number of test configurations generated? The first research question aims at evaluating whether the mutation score is increasing over the generations of SB and if at a point it is able to converge. We expect to see the mutation score increasing over the generations and stabilize at a time. In practice, it means that the approach is capable of improving the solution and reach a good enough mutation score. The second question amounts to evaluate how SB compares with a naive approach. Since no other technique exists to perform a mutation-based generation of TCs for SPLs, we compare it to a random one. To this end, two bases of comparison are used. The first one is the evaluation of the mutation score when generating the same number of test configurations with both approaches. The second baseline evaluates the number of configurations required by the random approach to achieve the same level of mutation score as SB. It is expected that a higher mutation score than random for the same number of configurations will be observed and we expect a random generation to necessitate more configurations than SB to achieve a given mutation score. In order to answer these two questions, an experiment is performed on 10 FMs of various size taken from the Software Product Line Online Tools (SPLOT) [19], which is a widely used repository in the literature. The FMs used in the experiments are described in Table 1. For each FM, it presents the number of features, the number of constraints, the number of possible products and the number of mutants used. The mutants have been created using the mutants operator presented in Table 2 and taken from [20,21]. The mutants leading to an invalid FM formula (e.g., a ∧ ¬a) and equivalent mutants (mutants that can never be detected because they are always satisfied by any test configuration) are
Table 1. The feature models used for the experiments. Feature Model Cellphone Counter Strike SPL SimulES, PnP DS Sample Electronic Drum Smart Home v2.2 Video Player Model Transformation Coche Ecologico Printers
Features 11 24 32 41 52 30 71 88 94 172
Constraints 22 35 54 201 119 82 99 151 191 310
Possible products 14 18,176 73,728 6,912 331,776 3.87×10⁹ 4.5×10¹³ 1.65×10¹³ 2.32×10⁷ 1.14×1027
Mutants 119 208 291 1,086 664 434 582 851 1,030 1,829
Table 2. Mutation operators used in the experiments in order to alter feature models. Mutation Operator Literal Omission (LO) Literal Negation (LN) OR Reference (OR)
Action A literal is removed A literal is negated An OR operator is replaced by AND
not considered in this work. Finally, in order to generate random configurations from the FM and the mutants, the PicoSAT SAT solver [22] is used.
4.1
Approach Assessment (RQ1)
Setup SB has been performed 30 times independently per FM with 1,000 generation with an equal probability p = 0.25 to apply one of the four operators.
4.2
Results
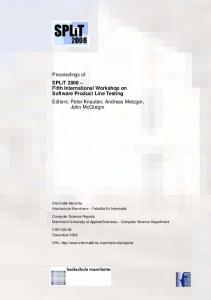
The results are recorded in Figure 4 and Table 3. The figure presents the evolution of the mutation score averaged on all the FM and all the 30 runs while the table presents detailed results per FM. With respect to Figure 4, one can see the ability of the approach to improve the mutation score over the generations and stabilize around 0.8. With respect to Table 3, one may observe that the approach is able to improve the mutation score for each of the considered FM, with improvements of 68% in average for the DS Sample FM. Besides, there are very small (0.03) or non-existent variations among the different final mutation score achieved over the 30 runs, fact demonstrating the ability of SB to reach a good solution at each execution of the approach. Finally, it should be noticed that SB achieves the above-mentioned results using only a small number of generations (1,000 generations). This is an achievement since search-based techniques usually require thousands of executions in order to be effective [18].
Table 3. Comparison between the initial and final mutation score achieved by the proposed search-based approach on the 30 runs for 1,000 generations. Generation 1 min max avg 0.39 0.66 0.5 0.37 0.56 0.45 0.42 0.62 0.49 0.17 0.27 0.22 0.38 0.56 0.44 0.45 0.66 0.54 0.36 0.55 0.45 0.41 0.61 0.5 0.44 0.57 0.49 0.35 0.45 0.41
Feature Model \ Mutation score Cellphone Counter Strike SPL SimuleES, PnP DS Sample Electronic Drum Smart Home v2.2 Video Player Model Transformation Coche Ecologico Printers
4.3
Generation min max 0.79 0.79 0.79 0.79 0.7 0.7 0.9 0.9 0.78 0.78 0.89 0.89 0.69 0.72 0.86 0.86 0.8 0.8 0.74 0.75
1,000 avg 0.79 0.79 0.7 0.9 0.78 0.89 0.71 0.86 0.8 0.75
Answering RQ1
The results presented in the previous section demonstrate the ability of SB to both improve the mutation score over the generations and converge towards an acceptable mutation score. Indeed, some mutants may not be detectable if they are either leading to an invalid formula or an equivalent to the original FM formula (i.e., there is no test configuration that cannot satisfy it), thus limiting the maximum score achievable by the approach. In this work, we only focus on the process of generating the test suite to maximize the mutation score. Finally, we observe improvements in the mutation score of over 60% and a quick convergence, with very small variations between each of the 30 runs, thus giving confidence in the validity of the search approach.
0.8
Mutation score
0.75 0.7 0.65 0.6 0.55 0.5 0.45
1
10
100
1000
Generation
Fig. 4. Evolution of the mutation score over the 1,000 generations of the proposed approach averaged on all the feature models for the 30 runs.
Table 4. Comparison between the search-based approach (SB) and a random one on the following basis: (a) same number of test configurations and (b) same mutation score (MS). Each approach has been performed 30 times independently. #Conf denotes the number of test configurations. The execution time is in seconds. Feature Model Cellphone
Counter Strike
SPL SimulES, PnP
DS Sample
Electronic Drum
Smart Home v2.2
Video Player
Model Transfo.
Coche Ecologico
Printers
30 runs min max avg min max avg min max avg min max avg min max avg min max avg min max avg min max avg min max avg min max avg
SB approach #Conf MS Time 3 0.79 2 4 0.79 3 3.46 0.79 2.66 7 0.8 9 11 0.8 11 9.53 0.8 10.6 3 0.7 11 5 0.7 13 4.36 0.7 11.9 16 0.9 46 17 0.9 49 16.03 0.9 46.8 5 0.78 22 8 0.78 27 6.83 0.78 24.8 7 0.88 26 11 0.88 30 8.36 0.88 28 14 0.69 53 22 0.72 65 18.86 0.71 59 8 0.86 54 12 0.86 67 9.36 0.86 59.2 11 0.8 75 14 0.8 89 11.76 0.8 80 25 0.74 443 35 0.75 567 30 0.75 513
Rand. same #Conf MS Time 0.48 0 0.79 0 0.67 0 0.68 0 0.75 1 0.72 0.16 0.61 0 0.7 1 0.66 0.1 0.56 0 0.77 1 0.70 0.2 0.66 0 0.77 1 0.72 0 0.79 0 0.88 1 0.84 0.1 0.62 0 0.65 1 0.64 0.5 0.77 0 0.85 1 0.82 0.2 0.71 0 0.77 1 0.74 0. 0.67 2 0.72 3 0.70 2.4
Rand. same MS #Conf Time 4 0 42 0 12.4 0 22 0 109 2 43.73 0.56 4 0 30 1 9.66 0.16 32 1 114 8 60.26 2.9 9 0 29 1 15.46 0.3 13 0 43 2 22.7 0.66 161 19 1,000* 532 518 183 15 0 56 4 31.13 1.86 17 1 57 7 31.36 2.9 149 110 1,000* 4,928 481 1,264
*The number of test configurations required by random to achieve the same mutation score as SB has been limited to 1,000.
4.4
Comparison with Random (RQ2)
Setup SB has been performed 30 times independently per FM with 1,000 generation allowed. An equal probability p = 0.25 to apply one of the four operators has been set. For each run of SB, a random one has been conducted in order to (a) evaluate the mutation score achieved when randomly generating the same number of TCs as the number proposed by SB, and (b) evaluate the amount of generated TCs required by the random approach in order to achieved the same mutation score. In the latter case, a limit of 1,000 TCs has been set. Results The results are recorded in Table 4. It presents the minimum, maximum and average number of TCs, mutation score (MS) achieved and execution time in seconds for the following approaches: SB, random based on the same number
0.65
(a) Baseline number of configurations Printers
0.7
Coche Ecologico
0.75 450
Model Transformation
0.8 DS Sample
Printers
Coche Ecologico
Model Transformation
Video Player
Smart Home v2.2
1
Video Player
0.85 500
Smart Home v2.2
(a) Baseline number of configurations Electronic Drum
SB approach Random
DS Sample
0.55
Electronic Drum
0.6
Counter Strike
0.65
SPLS SimuelES, PnP
0.7
Counter Strike
0.8
Number of test conf. for the same mutation score
0.75
Cellphone
Printers
Coche Ecologico
0.85
SPL SimulES, PnP
SB approach Random Number of test conf. for the same mutation score
Video Player Model Transformation
0.9
Cellphone
Printers
Coche Ecologico
Model Transformation
0.9 Smart Home v2.2
0.45
Video Player
Electronic Drum
DS Sample
SPL SSimuelES, PnP
Counter Strike
Cellphone
Mutation score for the same number of test conf. 0.5
Smart Home v2.2
Electronic Drum
DS Sample
SPL SimulES, PnP
Counter Strike
Cellphone
Mutation score for the same number of test conf. 0.95 1000
100
10
SB approach Random
(b) Baseline mutation score
Fig. 5. Search-based approach VS Random: distribution of the mutation score and number of test configurations on the 30 runs.
SB approach Random
400
350
300
250
200
150
100
50
0
(b) Baseline mutation score
Fig. 6. Search-based approach VS Random: average values of the mutation score and number of test configurations on the 30 runs.
of test configurations as SB and random based on the same mutation score as SB. Besides, Figure 5 depicts the distribution of the values over the 30 runs and Figure 6 presents the average values. From these results, one can see that SB is quite stable, with small variations in both the mutation score and number of configurations achieved (5(b) and 5(a)). Compared to random based on the same number of configurations, SB always performs better in terms of mutation score. For instance, for the DS Sample FM, there is a difference of 0.34 on minimum mutation score achieved and 0.2 on the average one (Table 4). Regarding the comparison based on the mutation score, the random approach requires much more TCs to achieve the same mutation score. For instance, with respect to the Video Player FM, the random approach requires in average more than 500 TCs to reach a mutation score of 0.71 while SB only needs less than 20 (Figure 6(a)). In addition, there were some cases, e.g., the Printers FM where the random approach was not able to achieved the same mutation score as the one reached by SB, requiring more than 1,000 TCs and more execution time than SB. Answering RQ2 Our results show that SB outperforms the random approach. We observed a difference between random and SB of up to 34 % in favor of SB. Additionally, the random technique requires much more test configurations to achieve a given mutation score. In some cases, it is not even able to terminate, requiring more than 20 times more TCs. This shows the ability of SB to generate TCs while at the same time maximizing the mutation score that can be achieved. 4.5
Threats to Validity
The experiments performed in this paper are subject to potential threats towards their validity. First, the FMs employed are only a sample and thus the generalization of theses results to all possible FMs is not certain. In particular, using different models might lead to different results. In order to reduce this threat, we selected 10 FMs of different size and complexity. Thus, we tried to use a diversify and representative set of subjects. A second potential threat can be due to the experiments themselves. First, there is a risk that the observed results happened by chance. To reduce this threat, we have repeated the execution of both the proposed approach and the random one 30 times per FM. Doing so allows reducing risks due to random effects. Another threat can be due to the SAT solver used. Indeed, there is a risk that another solver will lead to different results. We choose PicoSAT as it was easy to modify it to produce random solutions. the same threat holds for the mutation operator used. We tried to employ various mutation operators that are relevant for FM formulas. This paper aims at generating test configurations with the aim of detecting mutants. The ability of finding faults is not evaluated. Regarding the mutation score achieved, it is expected that giving more time to the search-based approach will provide better results. Even if small differences are observed in the mutation score compared to the random approach, this can be in practice leading to finding more faults [11,17]. Finally, the presented results could be erroneous due to potential
bugs within the implementation of the described techniques. To minimize such threats, we divided our implementation into separated modules. In addition, we make publicly available the source code and the data used for the experiments.
5
Related Work
The use of metaheuristic search techniques for the purpose of the automatic generation of test data has been a burgeoning interest for researchers [23]. In this context, several work have investigated the product configuration generation for SPLs using a metaheuristic search. For instance, in [24], Ensan et al. aim at generating a test suite with a genetic algorithm by exploring the whole SPL product space, including product that do not fulfill the FM constraints. In this work, we only explore the space of product satisfying the FM, by using a SAT solver. The importance but also the overhead induced by constraint solvers has been shown in [4,25] and used in some work for the purpose of CIT. For instance, in [26], Garvin et al. proposed a simulated annealing approach for generating configurations based on CIT. In [27], a multi-objective genetic algorithm in conjunction with a SAT solver was proposed by the authors with CIT as one of the objective to fulfill. There are also work exploring the whole search space to compute the optimal test suite according to CIT, such as [28]. In this work, we propose a simple hill-climbing-based approach in conjunction with the SAT solver. The difference is that we do not consider CIT as an objective. The product configuration generation process is guided by the mutation score. An exact solving technique can only be used for moderate size search spaces. In this paper, we focus on larger SPLs where the product space cannot be fully explored. Finally, there are work focusing on test case generation for each software product [29]. Mutation has been widely used for the purpose of testing and test generation, e.g., [30,31]. With respect to the mutation of models such as FMs for SPL, Henard et al. [20] introduced some operators and used mutants of FM in order to evaluate the ability of a given test suite to find them. While the concept of mutation score was used, it was only a way to evaluate a given test suite. In this paper, the mutation score is used to guide the search for generating test suites. Besides, it has been shown that measuring the mutation score of a test suite with respect to a CIT model like FMs rather than measuring the number of interactions covered gives a stronger correlation to code-level faults [11]. In this paper, we used FMs represented as boolean formulas from which we created mutants. There are several work who investigated the mutation of logic formulas. For instance, Gargantini and Fraser devised a technique to generate tests for possible faults of boolean expressions [32]. In this work, the smart add search operator also aims at triggering the fault introduced in the mutant by using a SAT solver. In the context of logic-based testing, Kaminski et al. [33] proposed an approach to design tests depending on logical expressions. In this paper, mutation operators are applied on the logic formula of the FM. The objective is only to generate test configurations according to the mutants of the FM formula.
6
Conclusion and Future Work
This paper devised an approach for generating test configurations for SPLs based on mutation. The novelty of the proposed technique is the use of mutation of the FM to guide the search, thus focusing on possible faulty implementation of the FM that should be tested. To the authors knowledge, it is the first approach that is performing so. The conducted experiments show the benefit of the approach compared to a random one as it is able to both reduce the test suite size while significantly increasing the mutation score. To enable the reproducibility of our results, our implementation and the FMs used are publicly available at: http://research.henard.net/SPL/SSBSE_2014/. Future work spans in the three following directions. First, we will investigate the influence of the parameters and study different variants of the algorithm. In particular, we will compare with standard genetic algorithms. Second, we will propose new operators for improving the search process. Finally, we will undertake supplementary experimentations to further validate the presented findings.
References 1. Pohl, K., B¨ ockle, G., van der Linden, F.: Software Product Line Engineering Foundations, Principles, and Techniques. Springer (2005) 2. Benavides, D., Segura, S., Cort´es, A.R.: Automated analysis of feature models 20 years later: A literature review. Inf. Syst. 35(6) (2010) 615–636 3. Knauber, P., Mu˜ noz, J.B., B¨ ockle, G., do Prado Leite, J.C.S., van der Linden, F., Northrop, L.M., Stark, M., Weiss, D.M.: Quantifying product line benefits. In: PFE. (2001) 155–163 4. Perrouin, G., Sen, S., Klein, J., Baudry, B., Traon, Y.L.: Automated and scalable t-wise test case generation strategies for software product lines (2010) 5. do Carmo Machado, I., McGregor, J.D., de Almeida, E.S.: Strategies for testing products in software product lines. ACM SIGSOFT Software Engineering Notes 37(6) (2012) 1–8 6. Engstr¨ om, E., Runeson, P.: Software product line testing - a systematic mapping study. Information & Software Technology 53(1) (2011) 2–13 7. da Mota Silveira Neto, P.A., do Carmo Machado, I., McGregor, J.D., de Almeida, E.S., de Lemos Meira, S.R.: A systematic mapping study of software product lines testing. Information & Software Technology 53(5) (2011) 407–423 8. Nie, C., Leung, H.: A survey of combinatorial testing. ACM Comput. Surv. 43(2) (2011) 11 9. Kuhn, D.R., Wallace, D.R., Gallo, A.M.: Software fault interactions and implications for software testing. IEEE Trans. Software Eng. 30(6) (2004) 418–421 10. Petke, J., Yoo, S., Cohen, M.B., Harman, M.: Efficiency and early fault detection with lower and higher strength combinatorial interaction testing. In: ESEC/SIGSOFT FSE. (2013) 26–36 11. Papadakis, M., Henard, C., Traon, Y.L.: Sampling program inputs with mutation analysis: Going beyond combinatorial interaction testing. ICST (2014)
12. Jia, Y., Harman, M.: An analysis and survey of the development of mutation testing. IEEE Trans. Software Eng. 37(5) (2011) 649–678 13. Offutt, J.: A mutation carol: Past, present and future. Information & Software Technology 53(10) (2011) 1098–1107 14. Papadakis, M., Malevris, N.: Mutation based test case generation via a path selection strategy. Information & Software Technology 54(9) (2012) 915–932 15. Droste, S., Jansen, T., Wegener, I.: On the analysis of the (1+1) evolutionary algorithm. Theor. Comput. Sci. 276(1-2) (2002) 51–81 16. Lehre, P.K., Yao, X.: Runtime analysis of the (1 + 1) ea on computing unique input output sequences. Inf. Sci. 259 (2014) 510–531 17. Henard, C., Papadakis, M., Perrouin, G., Klein, J., Heymans, P., Le Traon, Y.: Bypassing the combinatorial explosion: Using similarity to generate and prioritize t-wise test configurations for software product lines. IEEE Trans. Software Eng (2014) 18. Harman, M., McMinn, P.: A theoretical and empirical study of search-based testing: Local, global, and hybrid search. IEEE Trans. Software Eng. 36(2) (2010) 226–247 19. Mendon¸ca, M., Branco, M., Cowan, D.D.: S.p.l.o.t.: software product lines online tools (2009) 20. Henard, C., Papadakis, M., Perrouin, G., Klein, J., Traon, Y.L.: Assessing software product line testing via model-based mutation: An application to similarity testing. In: ICST Workshops. (2013) 188–197 21. Kaminski, G.K., Praphamontripong, U., Ammann, P., Offutt, J.: A logic mutation approach to selective mutation for programs and queries. Information & Software Technology 53(10) (2011) 1137–1152 22. Biere, A.: Picosat essentials. JSAT 4(2-4) (2008) 75–97 23. McMinn, P.: Search-based software test data generation: a survey. Softw. Test., Verif. Reliab. 14(2) (2004) 105–156 24. Ensan, F., Bagheri, E., Gasevic, D.: Evolutionary search-based test generation for software product line feature models. In: CAiSE. (2012) 613–628 25. Cohen, M.B., Dwyer, M.B., Shi, J.: Constructing interaction test suites for highlyconfigurable systems in the presence of constraints: A greedy approach. IEEE Trans. Software Eng. 34(5) (2008) 633–650 26. Garvin, B.J., Cohen, M.B., Dwyer, M.B.: Evaluating improvements to a metaheuristic search for constrained interaction testing. Volume 16. (2011) 61–102 27. Henard, C., Papadakis, M., Perrouin, G., Klein, J., Traon, Y.L.: Multi-objective test generation for software product lines. In: SPLC. (2013) 62–71 28. Lopez-Herrejon, R.E., Chicano, F., Ferrer, J., Egyed, A., Alba, E.: Multi-objective optimal test suite computation for software product line pairwise testing. In: ICSM. (2013) 404–407 29. Xu, Z., Cohen, M.B., Motycka, W., Rothermel, G.: Continuous test suite augmentation in software product lines. In: SPLC. (2013) 52–61 30. Harman, M., Jia, Y., Langdon, W.B.: Strong higher order mutation-based test data generation. In: SIGSOFT FSE. (2011) 212–222 31. Fraser, G., Zeller, A.: Mutation-driven generation of unit tests and oracles. IEEE Trans. Software Eng. 38(2) (2012) 278–292 32. Gargantini, A., Fraser, G.: Generating minimal fault detecting test suites for general boolean specifications. Information & Software Technology 53(11) (2011) 1263–1273 33. Kaminski, G., Ammann, P., Offutt, J.: Improving logic-based testing. Journal of Systems and Software 86(8) (2013) 2002–2012