3) Medium for crosses and short-term maintenance of stocks undergoing genetic ..... 3 mola molb moja. moSb m03~ m03~. moJe moba mobb. mOga mo8b.
MUTATIONS AFFECTING CELL DIVISION IN T E T R A H Y M E N A PYRIFORMIS. I. SELECTION AND GENETIC ANALYSIS JOSEPH FRANKEL, LESLIE M. JENKINS, F. PAUL DOERDER2 AND E. MARL0 NELSEN Department of Zoology, University of Iowa, Iowa City, Iowa 52242 Manuscript received October 14, 1975 Revised copy received February 19,1976 ABSTRACT
Fourteen nitrosoguanidine-induced mutations that bring about temperaturesensitive morphological abnormalities resulting from a specific effect on cell division have been isolated as heterozygous phenotypic assortants in Tetrahymena pyriformis syngen 1 . Genetic analysis revealed all to be single-gene recessives. Detailed analysis of the kinetics of assortment for one of the mutated alleles revealed a rate (0.0104 pure lines per fission) consistent with that previously observed at other loci in this organism. The mutations fall into six complementation groups (mol, mo2, mo3. mob, m98, and mo12). Homozygotes of mo2 are unconditionally expressed, while all alleles of mol, mob, mo8, and mol2 are heat sensitive for division arrest. At the mo? locus two alleles are heat sensitive, one is primarily cold sensitive, while two are sensitive to both heat and cold. Two out of three combinations of different mo3 alleles show conventional Mendelian segregation of conditions of expression. Different alleles of mol, mo3, mo8, and mol2 also manifest differences in penetrance at the restrictive temperature. Despite these differences involving expression, the abnormal phenotypes themselves are locus-specific and distinctive; in the one case (mola and molb) in which two alleles manifest nmewhat different phenotypes, the F, between them is intermediate. One additional recessive mutation (fat!) brings about a nonconditional lengthening of the cell cycle, with some arrest of cell division at the restrictive temperature. These findings demonstrate that selection of heterozygotes undergoing phenotypic assortment can he an effective method for obtaining substantial numbers of a desired class of temperature-sensitive mutations in T . pyriformis.
T H E study of temperature-sensitive mutations affecting specific steps of the cell division cycle offers a potentially powerful approach toward characteret al. 1974). izing these steps and analyzing their interrelationship (HARTWELL A satisfactory application of this mode of study demands a n easily grown cellular system in which mutations that bring about blockage in specific cell cycle stages can readily be screened and in which penetic loci can be delineated by segregation and complementation analysis. No animal cell system fulfills all of these criteria as ideally as does the budding yeast (Saccharomyces cereuisiae) studied by HARTWELL and his collaborators (HARTWELL et al. 1973). However, at least two A preliminary report of this investigation has been publlshed in the proceedings of a conference (FRANKEL et al. 1975) Present address Department of Llfe Sciences, Unlverslty of Pittsburgh, Pittsburgh, Pa 15260 Genetics 83: 489-506 July, 197G
490
J. FRANKEL et al.
species-groups of ciliated protozoans, the Tetrahymena pyriformis and “Puramecium aurelia” complexes, do meet the basic genetic requirements for relatively easy selection as well as genetic analysis of recessive mutations. LLP.aurelia” provides instantaneous homozygosity and total inbreeding through autogamy (SONNEBORN 1947), while T. pyriformis, though not capable of autogamy, manifests an enigmatic but useful phenomenon known as macronuclear or phenotypic assortment (ALLENand NANNEY 1958; NANNEY 1964) that limits expression to only one allele at virtually every known locus (see ALLENand GIBSON1973; SONNEBORN 1974). I n macronuclear assortment, either allele at a genetic locus may be expressed by the cell, with the choice bearing no relation to conventional dominance, while the micronucleus remains totally unaffected by the process and can transmit alleles regardless of which allele happens to be expressed (NANNEY and DUBERT 1960). In effect, the same cells become functionally homozygous (or haploid) with respect to expression but remain heterozygous (diploid) with respect to transmission. CARLSON(1971) was the first to adapt this feature as the basis for a mutant screening protocol. This same basic method was carried further (1973) in a successful search for serotype mutations and by DOERDER by DOERDER et al. (1975) in the identification of a mutation affecting cell shape. We here apply this method for the screening and analysis of conditionally expressed mutations affecting cell division. This report will consider the isolation and genetics of mutations at six loci affecting specific stages of cell division, and a mutation at another locus that has nonspecific effects on the cell cycle. A more detailed consideration of ways in which these mutations have been applied to characterize the developmental processes of this cell will appear elsewhere (FRANKEL, JENKINS and DEBAULT 1976; FRANKEL et al. 1977). MATERIALS A N D METHODS
Strains Inbred strains of Tetrahymena pyriformis, syngen 1, were used in this study. Strains B and D, both in the 18th generation of inbreeding, were obtained from DR. DAVIDL. NANNEY(for derivation and genotypes of these strains, see Tables 1 and 2 in ALLENand GIBSON1973, and Table 1 in BORDENet al. 1973). Strain A* (pronounced A-star) is a derivative of strain A (WEINDRUCH and DOERDER 1975). Media 1) Stock culture media: a. 1% proteose peptone (Difco) b. 1% proteose peptone f0.1% Bacto yeast extract (Difco). c. 0.3% Bacto tryptone (Difco) f 0.5% dextrin (Difco) f vitamins f salts (TDVS 1965 for detailed formula). medium) (see FRANKEL 2 ) Media for studies of growth and development: a. 2% proteose peptone f0.5% Bacto yeast extract (PPYmedium). b. 0.3% Bacto tryptone 0.5% glucose vitamins salts (TGVS medium). This is identical to the TDVS medium mentioned above, except that glucose is substituted for dextrin. 3) Medium for crosses and short-term maintenance of stocks undergoing genetic analysis: bacterized peptone (a 24-hour culture of Enterobacter uerogenes in 1% proteose peptone diluted 1/70 with distilled water prior to use).
+
+
+
CELL DIVISION
MUTATIONS IN
Tetrahymena
49 1
4) Medium f o r the initial scoring of phenotypes and transfer of cells from bacterized to axenic cultures: either the PPY or TGVS medium supplemented with 1.4 g/l penicillin G (Pfizer) and 2.2 g/l streptomycin sulfate (Pfizer) (to be referred to as pen-strep PPY o r TGVS).
Maintenance
of
stocks
Long-term stock cultures were maintained at 18” and 20” in 1% proteose peptone, either without or (later) with 0.1% yeast extract, in 5 ml aliquots in 20 x 150 mm culture tubes, with transfer every second week. Stocks undergoing current experimentation were maintained at 28”, initially in the TDVS medium and later in PPY medium, in 5 ml aliquots in 20 X 150 mm culture tubes kept at a slant, with transfer every day or every second day.
Procedures for making crorses The basic methods of Tetrahymena genetics introduced by NANNEY(e.g , NANNEYand 1955) were followed with only minor modiCAUGHEY 1955; NANNEY, CAUGHEY and TEFANKJIAN fication. Procedures involving crosses were performed using bacterized peptone medium. Lines to be crossed were maintained in 13 x 100 mm culture tubes with feeding a day or two before the cross was made. Mating mixtures were made in the center well of three-spot depression slides (“spot plates”, Corning no. 7223), with parental controls in the two lateral wells. Within twelve hours of formation of the first pair, a drop of bacterized peptone was added to induce separation of pairs not yet firmly united. Three hours later, pairs were individually isolated into drops of bacterized peptone. Typically some pairs failed to separate. while others separated and failed to divide or divided at most only two or three times; such pairs were considered “dead”. The remainder of the pairs (synclones) were fed periodically and allowed to produce thriving cultures of several hundred cells, at which time one-half of the culture was withdrawn and tubed (with a small portion often removed for testing of phenotype, described below), while the remainder was immediately tested for true conjugation by addition of a sexually reactive tester of a nonparental 1955). Since true conjugation involving mating type (cf. NANNEY,CAUCHEY and TEFANKJIAN development of a new macronucleus results in sexual immaturity, all lines that mated at this time, with the exception of occasionally-appearing and distinguishable early-mature lines (BLEYM A N 1371), probably were descended from pairs that had not formed a new macronucleus. Such “nonconjugants” were thus not included among the progeny of a cross in tabulations such as those in Tables 1 and 2, but were considered in crosses in which anomalous genetic ratios were observed, since such anomalies might be caused by selective gametic death or abortion of macronuclear development. If progeny of a cross were to be used in further crosses, then single cells (generally three in number) were isolated from each chosen synclone, and returned to depression slide culture. Each such clone was serially transferred by single cell isolations made every second day; sexual maturity was generally attained after four such transfers, 50-60 fissions after the previous conjugation. At this time the clones were tubed, fed, and the mating type of each clone ascertained by mixing small samples of each with approximately equal samples of “tester” clones representing the seven standard mating types. This test was performed in 96-well microtiter plates (Cooke Engineering Co.), and included controls of the unmixed clones to be tested, unmixed tester clones, and tester clones mixed with each other. Where possible, lines with infrequent mating types (NANNEY 1959) were kept for further crosses. Certain crosses utilized “genomic exclusion” (ALLEN1967). This involves a sequence of two successive crosses to a sterile (“star”) strain with a defective micronucleus. The end result is to bring about recovery of genes only from the fertile partner, all in a homozygous state, with a 1:l ratio of homozygotes for the two alleles at any originally heterozygous locus. Genomic exclusion crosses were performed according to the procedure of ALLEN(1967), using a n A* (mt I11 and V) line (WEINDRUCH and DOERDER 1975) in place of ALLEN’SC* as the sterile, defective partner. The kinetics of phenotypic assortment were determined by methods similar to those of NANNEY and DUBERT(1960) and DOERDER (1973).
Mutrrtions and screening Mutations were obtained and selected following the method originally devised by CARLSON (1971) and further elaborated by DOERDER (1373). In outline, the procedure involves four basic
492
J. FRANKEL
et al.
mass mating
&
obtain ing and screening mutat ions
6
.L
>50 fissions (assortment)
0
growth of
at 40' monster"
/
putative
G
nonmutageni zed parental clone
.L
-
4
+
4
+ 2
$
$
pxfi m / r d 6
t
+/+ mo/+
S
+/+
mo/+
>50 fissions (assortment) growth at 40"
+/+ mo/+
mating scheme usinq mo/+ F,'s
genetic analysis,
expectat ions
of mutations genomic exclusion
mol+
F2 x F, mO/mo ("backcross")
X
A*
- '/2 t. S. (mo/mo)
mo/+
- '/2 t. s.
( mo/mo)
\
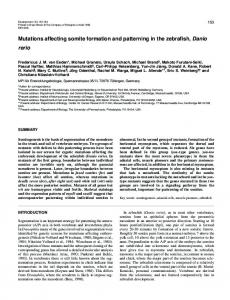
FIGURE I .-Procedure
for obtaining, screening, and analyzing morphologically abnormal mutants in T.pyriformis, syngen 1. For explanation, see the text.
CELL DIVISION
MUTATIONS IN
Tetrahymena
493
steps (Figure 1, top): (1) Exposure of cells of two mating types t o nitrosoguanidine; (2) a cross of these two mutagenized lines to bring micronuclear mutations into the macronucleus (generated anew at conjugation) ; (3) propagation of exconjugants for a sufficient number of cell generations to allow recessive alleles to come to expression as a consequence of macronuclear assortment; (4) isolation of single cells, formation of clones, subculturing, and scoring of subcultures at 39.5". This procedure was executed as follows: cells of two different mating types (first D 1868 I11 and V; later B 1868 VI and VII) were separately grown under axenic conditions to mid-exponential culture tubes. N-methyl-N'-nitro-Nphase in 10 ml of TGVS medium in two 20 x 150" nitrosoguanidine (Aldrich Chemical Co., Milwaukee, Wisconsin) was then added to each at a final concentration of 10 pg per ml. The two cultures were incubated with the mutagen while being shaken at room temperature for 4 hours in TGVS medium. The mutagenized cultures were then washed four times with glass distilled water to remove the mutagen and the cells resuspended in 20 to 30 ml of bacterized peptone. Each of these large cultures was subdivided into five 13 x 100 mm tubes and fed further with bacterized peptone. After 24 hours of growth, samples of cultures of the two mating types were crossed in depression slides. Following effective pairing, the entire mating mixture was transferred to 50 ml of bacterized peptone in a 250 ml flask. The cultures were then fed every second day by pouring off most of the used medium and adding fresh bacterized peptone. This procedure was continued for about two weeks to allow sufficient time for recessive mutated alleles in those cells which had succeeded i n conjugating to come to expression through the process of macronuclear assortment. The procedure of isolation and subculturing (replication) of clones for screening closely follows that described i n detail by ROBERTS and ORIAS(1973) and is illustrated in Figure 1. Single cells were isolated, one per drop, into small drops of TGVS medium in siliconized plastic petri plates, the drops being arranged in a rectangular pattein of 48 drops per plate, corresponding to the positions of wells of a microtiter plate (see Figure 1 of ROBERTS and ORIAS1973). The petri plates were incubated in moist chambers (refrigerator crispers containing a thin layer of water) kept at room temperature (about 23") for two days. The clones of a few hundred cells that grew up in each drop were then subcultured (replicated) into pen-strep TGVS medium contained in 48 matching depressions of a microtiter plate, using a 48-pronged replicator identical to that described by ROBERTS and ORIAS(1973). The replica clones were then placed in moist chambers within an incubator regulated at 39.5 k 0.1", and observed one day later. The use of axenic media allowed substantial growth and made abnormal clones easy to detect, while the exact spatial correspondence of the pattern of the replica clones and the original clones maintained at 23" made it easy to locate the phenotypically normal original clone corresponding to any replica clone that developed abnormally at 39.5". Putative mutant clones were retested a t 39.5", and if they still manifested the same abnormal phenotype they were then tested for mating type (a nonparental mating type being taken as evidence for recombination) and established as (1973). axenic tube cultures by a technique very similar to that described by ORIASand FLACKS Tube subcultures placed overnight at 39.5" were silver impregnated (see below) in order to further check the phenotype and establish priorities for genetic analysis. Each such line was maintained at 18"-20" until the time of genetic analysis.
Analysis of expression of mutations Studies of the expression of these mutations were carried out on cell populations growing exponentially in PPY o r TGVS medium within culture tubes or flasks. Methods of assay included cell counting in a model A Coulter Counter (Coulter Electronics), silver impregnation (FRANKEL and HECKMANN 1968), and Feulgen staining. A standard "expression score" (see Table 5) was obtained by scoring silver impregnated cells that were fixed a t two generations after the shift from 28" to the test temperature; the actual times of fixation were 5-6 hours post-shift at the supraoptimal temperature (near 39.5") and 24 hours post-shift at the suboptimal temperature (15"). Other experiments, particularly those used for overall estimates of penetrance, utilized periodic sampling of flask cultures.
494
J. FRANKEL
et al.
RESULTS
1. Screening of putative muiations. The procedure we have employed A N D METHODS) allows the detection of temperature sensitive dominant mutations and also recessive mutations that had undergone macronuclear assortment. Screening was specifically for mutations that brought about morphological abnormalities detectable under the dissecting microscope (40X). About 7000 clones were screened. Mutant phenotypes detected at 39.5” fell into three rough classes, which in descending order of frequency were Y,iny”, “fat”, and 6‘ monster”. The first two classes comprised clones made up of cells that differed from the normal in size and sometimes also proportions, but retained a regular shape. Two “tiny” clones have been genetically analyzed (JENKINS,unpublished) ,but will not be considered further here as they have no known pertinence to the cell cycle. A “fat” clone was also isolated and analyzed and will be considered in this paper. Our main interest, however, is in the “monster” clones, which are presumed to arise from defects in cell division and/or intracellular patterning. The cells in such clones were generally large and highly irregular in shape, although some clones included a preponderance of fairly regular linear “chains” of connected cells. These “monster” clones were coded arbitrarily when initially isolated and then given “mo” designations (e.g. m o l , mo2, etc.) after genetic analysis had proceeded to the point at which a simple genetic basis was reasonably established. This paper will concern itself with fourteen of seventeen such mutations at six gene loci that turned out to be defective in specific steps of the cell division process. All mutations were selected in the inbred B strain, except for mol“, which was originally selected and analyzed in the D strain. 2. Phenotypes. The phenotypes of the cell division mutations are summarized in Table 1. All mutant clones of the mo series were arrested in specific stages of the division process at the non-permissive temperatures; these stages differed for mutations at different loci but were the same for allelic mutations (see RESULTS. section LE), with the exception of mol“ and molb, where pronounced differences in degree of primary effect were noted. Some of these mutations also manifested other abnormalities. The fat2 mutation was fundamentally different in that it brought about arrest of cell division at 39.5”, but this arrest was manifested only in some cells, and appeared to be a by-product of a generalized severe reduction in rate of development of all stages. The frequency of cell division of fat2 homozygotes was also reduced at 28”, although at that temperature arrest of cell division was not seen. 3. Demonstration that mutations are single-gene recessives. The protocol f o r genetic analysis of putative cell division mutants is outlined in the bottom half of Figure 1. It was presumed that the micronucleus of each of the originally selected mutants was heterozygous for a mutation. As the mutant clone consisted of cells of only one mating type, the mutant was crossed to a non-mutagenized parental clone to produce an F, generation; half of these progeny were expected to be heterozygous for the mutation in question, the other half to be homozygous for the wild-type allele. The heterozygous progeny were identified by allowing (MATERIALS
CELL DIVISION
MUTATIONS J N
495
Tetrahymena
TABLE 1 Summary of phenoiypes of homozygous mutations affectingcell division Mutation
Fission zone formation*
Division furrowing
Gross appearance after arrest+
Frequency of development$
mola
does not take place
does not take place
highly irregular
normal
molb
partial
partial; arrested
bent chains or heteropolar doublets
normal
mo2$
complete
late arrest
elongated chains
normal
mo3 (all)
complete
late arrest
elongated chains
normal
mo6 (both)
complete
distorted; arrested
collapsed chains or homopolar doublets
normal
mo8 (both)
partial or complete
arrested (sometimes partial)
highly variable
normal
mol2 (both)
variably displaced
arrested
bent chains
normal
fail
complete
xcasionally arrested
enlarged posterior greatly division products reduced
* The "fission zone" is an equatorial zone of discontinuities in the longitudinal ciliary meridians, that normally appears just prior to the onset of furrowing. j-Appearance after the equivalent of about two division cycles at the restrictive temperature. At subsequent times all of the mo homozygotes tend to become highly irregular. Defined by the frequency of oral development and micronuclear division, which continue in mo homozygotes despite arrest of cytokinesis (see FRANKEL, JENKINS and DEBAULT 1376). $ Assayed in heterozygous assortant.
time for macronuclear assortment and then examining subclones after exposure at 39.5". F, progeny known to carry the mutation were then, whenever possible, crossed with one another to produce an F, generation. These F, progeny were then scored at 39.5" soon after the cross ( 7 to 8 generations), before phenotypic assortment of heterozygotes was likely to have occurred. These F, progeny all manifested a ratio of abnormal to wild-type progeny consistent with a conventional 3:1 segregation (Table 2). I n all except the mo2 clone, the putative homozygote class was expressed conditionally at the same extreme temperatures as the assorting heterozygotes. The mo2 clone was exceptional in that the putative homozygote class was abnormal at all temperatures, producing a group of nondividing monsters a few generations after conjugation. The mutated mo2 gene thus could only be propagated in heterozygous stocks. Further genetic analysis involved the inbreeding of putative homozygotes to produce an F,, backcrosses to heterozygous F, progeny, and in solme cases genomic exclusion crosses of F, heterozygates to A* (111). The F, progeny were all tem-
496
J. FRANKEL
et al.
TABLE 2
Inbreeding and genetic analysis of temperature-sensitive cell diuision mutations ~~~~~
F, phenotype Locus
mol mo2 mo3
mob mo8 mol2 fat1
Allele
mola molb mo2 moJa mo3 mo3 mojd mde mo6a mo6b mo8a mo8b mol% mol9 fat1
+
ts
Dead
33 9 (45) 43 13 (4) 41 13t (2) 94 23 (6) 23 7$ (0) 20 7 (0) 24 5 (0) 19 9 (1)
19 30 17 18
4 6
15
5
- _
5 6
(2) (20) (8) (6) (9)
F3phenotype Backcross phenotype ~-~
Fl X A’ phenotype
4-
ts
- _ - _
Dead
21 13t (26) 22 24 (12) _ _ _ _ _ _ - _ 58 19 (100)s - - _ - _ _ _ - - 111 29 - _ -
+
ts
0 77 0 496 - 0 88 0 123 0 117 0 28 0 68 0 85 0 113 0 56 0 133 0 58 0 34
- -
Dead
(8) (75) (8) (26) (0) (2) (14) (3) (4) (47) (63) (49) (198)Il (53)cs
+
ts
Dead
17 20 (23) 150 137 (31) 47 36 127 88 72 130 172 34 81 44 32 25
(1) 42 90$ (23) 117 (2) 81 (9) 68 (15) 45s (3) 191 (8) 32 (48) 72 (76) 47 (77) 27 (168)Il 24 (60)
All of the data represent pooled results, usually of several crosses of each type. Number of dead ~ clones indicated in parentheses. All pooled data were homogeneous except for the m 0 3 backcross (see text). Lines enter division blockage and form monsters at room temperature (see text). $ Two classes of ts progeny (see text). $33f, lots (14 dead) in F, x A* cross; 25+, 9ts (86 dead) in subsequent cross of original assortant x A+. ‘11 The single surviving ts line was passed through an additional genomic exclusion cross to obtain other homozygotes that were then crossed with each other (“F3)’)and test-crossed (“backcross”) to a newly created heterozygote. ‘IAll F, progeny died within two cell generations after the cross.
perature-sensitive, while the backcross and genomic exclusion progeny generally yielded the expected 1:l ratios (for exceptions, see below). The highly variable proportions of death following conjugation did not affect these ratios. The backcross data shown in Table 2 represent pooled results of from two t o thirteen separate crosses per set; the data from the separate crosses within each set (not shown) are homogeneous with the sole exception of the crosses within the m 0 3 ~ backcross series, in which backcrosses of homozygotes to one F, line gave an excess of normal progeny while backcrosses of the same homozygotes to another F, line gave the reverse outcome. In addition to the above example of inconsistent ratios, two lines consistently manifested exceptions to the expected 1:1 backcross and genomic exclusion segregation ratios. The most unambiguous occurred with moba, which gave clear and consistent 3: 1 wild type : temperature-sensitive ratios in two genomic exclusion crosses and in four backcrosses (Table 2), with negligible death (3/180) and nonconjugation (2/180) in the backcrosses. Detailed cytological examination of all of the progeny of one of the four backcrosses revealed that progeny clones classified as were indeed phenotypically indistinguishable from standard B
“+”
CELL DIVISION
MUTATIONS IN
49 7
Tetrahymena
strain clones. The only anomaly other than the unexpected ratio was the presence of eight lines containing both wild-type and mutant cells in the progeny of two of the four backcrosses. These sectored lines are arbitrarily classified as “ts” in Table 2, but any other classification of these lines does not affect the close fit to a 3:l ratio. A second exceptional situation was found in the case of mojb,in which about half of the “ts” progeny clones were highly abnormal, while the other half of the “ts” progeny clones each consisted of some abnormal cells and many others indistinguishable from normal. Thus the true segregation in this case was not 96 90 ts as indicated in Table 2, but rather 96 42 ts/+: 48 ts, clearly a 2:l:1 ratio, suggesting the possible presence of a genetic modifier. To resolve the uncertainty of the genetic status of the mo6” and m 0 3 ~ lines, homozygotes of each were outcrossed to a wild strain, and the resulting F, progeny were then crossed among themselves and also backcrossed to the temperaturesensitive homozygote. This time the results, shown in Table 3, are entirely consistent with a single-gene basis for the temperature-sensitive phenotype (3: 1 = : ts segregation in the F,, 1:1 backcross segregation, data within all sets of crosses homogeneous). Thus the mutant phenotype of the modaand m 0 3 ~ lines, like those of all of the other mutant lines included in Table 2, can be considered as stemming from recessive micronuclear mutations affecting single gene loci. As it is possible to explain the ratios originally obtained with the mo6”and m03~ lines as being due to the combined effects of a recessive gene responsible for the major phenotype plus an unlinked dominant suppressor, a n extensive series of crosses was undertaken to attempt to confirm the existence of such a suppressor and isolate it free of the moba mutant allele. These crosses, as well as some later testcrosses of the original moba heterozygous assortant to both moba and m06’ homozygotes, provided no evidence for a suppressor. Aberrant ratios in crosses with high viability have also been observed within this study in a completely analyzed F, progeny of a double heterozygote derived from a cross of mo3“ homo. zygotes with moba homozygotes, and in crosses carried out by KACZANOWSKI (1975), McCoy (personal communication) and DOERDER (personal communication). Aberrations of genetic transmission in T . pyriformis are unusual and are considered in detail in a separate communication (McCoy, FRANKEL and JENKINS, submitted).
+:
+:
+
TABLE 3 Genetic analysis of the progeny of a cross of m 0 3 and ~ m06a homozygotes with wild-type B strain ~
~
F2phenotype
Allele
-
4-
~~
-
ts
Dead
Backcross phenotype
+
ts
Dead
mo3
86
26
(50)
70
57
(28)
m06a
19
7
(4)
43
41
(9)
The data represent homogeneous pooled results.
498
J. FRANKEL et
al.
4. Complementation tests. Homozygotes of the different temperature-sensitive mutations were crossed pairwise with one another, and the progeny were examined before macronuclear assortment allowed substantial expression of recessive alleles in heterozygotes. In each case the progeny clones were either all normal or all temperature-sensitive7 indicating complementation and noncomplementation respectively. In all cases in which the F, progeny failed to complement, an F, was constructed and non-complementation was again observed. Complementation tests involving the mo2 mutation necessarily employed a m o 2 heterozygote crossed with homozygotes of the temperature-sensitive mutations. A 1:1 progeny ratio would have been expected if mo2 were allelic with any of the temperature-sensitives, but in fact the progeny of each of these crosses were all wild type. The simplicity of the complementation data permit their summarization in the form of a complementation grid (Table 4). On the basis of the data, six different mo loci have been designated, with one to five alleles in each. Alleles at a single locus are indicated by superscripts. The criteria f o r deciding whether allelic mutant isolates are indeed truly independent deserve comment. Independence is obvious when allelic isolates were obtained in different mutagenesis runs. This is true of mola and molb, of mod" and mobb, and of two subsets of mo3, m 0 3 ~ having -~ been obtained in one run and m o j e in another. For isolates obtained within a mutagenesis run, one cannot have the same certainty. since the clonal isolates that were originally tested had been derived from mutagenized mass culturas. However, the mutant isolates that have been given different superscripts differ reproducibly in the frequency of expresTABLE 4 Complementation of mutations affecting cell divisions
Allele
moi'a molb mo2
mafa mol* nio2
memo+
mo3a
m o + m o + mo
mega mo3 mojC m03~ moje mo6a mobb
mo3b mo3C mojd m 0 3 ~mob"
mo6b
+ + + + + + + + + + + + + + + + + * * + + + + ++ * + + * + *+ ++ ++ +* +mo + *
mo mo
mo mo mo
mo mo
mo
+
+
+
+
+
+
a
+
mo mo *
mo
+
+
mo
e
+
mo mo
+ +
mo
m08~ mol2a mol2b
++ +++
*
a
-
+ a
.
+
e
+
*
e +
+
+
+ + ++ mo + mo + *
+
mo m o . mo
Complementation tests with mo2 carried out using heterozygotes, with other mutants using homozygotes. = wild type (complementing) ; mo = "monster" (noncomplementing) ; = combination not tested.
+
CELL DIVISION MUTATIONS IN
Tetrahymena
499
sion (penetrance) and/or the temperature conditions under which expression is observed (see RESULTS, section 6 ) . Additional evidence for the uniqueness of at section 8. least some of the mo3 alleles will be offered in RESULTS, 5. Macronuclear assortment. The procedure for isolation of mutants was such that the only recessive mutations that could have been detected were those that underwent assortment. However, the kinetics of assortment was examined closely only at the m o l locus. At this locus, m o l + / m o l a heterozygotes assorted at the rate of 0.0104 f 0.0012 pure lines per fission with an output ratio of 59% wild type to 41 % temperature-sensitive ( p value for 1:l output ratio: 0.1 >p>0.05). This rate of assortment is not significantly different from the rate of assortment at other loci that have been studied (summarized in SONNEBORN 1974). It is estimated that the time of macronuclear determination was between 2 and 15 fissions after conjugation. This places mol among the group of loci that undergo early determination (BLEYMAN 1971; ALLENand GIBSON1973; SONNEBORN 1974). It should be added here that the phenomenon of early assortment, together with the likelihood of onset of expression when assortment is still incomplete, makes it virtually impossible to decide whether some of the mutations are recessive or incompletely dominant. In mo3 and mod lines in particular, a small proportion of abnormal cells was observed at 40" in many presumed heterozygous clones even when scoring was performed within 10 fissions of conjugation. This could reflect either a generalized low penetrance of the abnormal phenotype in heterozygotes or expression by the earliest "assortants" that have managed to accumulate a sufficient number of macronuclear subunits determined to express the mutated allele. The fact that many heterozygous clones of mobb were only slightly penetrant soon after conjugation and subsequently became more so is consistent with the assumption that the early expression was due to the onset of phenotypic assortment. However, it is operationally very difficult to prove which of these two alternatives is correct. Attempts were made to detect assortment in the direction of normality of phenotype in m o l a / m o l band m ~ & ~ / m heterozygotes. o6~ Such assortment might have been expected if one assumed that the two mutations were in different base pairs and that intracistronic recombination could occur in the macronucleus. Our efforts in this direction were unsuccessful, but not sufficiently extensive to disprove any hypotheses. 6. Expression. Expression of division blockage of the cell division mutants a t various temperatures is summarized in Table 5. The two independently isolated mo6 alleles were expressed identically at all tested temperatures, while the mol, mo8, and m o l 2 alleles differed in the straightforward manner that one would expect of alleles with gene products showing varying degrees of "leakiness" of function. This is most striking at the m o l locus; the m o l a homozygotes at 36" sometimes manifested a partial inhibition of fission zone formation very similar to that brought about in the weaker m o l b homozygotes at 39.5 to 40", providing strong evidence for the essential similarity of the action of these two mutated alleles.
500
J. FRANKEL
et 01.
TABLE 5
Expression of division blockage in homozygous mutations affecting cell division Mntagenecis run Mutation ~
~~
1 2
mola molb
2 2 2 2 3
moja moSb m03~ m03~ moJe
2
moba mobb
3 2 2
mOga
3 3
mol2a mol9
mo8b
_ _ _ ~ _ _ _ 40
35
Expression a t ( " C ) *
3F
++++ ++++ +++0 ++ +/o + + +++ ++++ ++++ ++++ + +++ +/o+ ++++ ++++ + +/o +(+I ++ ++ ++(+) +++ +/O+ +/o0 0 +++ +/o+ 0 (+)
+(+)
22-25
15
Penetrance at 40":
0 0
0 0
100% -50%
+ +++0
0.
+0 t/o
++0 ++++
80-100% 100%