Apr 29, 2016 - In this paper we present the development of a modulated web ... AP] 29 Apr 2016 ... Apache HTTP server (http//:www.apache.org), the latter for hosting and ... displaying the best hardware configuration for a computer (server) ...
MWStat: A Modulated Web-Based Statistical System Francisco Louzadaa and Anderson Araa a
Universidade de São Paulo, Instituto de Matemática e Ciências da Computação, São Carlos, SP, Brazil
arXiv:1605.00040v1 [stat.AP] 29 Apr 2016
Abstract In this paper we present the development of a modulated web based statistical system, hereafter MWStat, which shifts the statistical paradigm of analyzing data into a real time structure. The MWStat system is useful for both online storage data and questionnaires analysis, as well as to provide real time disposal of results from analysis related to several statistical methodologies in a customizable fashion. Overall, it can be seem as a useful technical solution that can be applied to a large range of statistical applications, which needs of a scheme of devolution of real time results, accessible to anyone with internet access. We display here the step-by-step instructions for implementing the system. The structure is accessible, built with an easily interpretable language and it can be strategically applied to online statistical applications. We rely on the relationship of several free languages, namely, PHP, R, MySQL database and an Apache HTTP server, and on the use of software tools such as phpMyAdmin. We expose three didactical examples of the MWStat system on institutional evaluation, statistical quality control and multivariate analysis. The methodology is also illustrated in a real example on institutional evaluation.
Keywords: Online Survey, Statistical System, Real Time Results, Statistical Methods.
1. Introduction For decades the pattern of rationality based on statistical analysis has experienced slowness, which begins with the data collection, passes by the statistical analysis itself, and ends up in the final presentation of the results obtained in form of a report. For instance, in traditional data collect research there is a gap in time between the application of a questionnaire, the obtainment of the answers of respondents, the application of statistical techniques and the visualization of informative reports on the final results, i.e., possibly a slow process that often may involve a high cost. On the other hand, on account of internet democratization, online surveys are becoming widely used. In an informal survey over the network, Kaye and Johnson (1999) identified over 2000 surveys in 59 different areas that benefit from the technology focused on online questionnaires. Solomon (2001), Fricker et al. (2005) and Cox and Cox (2008), amongst others, show internet based surveys offer significant advantages over traditional survey techniques. However, despite the wide use of online research, the gap in time between the begin of a survey and the final presentation of the statistical analysis results remains. Thus, there is a real need for a environment which facilitates the application of a survey while directly connecting the responses in a customizable real time informative report in order to quickly provide all the information generated by the survey. Preprint submitted to
May 3, 2016
Over the world wide web we can find some environments that organize national statistics datasets, such as the Virtual Statistical environment housed on http://www.virtualstatisticalenvironment.org/, as well as, there are environments which collect online data focusing on creating and publishing online surveys, such as the SurveyMonkey (http://www.surveymonkey.com/) and QuestionPro (http://www. questionpro.com/). It is also easily found statistical systems for specific statistical analysis, such as Young Tung and Schuenemeyer (1991), Krtolica et al. (1991), Hatanaka and Yamada (2003), Analytica (http://www.lumina.com/), and Plug&Score (http://plug-n-score.com), just to name a few. Moreover, some online statistical environments are capable to produce some simple plots, frequency tables, cross-tabulation and summary measures. SOCR (Dinov, 2006) (http://www.socr.ucla.edu/) proposes a suite of Java applets for statistical online computation, visualization, analysis and virtual experimentation, EasyCalculation environment (http://easycalculation.com/) is a free online math website which helps users to learn mathematics and statistics. The above environments cannot carry out customized statistical analysis which may involve more sophisticated procedures, such as a regression analysis, a multivariate analysis, quality control charts, among others. Other environments such as the R-PHP (Mineo and Pontillo, 2006) (http://dssm.unipa.it/R-php/), RStudio (RStudio, 2012) and rApache (Horner, 2012) allow the utilization of R software directly online, that may be installed on any server. These environments have a sophisticated communication between the R software and servers, but do not interact dynamically with users who do not have knowledge of the R language. The environment JStatCom (Krätzig, 2007) defines some classes to connect existing math libraries (Ox, Matlab or R programming languages) with Java client. The Rweb environment (Banfield, 1999) has three different versions, the first allows to type the code, click the submit button and a page with the results is returned, the second is based on Javascript procedures and the third is designed as a point click interface that can be used in introductory statistic courses. Also, Online Analytical Statistical Information System (OASIS, 2015) is a online system that provides some sophisticated and public analysis of health and social science data. And, R-fiddle (R-FIDDLE, 2015) provides a free environment to write, run and share R-code right inside the browser. Another approach for interactivity is performed by Shiny (Chang et al., 2015), a R package with a straight connection from R to a webserver. It is divided in two components: a user-interface script and a server script. In this case Shiny has its own structure to perform web applications, but with restricted HTML or PHP customisation. In the present paper we built the MWStat virtual environment, with easy HTML or PHP customisation, overcoming the problems discussed above. The MWStat is based on a scheme of devolution of real time results, accessible to anyone with internet access. In other words, these procedures are focused on how to build a user-friendly interface and how to relate any website with the R software to generate dynamic results for any online purposes. The procedures exposed in this paper may be easily applied by statisticians with a basic knowledge of web programming. The structure is accessible and built with an easy interpretation language (PHP) and strategically applied in online applications. This procedure can be considered an system, since it replaces the manual collecting data and is able to expose more targeted results to real problems. The MWStat relies on the relationship of several free open-source languages, namely, PHP (http//: www.php.net), R (http//:cran.r-project.org), MySQL database (http//:www.mysql.com) and an
2
Apache HTTP server (http//:www.apache.org), the latter for hosting and interpreting other languages. Moreover, we used the phpMyAdmin interface (http//:www.phpmyadmin.net) as an auxiliary tool, related to the administration of MySQL database using PHP language. These technologies were gathered in a LAMP server (Linux, Apache, MySQL and PHP), which is a popular solution of free open source software to build a viable web server of general purpose with a low costing structure and high performance (Neiderauer, 2004). Combining all the technologies above, the MWStat can perform online collection and data analysis, and the obtained results are provided in real time, depending only on the processing time of the statistical analysis to be considered. Moreover, the MWStat is also very flexible, since it is completely customizable and it can be built into independent modules, according to the user needs. The main objective of the present paper is to present the MWStat and the softwares involved in its construction, displaying some technical procedures on how to building it. Following this paper, anyone with some computational knowledge may build a web based statistical system environment that performs online statistical analysis for any purposes. The versions of the software used in this work are provided, but the same procedures can be extended to different versions or even other operating environment platform and database software. We provide the basic codes for the implementation of the R environment on any LAMP server, but more detailed codes are available in our homepage (http://www.mwstat.com). In Section 2 the softwares used for building the MWStat and their considered versions are displayed. In Section 3 we show the procedures for server installation and setup, which are necessary for the interpretation of the languages. In Section 4 we present examples of the MWStat implementation for event evaluation, as well as for two more areas, statistical quality control and multivariate analysis, those can be accessed in the MWStat homepage through login and password provided. Moreover, a fourth example is also provided on institutional evaluation, which has been used in several applied researchers in Brazil. We finish the paper with some final comments in Section 5, where we also present the web based statistical system homepage and the various applied research developments based on its environment. 2. Softwares applied for building the MWStat environment In this section, we present the software used in the construction of the MWStat. Essentially, they are free softwares which can be easily found on the web. • Linux Ubuntu Server 9.10 (or higher): Ubuntu is a complete Linux operating environment, completely free, with great practicality, configuration and use (Tarng and Liou, 2006). The installation file of this operating environment is available on website http://www.ubuntu.com, where the image of its installation CD can be downloaded. • R software: computing environment for the performance of statistical analysis and graph building. It compiles and runs on a wide variety of UNIX platforms, Windows and MacOS. In our case, we used the R implemented in UNIX through a Linux server. • MYSQL 5.0 (or higher): database management environment (DBMS) that uses the SQL (Structured Query Language) as interface. It is currently one of the most popular databases, with over 100 million installations worldwide.
3
• PHP 5.0 (or higher): (James and Ware, 2003) acronym for Hypertext Preprocessor, is a language for creating script directly into the server designed specifically for the web. Within an HTML page, PHP codes can be executed every time the page is visited. This code is interpreted on the web server and generates HTML viewing or other display type. Below are listed some advantages of PHP: high performance; interfaces for many different database environments; integrated libraries for many common tasks from the web; Low cost, Easy to learn and use, portability, availability to source code. Version 5.0 was developed to improve to Object Oriented Programming and is available now in version 5.2.13 (http://www.php.net). • phpMyAdmin 2.7.0-pl2: (or higher): computer program developed in PHP to administer MySQL over the Internet. From this environment you can create and remove databases; create, delete and modify tables; insert, delete and edit fields, execute SQL code and manipulate key fields. For this paper, we used implemented features and bug fixes up to version 2.6.2 (http://www.phpmyadmin. net).
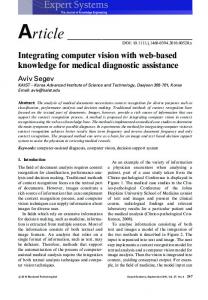
Figure 1: General structure of the systemenvironment.
3. Implementation procedures For describing the implementation procedures, we focus on listing the procedures for creating the MWStat environment, as well as the software installation, settings and programming, at the expense of displaying the best hardware configuration for a computer (server) to implement the system, which is out of the scope of the paper. We show the implementation of the environment in an Ubuntu Linux server, with web support (Apache), PHP and MySQL, also known as LAMP server. The Linux operating environment was installed on a specific computer, following these steps: 1. Through the installation file from the Ubuntu 9.10 Linux, we create a CD to start the computer from it, in other words, do the boot from the CD. If the CD does not run automatically, we must configure the Setup (BIOS) for boot priority. 4
2. Choose the preferred language (shortcut to select language: F2). 3. Start the installation, click Install Ubuntu Server. 4. After the detection of the network cards on the computer, we must perform the configuration of the static IP, in other words, the number for the network interface card eth0. 5. Name the server: OnlineSytem. 6. Choose a location: for example, Sao Paulo, Brazil. 7. After that, we started the disk partitioner through the "assisted partitioning - use entire disk" where in this case, all necessary partitions will be created automatically. 8. Inform the administrator user name and password. 9. Inform the Proxy server address, if any. 10. We must select the packages to be installed along with the environment: the LAMP Server. 11. Once the environment and the chosen services are installed, the server will restart. After performing the procedures above, the server created can be accessed from any browser (eg Internet Explorer, Mozilla, Opera etc) through its IP address, showed in Step 4. Figure 1 shows the overall MWStat environment server structure. We may configure the server directly on the machine installed, by Linux’ Shell. Therefore, we are interested in creating a specific place for environment files, making it available through the Internet, installing the R software and creating an environment where it can generate graphs and communicate with the MySQL database software. We start the configuration process by creating a user and their respective folder, where the environment files will be. By taking the user name usertest, use the following command: sudo useradd usertest In this case, a folder is created in home /usertest/ where the files created by this user will remain, we shall use this folder to save the environment files. Likewise, we can redirect this folder to a fixed address on the Internet. Thus, we edit the alias file with the command: sudo nano /etc/apache2/conf.d/alias Notice that in this case we use the nano text editor, which is a traditional editor of the Linux Ubuntu. After opening this file, insert the following lines: Alias /dados/home/usertest/ Options Indexes FollowSymLinks AllowOverride All Order allow,deny Allow from all After running the commands above, files that are in the home directory /usertest/ can be accessed directly through a browser using the address IP/data/.
5
Inside the directory /usertest/ we can create a new directory and save the phpmyadmin files there, where we can manage the tables in MySQL. In this context, we must install the R software on our server. We must enter the address http://cran. r-project.org/bin/linux/ubuntu/ and after that, perform the installation. The entire procedure can be done through the following commands: sudo nano /etc/apt/sources.list sudo apt-get update sudo apt-get install r-base After the construction to this entire structure, we still have to provide the R software with the ability to generate graphics in the Linux environment. We applied ghostscript technology and used the following command line: sudo apt-get install gs We must also provide the R software with the ability to connect with the MySQL database. For such, we used the package RMySQL (James and DebRoy, 2006), installed with the command: sudo apt-get install r-cran-rmysql Directly from the server, we can run the software just by typing R in any directory. The commands in R language to access the MySQL database are displayed below (they must necessarily be in .r format and saved on the server): require(RMysQL) con