van Zuylen et al. SpringerPlus (2015) 4:336 DOI 10.1186/s40064-015-1128-y
Open Access
RESEARCH
Myocardial infarction models in NOD/Scid mice for cell therapy research: permanent ischemia vs ischemia–reperfusion Vanessa‑Leigh van Zuylen1,2†, Melina C den Haan1†, Helene Roelofs2, Willem E Fibbe2, Martin J Schalij1 and Douwe E Atsma1*
Abstract Myocardial infarction animal studies are used to study disease mechanisms and new treatment options. Typically, myocardial infarction (MI) is induced by permanent occlusion of the left anterior descending artery. Since in MI patients coronary blood flow is often restored new experimental models better reflecting clinical practice are needed. Here, permanent ischemia MI (PI group) was compared with transient ischemia (45 min) (IR group) in immunode‑ ficient NOD/Scid mice. Cardiac function, infarct size, wall thickness and total collagen deposition were significantly reduced only in PI mice. Cardiac inflammatory cells and serum cytokine levels were less dynamic in IR animals compared to PI. So although IR better reflects clinical practice, it is secondary to PI for investigating cell therapy, since it induces too little damage to provide a measurable therapeutic window. MI did result in significant changes in the inflammatory state, indicating this immunodeficient mouse strain is valuable to study human cell therapy. Keywords: Myocardial infarction, Ischemia/reperfusion, Inflammatory response, Cytokines, Cell therapy, Immunodeficient mice Background As cardiovascular diseases, including myocardial infarction (MI), remain one of the leading causes of death globally (Roger et al. 2012), the search for new therapies continues. Cell therapy has emerged over the past years as a potential treatment modality for MI patients in addition to conventional treatment (Zimmet et al. 2012). Before the various candidate cell types are to be applied in clinical trials, they have to be investigated in experimental disease animal models (Johnston et al. 2009; Williams and Hare 2011; Katare et al. 2011; Yoon et al. 2010; Gu et al. 2012). To mimic future clinical use of these cells as much as possible, typically human cells are studied in animal models. To avoid rejection of these infused cells by the immune system of the host and to avoid the use *Correspondence:
[email protected] † Vanessa-Leigh van Zuylen and Melina C den Haan contributed equally to this study 1 Department of Cardiology, Leiden University Medical Center, Albinusdreef 2, P.O. Box 9600, 2300 RC Leiden, The Netherlands Full list of author information is available at the end of the article
of pharmacological immune suppression, immunedeficient animals such as the non-obese diabetic/severe combined immunodeficient (NOD/Scid) mice strain are used. The SCID mutation results in an impaired T and B cell lymphocyte development which allows transplantation of different cell-types originating e.g. from peripheral blood, bone-marrow or organs (Simpson et al. 1991). MI in mouse models typically is induced through permanent ligation of the left anterior descending artery (LAD). However, in current clinical practice rapid restoration of coronary blood flow is the cornerstone of MI treatment, rendering the permanent coronary artery ligation mouse model less representative of the clinical situation. Tissue inflammation is an important element in cardiac remodelling after MI. Coronary artery occlusion induces an inflammatory cascade which can be divided in three partially overlapping phases of inflammation, proliferation and maturation (Frangogiannis 2006). Reperfusion of infarcted cardiac tissue leads to an increased and accelerated inflammatory response possibly deteriorating cardiac remodelling (Entman and Smith 1994).
© 2015 van Zuylen et al. This article is distributed under the terms of the Creative Commons Attribution 4.0 International License (http://creativecommons.org/licenses/by/4.0/), which permits unrestricted use, distribution, and reproduction in any medium, provided you give appropriate credit to the original author(s) and the source, provide a link to the Creative Commons license, and indicate if changes were made.
van Zuylen et al. SpringerPlus (2015) 4:336
In the present study MI induced by permanent coronary occlusion of the LAD (PI group) was compared with ischemia–reperfusion MI by transient ligation of the LAD (IR group). MI was induced in the immunodeficient NOD/Scid mice, a strain necessary to study the effects of human cell therapy. In both MI models cardiac function was assessed by magnetic resonance imaging (MRI) and pressure–volume (PV) loop measurements. Furthermore infarct size was assessed by MRI and histology and parameters of local and systemic inflammatory response were investigated to determine the relevance of this immunodeficient mice strain in MI research.
Methods Animals
Experiments were performed in 8- to 10-weeks-old male NOD/Scid mice (Charles River Laboratories, Maastricht, The Netherlands). Experiments were approved by the Committee on Animal Welfare of the Leiden University Medical Center and conformed to the Guide for the Care and Use of Laboratory as stated by the U.S. National Institutes of Health. Animals were housed in filter top cages and were given standard diet and water with antibiotics and antimycotics ad libitum. MI model
MI was induced in NOD/Scid mice by permanently (PI group) or transiently (45 min) (IR group) ligating the LAD. Sham-operated animals were used to determine baseline characteristics (Sham group). Mice received 100 µL NaCl, containing 2 µg buprenorphine, subcutaneously before surgery and again 12 h after surgery. The permanent ligation MI model was induced as described earlier (den Haan et al. 2012). Briefly, animals were anesthetized with 5% isoflurane for induction and kept anesthetized with 1.5–2% isoflurane in oxygen for the remainder of the surgical procedure, intubated and ventilated using a rodent ventilator (model 845, Harvard Apparatus, Holliston, MA, USA) with 160 breaths per min and a stroke volume of 220 μL. A left thoracotomy was performed and the LAD was ligated using a 7-0-prolene suture (Johnson and Johnson, New Brunswick, NJ, USA). For the permanent ligation experiment (PI group), the location of the LAD ligation was 1 mm caudally from the tip of the left auricle. For the transient ligation and subsequent reperfusion experiment (IR group), the LAD was transiently ligated for 45 min directly underneath the tip of the left auricle to induce maximum damage, followed by reperfusion. To allow reperfusion of the LAD after 45 min, the ligation was fixed on a tube placed directly on the LAD. Ischemia was confirmed by myocardial blanching. The chest was left open during the entire ischemic period. Based on pilot
Page 2 of 9
data transient ligation was performed for 45 min, since an ischemia duration ≥50 min resulted in unacceptable high mortality rates (100%, either during the ischemic period or afterwards within the first week of the procedure). Five min after LAD ligation in the PI group or 5 min after reperfusion in the IR group, animals received 15 μL phosphate-buffered saline intramyocardially to mimic intramyocardial cell therapy. After 35 min of LAD ligation mice received an intraperitoneal injection of lidocaine (6 mg/kg) to prevent cardiac arrhythmias (Tarnavski et al. 2004). Afterwards, the chest was closed and animals were allowed to recover. Sham animals were operated in parallel, but without LAD ligation and intramyocardial injection, and were used to determine baseline characteristics (Sham group). The mortality rate of the IR group was 33.3% at the end of the experiment, with 25% mortality during the ischemic period or afterwards at the same day of the procedure and 75% mortality during the follow up period of the experiment or during MRI measurements. The mortality rate of the PI group was 41.2% at the end of the experiment, with 14.3% mortality during the procedure or afterwards at the same day of the procedure and 85.7% mortality during the follow up period of the experiment or during MRI measurements. The mortality rate of the Sham group was 25% at the end of the experiment with 100% mortality during the follow up period of the experiment or during MRI measurements. Cardiac MRI
Cardiac parameters were assessed 2 and 14 days postMI using a 7-Tesla MRI (BrukerBiospin, Ettlingen, Germany). Mice were anesthetized with 5% isoflurane for induction and kept anesthetized with 1.5–2% isoflurane in oxygen for the remainder of the procedure and placed on a respiration detection cushion connected to a gating module to monitor respiratory rate (SA Instruments, Inc., Stony Brook, NY, USA). Image reconstruction was performed using BrukerParaVision5.1 software (BrukerBiospin, Ettlingen, Germany). To evaluate cardiac function, a high-resolution 2D FLASH cine sequence was used to acquire a set of 9 contiguous 1 mm slices in short-axis orientation covering the entire heart. Imaging parameters were: echo time of 1.49 ms, repetition time of 5.16 ms, field of view (26 mm)2 and a matrix size of 144 × 192. To determine infarct size, contrast enhanced MRI imaging was performed after injection of a 150 µL bolus (0.5 mmol/mL) of gadolinium-DPTA (Gd-DPTA, Dotarem, Guerbet, The Netherlands) via the tail vein. A gradient echo sequence (FLASH) was used to acquire a set of 14 contiguous 0.7 mm contract-enhanced slices in short-axis orientation covering the entire heart. Imaging
van Zuylen et al. SpringerPlus (2015) 4:336
parameters were: echo time of 1.9 ms, repetition time of 84.16 ms, field of view (33 mm)2 and a matrix size of 192 × 256. All MR data were analysed with the MASS for Mice software package (MEDIS, Leiden, The Netherlands). Endocardial and epicardial borders were manually delineated and a reference point was positioned by an investigator blinded to the experimental status of the data (PI group n = 5, IR group n = 5, Sham group n = 5, overall 15 mice for statistical analysis). Left ventricular function by PV loops
At day 15 after MI, mice were anesthetized again with 5% isoflurane for induction and kept anesthetized with 1–1.5% isoflurane in oxygen for the remainder of the procedure. Via the right carotid artery, a 1.2F pressureconductance catheter (standard; ScisenseInc, London, Canada) was introduced and positioned in the left ventricle (LV). The conductance catheter was connected to a PV control unit FV 896B (ScisenseInc, London, Canada) for online display and recording of LV pressure and volume signals. Parallel conductance and LV pressure–volume signals were measured as described previously (den Haan et al. 2012; Steendijk and Baan 2000). All data were acquired using Powerlab 8/30 Model ML870 (ADInstruments, Spechbach, Germany) and LabChart 7 software (ADInstruments, Spechbach, Germany). Data were analyzed with custom-made software by an investigator blinded to the experimental status of the data (PI group n = 5, IR group n = 5, Sham group n = 5, overall 15 mice for statistical analysis). Histological infarct size
After PV loops hearts were dissected, fixed and cut as described earlier (PI group n = 4, IR group n = 4, Sham group n = 4, overall 12 mice for statistical analysis) (den Haan et al. 2012). The extent of total collagen deposition after MI was evaluated by staining with picrosirius red (0.5 g Sirius red in 500 mL saturated aqueous solution of picric acid) for 1 h. Total collagen deposition was determined by the area stained tissue within the LV as a percentage of the whole LV. This analysis was performed on photomicrographs taken at a twofold magnification of 15–20 sections covering the entire heart from apex to base. The area of Sirius red staining was measured by an observer blinded to the experimental status of the samples, using the ImageJ software package (National Institutes of Health, Bethesda, MA, USA). The effect of MI on LV wall thickness was assessed on the same sections. This analysis was performed on three equidistant sections between the apex and ligature (at the midpoint between the LAD ligature and the apex, between the midpoint and the LAD ligature and between
Page 3 of 9
the midpoint and apex). Wall thickness was measured at two separate border zone areas, at the midpoint of the infarct region and averaged for all three measurements. Measurements were performed perpendicular to the infarcted wall. Cardiac inflammation response
In parallel to the above described experiment, MI was induced by PI or IR in mice that were sacrificed on days 1, 3, and 7 after MI (n = 3 mice per time point, overall PI group n = 9, overall IR group n = 9). Nonoperated animals were used as controls to determine base line characteristics at 1 time point (Control group, n = 3, overall 21 mice for statistical analysis). Hearts were harvested in total, minced with fine scissors, and placed into a solution of 2% collagenase IA (SigmaAldrich, Saint Louis, MO, USA) in PBS and shaken at 37°C for 1 h. The cell suspension was then triturated through a nylon mesh and centrifuged in PBS at 300g for 10 min at 4°C. Red blood cells in the cell pellet were lysed with lysis buffer, and the cells were washed in PBS and subsequently resuspended in medium containing IMDM (Lonza, Verviers, Belgium) supplemented with 2.5% fetal calf serum (FCS; Greiner Bio-one, Monroe, NC, USA) and Penicillin/Streptomycin (P/S; Invitrogen Corp., Paisley, UK). Total cardiac cell numbers were determined with a Sysmex cell counter (Sysmex America, Inc. Mundelein, Illinois, USA). The resulting single-cell suspensions were stained for flow cytometry with primary antibodies for 30 min at 4°C in darkness and the cells were washed with PBS/1% human Albumin (Sanquin, Leiden, The Netherlands) before analysis using a FACSCanto II (BD Biosciences, San Diego, CA, USA). The following antibodies were used: anti-CD90APC, 53–2.1, -B220-APC, RA3-6B2, -CD49b-APC, DX5, -NK1.1-APC, PK136, -Ly-6G-APC, 1A8, CD11beFluor 450, M1/70, -F4/80-FITC, -CD11c-FITC, HL3, -I-Ab -FITC, AF6-120.1, -Ly-6C-PE, AL-21, -CD11c-PE, HL3 (All above antibodies are from BD Biosciences) and C1:A3-1 (ABD Serotec, Kidlington, UK). Monocytes were identified as CD11b high (CD90/B220/ CD49b/NK1.1/Ly-6G) low. They were further divided into Ly-6C high/low (F4/80/I-Ab/CD11c) low as previously described (Nahrendorf et al. 2007; Swirski et al. 2009). Macrophages were identified as CD11b high, F4/80 high. Dendritic cells were identified as CD11b, I-Ab and CD11c high. Neutrophils were identified as CD11b, Ly-6G high. Monocyte and macrophage/dendritic cell numbers were calculated as the total cells multiplied by the percentage of cells within the monocyte/macrophage gate. The analysis of the acquired data was done with FlowJo software version 7.6.1 (Tree Star Inc. Ashland, OR, USA).
van Zuylen et al. SpringerPlus (2015) 4:336
Page 4 of 9
Cytokine measurements
Cytokine measurements were performed on peripheral blood from the same mice that were used to determine the cardiac inflammation response. Mice were sacrificed on days 1, 3, and 7 after MI (n = 3 mice per time point, overall PI group n = 9, overall IR group n = 9). Nonoperated animals were used as controls to determine base line characteristics (Control group, n = 3, overall 21 mice for statistical analysis). Peripheral blood was drawn via cardiac puncture and collected in eppendorf tubes to let the blood coagulate >2 h at room temperature. Subsequently, the samples were centrifuged to separate the blood clot from the serum and the serum was stored at −80°C until cytokine determination. Cytokine concentrations were measured using the Bio-PlexMouse Cytokine 23-plex Panel assay (Bio-Rad laboratories, Inc, Hercules, CA, USA). Statistical analysis
Numerical values were expressed as mean ± standard deviation (SD). Comparison of MRI parameters between the PI, IR and Sham group was performed using twoway repeated-measures analysis of variance (ANOVA), with Bonferroni correction. Comparison of the remaining parameters between the PI, IR and Sham or Control
MRI: infarct size and cardiac function
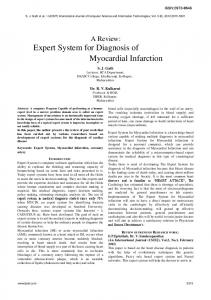
Both 2 and 14 days after MI, the infarct size in animals that were subjected to PI (n = 5) was significantly larger than in the IR model (n = 5) (Figure 1a). This difference in damage between both MI groups was reflected by the cardiac function in the two models. Two days after MI, ejection fraction decreased significantly in the PI group, with a further deterioration of function 14 days after MI (Figure 1b). Both end-diastolic and end-systolic volumes tended to increase in the PI group 2 days post-MI and reached significance at day 14 after MI, when compared to the IR and Sham group (Figure 1c, d). Likewise, stroke volume, cardiac output, wall thickening and wall motion deteriorated significantly in PI animals at day 14 days after MI (Additional file 1: Table S1). In contrast, cardiac function parameters in IR animals did not significantly differ from those in Sham animals. In accordance with the MRI data, PV loop measurements 15 days after MI showed a significant deterioration in cardiac function in the PI group, but not in the IR group (Additional file 2: Table S2).
b
50 40
*
*
20 10
100 80 60 40
*#
Time after MI (days)
150
*#
50
PI IR Sham
200 150 100
*#
50 0
14
2
2
0
End-systolic volume ( L)
d
200
100
Time after MI (days)
14
2
14
2
Time after MI (days)
End-diastolic volume ( L)
*
20 0
0
c
#
14
30
Results
Ejection Fraction (%)
Infarct size (%)
a
group was performed using one-way ANOVA, with Bonferroni correction.
Time after MI (days)
Figure 1 Assessment of left ventricular function and volumes with MRI. MRI analysis of delayed contrast-enhanced images showed a significant difference in infarct size (a) between the PI and IR group, both at t = 2 and t = 14. Assessment of left ventricular function of the PI, IR and Sham group at t = 2 and t = 14: ejection fraction (b), end-diastolic volume (c) and end-systolic volume (d). N = 5 per group. Data are expressed as mean ± SD. *p