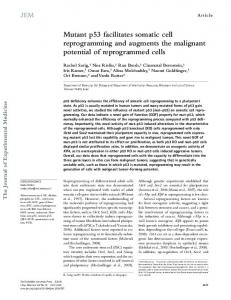
(B) Proliferation of MEFs upon scramble (SCR) and Nac1 shRNAs infection during the first four days of reprogramming. (C) FACS measurements of total GFP ...
Stem Cell Reports, Volume 9
Supplemental Information
NAC1 Regulates Somatic Cell Reprogramming by Controlling Zeb1 and E-cadherin Expression Francesco Faiola, Nuoya Yin, Miguel Fidalgo, Xin Huang, Arven Saunders, Junjun Ding, Diana Guallar, Baoyen Dang, and Jianlong Wang
Figure S1. Nac1 is required for somatic cell reprogramming. Related to Figure 1. (A) Schematic diagram of the reprogramming process. (B) Proliferation of MEFs upon scramble (SCR) and Nac1 shRNAs infection during the first four days of reprogramming. (C) FACS measurements of total GFP positive iPS cells during control and Nac1 KD MEF reprogramming. (D) RT-qPCR analyses showing the efficiency of Nac1 KD in MEFs (Top) and Nac1 mRNA expression levels during reprogramming in Nac1 WT, het, and null lines, as compared to ESCs (Bottom). (E) Nac1 WT and null Oct4-GFP MEF derivation and reprogramming scheme (top), and representative pictures of iPS colonies in bright field and GFP fluorescence (bottom).
Figure S2. NAC1 re-introduction rescues the null iPSC phenotype. Related to Figure 2. (A) Enlarged images of representative colonies for the EV-, hNAC1 WT-, and hNAC1 Cytmediated rescues. (B) WB images showing NAC1 nuclear and cytosolic fractionation in ESCs. (C) Schematic of the 5-day long experiments of Nac1 null aberrant iPS clones rescued with ectopic hNAC1. (D) Samples from (C) were taken at days 0, 1, 2, 3, 4, and 5, and the expression of a known NAC1 target and late reprogramming marker, Dppa3, was tested by RT-qPCR. (E) Expression of selected pluripotency, late reprogramming, and cell adhesion genes in four different Nac1 null abnormal iPS clones upon 2-3 week-long rescues with over-expressed empty vector (EV) or hNAC1 (WT). (F) Images of Nac1 WT and null neural progenitor cells (NPCs) in bright field. (G) RT-qPCR analyses showing down-regulation of Oct4 and Nanog, up-regulation of Tet3 and neuro-ectoderm markers, and expression of Brachyury (T) and Myh6 during the differentiation of Nac1 WT and null ESCs into NPCs. Note that the mesoderm marker T was not expressed in NPCs as expected, and the cardiomyocyte gene Myh6 never significantly expressed during the differentiation process. Both genes serve as negative controls. (H) Image of a typical day-14 iPS colony derived from the reprogramming of Nac1 null NPCs (top). A rare compact colony (bottom) resembling fully reprogrammed iPS colony is also shown for direct comparison. p0 stands for passage zero. (I) Quantification of iPS colonies obtained by reprogramming of Nac1 WT and null NPCs. Colonies were scored based on morphology upon AP staining.
Data in (G) are average values ± SD from representative experiments in triplicates. Day 0 represents ESCs, Day 4 symbolizes Day 4 embryoid bodies, and Day 9 denotes NPCs on monolayer.
Figure S3. E-CADHERIN over-expression rescues the Nac1 WT abnormal iPS phenotype. Related to Figure 4. (A) Representative images of Nac1 WT bad morphology iPS cells after attempted EV, E-CAD and hNAC1 rescues. EV means empty vector and E-CAD stands for E-CADHERIN. (B-C) RT-qPCR assays showing the over-expression of hNac1 (B) and E-cadherin (C) in the rescue experiments in (A). Data are average ± SD of one representative experiment. (D) Heat-map of gene expression of several NAC1 WT and null iPSCs, with or without rescuing attempts with either empty vector (EV), or hNAC1, or E-CADHERIN (E-CAD). X represent the relative amount of the reprogramming virus cassette employed. (E) Hierarchical clustering of the iPS samples analyzed in (D). X is as in (D).
Figure S4. Down-regulation of Zeb1 rescues the Nac1 null iPS morphology. Related to Figure 6. (A) Expression of selected genes by RT-qPCR upon Zeb1 RNAi. Data are plotted as average ± SD from one representative experiment in triplicates. The black bars represent the WT iPSC controls. (B) Morphology of Nac1 null abnormal iPSCs upon attempted rescue with indicated miR-200 family members. Mut stands for negative mutant control.
Table S1 List of primers used in RT-qPCR assays Primer Brachyury (F) Brachyury (R) Cdh3 (F) Cdh3 (R) Cobl (F) Cobl (R) Dennd2c (F) Dennd2c (R) Dll1 (F) Dll1 (R) Dnmt3l (F) Dnmt3l (R) Dppa3 (F) Dppa3 (R) Dppa4 (F) Dppa4 (R) Dppa5 (F) Dppa5 (R) E-cadherin (F) E-cadherin (R) Epb4.9 (F) Epb4.9 (R) Epcam (F) Epcam (R) Fabp3 (F) Fabp3 (R) Fgf5 (F) Fgf5 (R) Foxh1 (F) Foxh1 (R) Gapdh (F) Gapdh (R) Ifitm1 (F) Ifitm1 (R) Jam2 (F) Jam2 (R) Klf2 (F) Klf2 (R) Klf4 (F) Klf4 (R) Lama1 (F) Lama1 (R) Lefty1 (F) Lefty1 (R) Lefty2 (F) Lefty2 (R) Lin28 (F) Lin28 (R)
Sequence (5’-3’) AAGCCTTCCTTGATGCCAAA GAGCCTCCAAACTGAGGGTG CTGATTCAGCCTCTGAGGGA CCGCATCTTAAGGAGACGAA CTGTCTCCTCACTCTCCGCT CCTCAGAGCTGAGACCCAAA GCTTGTGGCGATTCTTTGG CCTTACACTGGAAAGGAAGCC CTCCCCTGGTTTGTCACAGT GGAGAAGATGTGCGACCCT GGATGACCAAGAGACAACTACC TCTTCAGCCCTGGAATGTTG CGGGGTTTAGGGTTAGCTTT GGACCCTGAAACTCCTCAGA ATTCCACTTCTTCCTTCGGC TGGGAGAACTTTCTTTCGGA TCATGGATTCCTCCAGCTTC CAAGATTCGGGCTAAATGGA AAAAGAAGGCTGTCCTTGGC GAGGTCTACACCTTCCCGGT CTGTGGTGTCCTCATCCCTT CTAGCCTTTTGCTTCCTGGG GCTGGCAACAAGTTGCTCTCTGAA CGTTGCACTGCTTGGCTTTGAAGA CTTGGTCATGCTAGCCACCT CTTTGTCGGTACCTGGAAGC AAAACCTGGTGCACCCTAGA CATCACATTCCCGAATTAAGC CCTGAAGAAGGGGAACACTG GATCGCCTTGGTAATTCAGG ACCCAGAAGACTGTGGATGG CACATTGGGGGTAGGAACAC CCTGTCCCTAGACTTCACGG GACCATGTGATCTGGTCCCT GCCAAAATAGCCTCTTGGAA ACTACTTGATCGTCGCCCTG GTGGCAGGTGGAGCCAAG GTTGCACTACGGGCCTCC AACCTTACCACTGTGACTGG AAAAGTGCCTCTTCATGTGT GCTCCAAAATCCAGTTTCCA CTGTCACCCTGGACTTACGG TGTGTGTGCTCTTTGCTTCC GGGGATTCTGTCCTTGGTTT GGAGATGTACCTGGACCTGC CATCTGAGGCGCAGCTACAG TGTTCTGTATTGGGAGTGAGC GCTTGCATTCCTTGGCATG
Map2 (F) Map2 (R) Myh6 (F) Myh6 (R) Nac1 (F) Nac1 (R) Nanog (F) Nanog (R) N-cadherin (F) N-cadherin (R) Nestin (F) Nestin (R) Nodal (F) Nodal (R) Notch2 (F) Notch2 (R) Notch3 (F) Notch3 (R) Ocln (F) Ocln (R) Oct4 (F) Oct4 (R) Pax6 (F) Pax6 (R) pri-miR-200ab-429 (F) pri-miR-200ab-429 (R) pri-miR-200c-141 (F) pri-miR-200c-141 (R) Rex1 (F) Rex1 (R) Sall4 (F) Sall4 (R) Slc2a3 (F) Slc2a3 (R) Slc7a3 (F) Slc7a3 (R) Snai1 (F) Snai1 (R) Snai2 (F) Snai2 (R) Sulf2 (F) Sulf2 (R) Tcea3 (F) Tcea3 (R) Tcfcp2l1 (F) Tcfcp2l1 (R) Tcl1 (F) Tcl1 (R) Tdgf1 (F) Tdgf1 (R) Tet1 (F)
CATCGCCAGCCTCGGAACAAACAG TGCGCAAATGGAACTGGAGGCAAC CTTCATCCATGGCCAATTCT GCGCATTGAGTTCAAGAAGA GTTGCAGTAGGGGGATGTGT AGGGCCTCTACCTTCTCAGC AGGGTCTGCTACTGAGATGCTCTG CAACCACTGGTTTTTCTGCCACCG CAGGGTGGACGTCATTGTAG AGGGTCTCCACCACTGATTC GAGTTCTCAGCCTCCAGCAG AGATCGCTCAGATCCTGGAA TCTGGCGTACATGTTGAGC GGTGGAAAATGTCAATGGTGAG TGTGCCGTTGTGGTAGGTAA TGCTGTGGCTCTGGCTGT GAATCTGGAAGACACCCTGG AAGCGTCTCCTGGATGCTG CCTCCAATGGCAAAGTGAATGGCA TGTTTCATAGTGGTCAGGGTCCGT CTGAGGGCCAGGCAGGAGCACGAG CTGTAGGGAGGGCTTCGGGCACTT AGTGAATGGGCGGAGTTATG ACTTGGACGGGAACTGACAC AGCCTAGGCGGAGACTTAGC AGTGCCTGGGTTCTGCATAC TAGACAATCCCAAGGCCAAG GCCCACTGGAAGAACACAAT ACGAGTGGCAGTTTCTTCTTGGGA TATGACTCACTTCCAGGGGGCACT AGTGATGTGGCTTGTGACCA AACCCGCTTCTTTCCAAAAT ATCGTGGCATAGATCGGTTC TCTCAGCAGCTCTCTGGGAT CCTCTTGCAATTCCATTTCC GACTCTGCTTGCTCACTCCC TTGTGTCTGCACGACCTGTGGAAA TCTTCACATCCGAGTGGGTTTGGA CACATTCGAACCCACACATTGCCT TGTGCCCTCAGGTTTGATCTGTCT GTGTCGTGAGGATGGGATTC GTTCCTCCCGCGATCTAGC GTTGGATCTTTCCAGCGAAG CTCCACCAAGGAAGAAAGGA AGCCGGATTTCATACGACTG CGCCCCTACAGTATGTGTTG CGCAAGATCACCTGGAATTT TGTGGATCTGGGAGAAGCA GGTCCAAATTCAAACGCACT CCTCCAACGTTTTTACGAGC ATTGAGGTGGAGAAGTGGG
Tet1 (R) Tet2 (F) Tet2 (R) Tet3 (F) Tet3 (R) Upp1 (F) Upp1 (R) Zeb1 (F) Zeb1 (R) F: forward primer R: reverse primer
GGAGAAGGGTTGGTTTGC ACATCCCACCTCTGTCCATT GAACTATACATCACTGTGCGTCA CAGAACCAGGTGACCAATGAGG TGGGCGTGGGCACAGAAGT TTCAGTTCCTGTAGCTGCCA CGAAGTGATTGACTGGTGGT TGCTCACCTGCCCGTATTGTGATA AGTGCACTTGAACTTGCGGTTTCC
Table S2 List of primers used in ChIP-qPCR assays Primer Gapdh (F) Gapdh (R) Nanog 1 (F) Nanog 1 (R) Nanog 2 (F) Nanog 2 (R) E-cad -1K (F) E-cad -1K (R) E-cad -0.2K (F) E-cad -0.2K (R) E-cad 0.1K (F) E-cad 0.1K (R) E-cad 0.2K (F) E-cad 0.2K (R) Zeb1 -2K (F) Zeb1 -2K (R) Zeb1 -1.9K (F) Zeb1 -1.9K (R) Zeb1 -1K (F) Zeb1 -1K (R) Zeb1 -0.7K (F) Zeb1 -0.7K (R) Zeb1 0K (F) Zeb1 0K (R) Zeb1 1K (F) Zeb1 1K (R) miR-141/200c 1 (F) miR-141/200c 1 (R) miR-141/200c 2 (F) miR-141/200c 2 (R) miR-200ab/429 1 (F) miR-200ab/429 1 (R) miR-200ab/429 2 (F) miR-200ab/429 2 (R) F: forward primer R: reverse primer
Sequence (5’-3’) AAGCTCATGAGGCACAGAATGGTC TGGGTACATGGTGACTTTCCTAGGC GTTTTGACTGCTAACCACCCAGAG GGCAGGCTTGCTACATTCCTTATC GGCATTTGTGAGTATAGGGGTAGG CCTGTTCTGTGTCAGCACACTTAG CATGCTGGGCTACATAGCAA TGGGCCTGGAATTGTCTTAG ACAGCTAGGCTAGGATTCGAAC TGTCTGTAGTTGGTGGCATGG ACCCGAGCTCAGTGTTTGC GGCAGAAAAACACAGCGAAG TCCGCTTCGCTGTGTTTTTC CTCCGGATCCCAACTTTCTTG ATCCCACGGAAAGGTTACTGTC ACACACAAACAGCCCAGAAG TCTTCTGGGCTGTTTGTGTG TCCTGGCTTGTGAACACTTC TTTGAAAAGGGGTGGGAAGC AGGGTTACTAATGTGGGCTGAC CAATGGCAAGTCACTACAACCC AATTCCGCTCACAGGAAAGC CTCGAGCATTTAGACACAAGCG TCCGCCACTCACCGTTATTG ATTGATTTCCGCGGATGTGC AACCCACCACCAACAACAAC CTTCCGGTGCCCTTTCTCC GGCGTCCAGCTAAGTCCTTCA GGACTATGAGGAGCGAGTG CCCAGTAACCCTGACCAA CTTGTCAGTTGAGCCATTTC CTTACAGATTCCCAGCCAC TTGCCTTAGAACTCCACAG AGAACACCATTATGCCTTG
Supplemental Experimental Procedures Plasmids Piggybac-based expression plasmids for hNAC1, KLF4, E-CAD, OCLN, and ESRRB, were generated by PCR amplification of the respective genes with the following oligos. hNAC1: forward
5’-AGGGATCCGCCCAGACACTGCAGATGG,
CTTAATTAATTACTGCAGGGCTTCAGCC;
reverse
5’-
forward
Klf4:
5’-
reverse
GCTAGCAGGCAGCCACCTGGCGAGTCTG, TTAATTAATTAAAAGTGCCTCTTCATGTG;
5’forward
E-cadherin:
5’-
AGCTAGCGGAGCCCGGTGCCGCAGCTTTTC,
reverse
5’-
CTTAATTAACTAGTCGTCCTCGCCACCGCC;
Ocln:
5’-
reverse
5’-
AGCTAGCTCCGTGAGGCCTTTTGAAAGT, CTTAATTAACTAAGGTTTCCGTCTGTCATAGTCT;
forward
Esrrb: reverse
GCTAGCGACGTGTCCGAACTCTGCATCC,
5’5’-
TTAATTAATCACACCTTGGCCTCCAGCATC. The PCR fragment was then purified from an agarose gel, digested with Nhe I (or BamH I) and Pac I, and ligated into the piggybac vector pPB-3XFLAG described in (Theunissen et al., 2011). pPB-NANOG was previously described (Costa et al., 2013). pPB-hNAC1 Cyt was cloned as the hNAC1 WT plasmid, but the PCR fragment was amplified from the plasmid pMXs-FHG-NAC1mut-C described in (Okazaki et al., 2012).
For the cloning of pLKO-shZeb1-pim, two shRNA duplexes were synthesized (Sigma-Aldrich) and cloned into the lentiviral vector pLKO.1PuroR-IRES-mCherry (pLKO-pim), as described in (Gingold
et
al.,
2014).
The
Zeb1
shRNA
sequences
were:
CCTGTGGATTATGAGTTCAAA; shZEB1 II: CCGAACTGCAAGAAACGGTTT.
shZEB1
I:
To knock-down Nac1 during reprogramming, we employed the retroviral plasmid MSCV-LTRmiR30(Nac1-2704)Pgk-PURO
with
the
following
Nac1
RNAi
sequence:
5'-
CGAATGAAATATTGAAGTA-3'. As control we used the corresponding pLMP vector with a scramble RNA sequence (Fidalgo et al., 2012). The luciferase reporter plasmids, pGL3-basic-hCdh1P and pGL3-basic-hZeb1P, are described in (Xiong et al., 2012). The pMX retroviral plasmids for miR200a/200b/200c/429/141/200cmut7n are described in (Hu et al., 2014) The plasmids pLenti4.1ExmiR200b-200a-429 and pLenti4.1ExmiR200c-141 were a gift from Greg Goodall (Addgene plasmids # 35533 and 35534) (Gregory et al., 2008)
Cellular protein fractionations, SDS-PAGE, and Western Blotting Non-nuclear extracts were obtained by lysing the cells in Lysis Buffer 1 (20 mM Hepes (pH 7.0, 10 mM KCl, 2 mM MgCl2, 0.5% NP-40) supplemented with 1 mM PMSF and protease inhibitor cocktail (Sigma). Nuclear pellets were first washed with Lysis Buffer 2 (150 mM NaCl, 1 mM EDTA, 20 mM Tris pH 8.0, 0.5% NP-40) without inhibitors, and then lysed by pipetting up and down in Buffer 2 supplemented with PMSF and protease inhibitor cocktail. Polyacrylamide gel electrophoresis and Western Blotting were performed according to standard procedures.
Transfection, virus production, and cell transduction For transfections, iPSCs were detached by trypsinization. Meanwhile, the indicated pPB plasmids and the transposase pBASE with a 1:2 ratio, were pre-incubated with Lipofectamine 2000 or 3000 (Life Technologies) in OptiMEM (Life Technologies) for 10 minutes at room temperature. DNA-lipo complexes were then used to re-suspend the cells at room temperature for 10 min. Transfected cells were then plated in Serum/LIF ES medium. Media were replaced
the following day. For HEK293T cell transfection, jetPEI (Polyplus Transfection) was used according to the manufacturer’s instructions. Lentiviruses were generated in HEK293T cells with the lentiviral pLKO or STEMCCA vectors, and the packaging pCMV-dR8.2 and the pCMV-VSVG envelope plasmids, by transfection with jetPEI or Lipofectamine 3000. Media were changed 4-8 hrs after transfections. Two days later, supernatants were collected and either directly used for infections, or the viruses were concentrated in Amicon Ultra centrifugal filter units (Merck Millipore), following the manufacturer’s suggested procedures. Cells were infected in presence of 8 µg/ml polybrene (Sigma Aldrich), and when appropriate, selected with 1.5 µg/ml puromycin for 3-5 days before RNA extraction. For retrovirus generation, Plat-E cells were transfected with the pLMP or the pMX plasmids by the calcium chloride and 2X BES (14280, Sigma-Aldrich) method. Viruses were collected and concentrated as detailed above. Alternatively, cells were transfected with Lipofectamine 3000 and the supernatants directly collected and used for infections.
Microarray and RNA-seq analyses Microarray data for iPS samples were collected using an Illumina Bead Array Reader confocal scanner. Image raw data were processed with the GenomeStudio software (Illumina) and exported with basic normalization and background correction. Then gene expression data were imported and analyzed using the BRB-ArrayTools (version 4.4.0., http://linus.nci.nih.gov./BRBArrayTools.html). Significantly up- or down-regulated genes were obtained by fold change > 2 and P-value < 0.05 by student t-test between Day 0 and Day 5 samples. Hierarchy clustering analysis was performed for the differentially regulated genes with Gene Cluster 3.0 software (http://bonsai.hgc.jp/~mdehoon/software/cluster/) and visualized with the TreeView program (version 1.1.6, http://jtreeview.sourceforge.net).
For RNA-seq analyses, raw reads in fastq format were filtered by removing adaptor sequences and low quality reads. Only samples with Q20 ≥ 95% and Q30 ≥ 90% were considered for further analyses. The genome sequence of mouse ESCs retrieved from the Mouse GRC38/mm10 database (http://genome.uscs.edu), was used as the reference database. All the clean reads were then mapped to the reference genome using Bowtie2 (Langmead et al., 2009). Quantitative gene expression was determined by the RSEM software (Li and Dewey, 2011). Annotation of differentially expressed genes (DEGs) was performed by analyzing syntenic relationships between samples. The significance of gene expression difference was set at Log2 (fold change) ≥ 2 with a false discovery rate (FDR) < 0.001. After normalization, hierarchical clustering was performed with Cluster (de Hoon et al., 2004; Eisen et al., 1998), and visualized with TreeView (Saldanha, 2004). Principal component analysis (from PC1 to PC13) was performed at BGI according to their standard guidelines.
Reprogramming assays For Nac1 KD assays, fifty thousands Oct4-GFP MEFs were seeded in 6-well plates in DMEM supplemented with 10% serum one day before infection. At day 0, cell were infected simultaneously with shRNA lentiviruses for Nac1 or scramble control, and the hSTEMCCA lentivirus (Merck Millipore) expressing the four human Yamanaka factors. The following day, cells were selected with 5 µg/mL puromycin in ES medium for four days, and then five thousands of them reseeded on feeders in triplicates under 1.5 µg/mL puromycin selection. iPS colonies were scored according to GFP fluorescence or upon alkaline phosphatase staining, according to color intensity. Nac1 WT, het, and null MEFs were reprogrammed with hSTEMCCA as above, but without puromycin selection.
Neural progenitor cell generation and reprogramming
To obtain neural progenitor cells (NPCs) from mESCs we followed a protocol described in (Bibel et al., 2007; Li et al., 2015). Briefly, day 8 EBs incubated with retinoic acid (RA) for four days, were enzymatically dissociated in single cells and plated on monolayer in dishes coated with laminin/poly-l-lysine. To generate iPSCs, 500 K NPCs were infected with STEMMCA viruses as described above.
ChIP-qPCR assays For ChIP experiments, 3-5 µg anti-FLAG M2 (F1804, Sigma), and anti-NANOG (A300-397A, Bethyl Laboratories) antibodies, were pre-bound to 30-50 µL protein G Dynabeads magnetic beads (Life Technologies) over night at 4°C, with gentle rotation. For each IP, 150-200 µg chromatin were incubated with the pre-bound antibodies for 6-8 hrs at 4°C, with gentle rotation. IPs were then washed four times with RIPA Buffer (50 mM HEPES pH 7.5, 500 mM LiCl, 1 mM EDTA, 1% NP-40, 0.7% Na-Deoxycholate), once with TE pH 8.0, eluted once, reverse crosslinked for ≥ 6 hrs at 65°C, and purified with QIAquick PCR purification kit (Qiagen). qPCR primer sequences are provided in Table S2.
Luciferase assays For luciferase detection experiments, Nac1-/- ESCs or HEK293T cells were transfected with Lipofectamine 2000 or jetPEI, respectively, with the indicated plasmids (200-1000 ng each). 48 hrs after transfections, cells were lysed and luciferase activity measured according to the luciferase assay system from Promega. Luciferase values were normalized to protein content.
Statistical analysis Statistical analyses were performed with an unpaired, two-tailed Student’s t-test. Significance values are indicated in the figure legends.
Supplemental references Bibel, M., Richter, J., Lacroix, E., and Barde, Y.A. (2007). Generation of a defined and uniform population of CNS progenitors and neurons from mouse embryonic stem cells. Nature protocols 2, 1034-1043. de Hoon, M.J., Imoto, S., Nolan, J., and Miyano, S. (2004). Open source clustering software. Bioinformatics 20, 1453-1454. Eisen, M.B., Spellman, P.T., Brown, P.O., and Botstein, D. (1998). Cluster analysis and display of genome-wide expression patterns. Proceedings of the National Academy of Sciences of the United States of America 95, 14863-14868. Gingold, J.A., Fidalgo, M., Guallar, D., Lau, Z., Sun, Z., Zhou, H., Faiola, F., Huang, X., Lee, D.F., Waghray, A., et al. (2014). A genome-wide RNAi screen identifies opposing functions of Snai1 and Snai2 on the Nanog dependency in reprogramming. Mol Cell 56, 140-152. Gregory, P.A., Bert, A.G., Paterson, E.L., Barry, S.C., Tsykin, A., Farshid, G., Vadas, M.A., Khew-Goodall, Y., and Goodall, G.J. (2008). The miR-200 family and miR-205 regulate epithelial to mesenchymal transition by targeting ZEB1 and SIP1. Nat Cell Biol 10, 593-601. Hu, X., Zhang, L., Mao, S.Q., Li, Z., Chen, J., Zhang, R.R., Wu, H.P., Gao, J., Guo, F., Liu, W., et al. (2014). Tet and TDG mediate DNA demethylation essential for mesenchymal-to-epithelial transition in somatic cell reprogramming. Cell stem cell 14, 512-522. Langmead, B., Trapnell, C., Pop, M., and Salzberg, S.L. (2009). Ultrafast and memory-efficient alignment of short DNA sequences to the human genome. Genome Biol 10, R25. Li, B., and Dewey, C.N. (2011). RSEM: accurate transcript quantification from RNA-Seq data with or without a reference genome. BMC Bioinformatics 12, 323. Li, T., Yang, D., Li, J., Tang, Y., Yang, J., and Le, W. (2015). Critical role of Tet3 in neural progenitor cell maintenance and terminal differentiation. Molecular neurobiology 51, 142-154.
Saldanha,
A.J.
(2004).
Java
Treeview--extensible
visualization
of
microarray
data.
Bioinformatics 20, 3246-3248. Theunissen, T.W., Costa, Y., Radzisheuskaya, A., van Oosten, A.L., Lavial, F., Pain, B., Castro, L.F., and Silva, J.C. (2011). Reprogramming capacity of Nanog is functionally conserved in vertebrates and resides in a unique homeodomain. Development 138, 4853-4865. Xiong, H., Hong, J., Du, W., Lin, Y.W., Ren, L.L., Wang, Y.C., Su, W.Y., Wang, J.L., Cui, Y., Wang, Z.H., et al. (2012). Roles of STAT3 and ZEB1 proteins in E-cadherin down-regulation and human colorectal cancer epithelial-mesenchymal transition. The Journal of biological chemistry 287, 5819-5832.