predicted conflicts (i.e. losses of minimum separations between aircraft.) ..... trial plans, the time from detection to the first loss of separation, and the number of ...
9th AIAA Aviation Technology, Integration, and Operations Conference (ATIO)
and
Air 21 - 23 September 2009, Hilton Head, South Carolina
AIAA 2009-6905
Nationwide Evaluation of a Conflict Resolution Algorithm Larry A. Meyn* NASA Ames Research Center, Moffett Field, CA, 94035
A primary function of today’s air traffic controllers is monitoring aircraft and resolving predicted conflicts (i.e. losses of minimum separations between aircraft.) Research is under way to develop automated separation assurance technology to enable safe accommodation of significantly higher traffic demands than can be handled by human controllers. This paper presents simulation results for one such automation concept, the Advanced Airspace Concept, for a full day of flight operations over the continental United States. Comparisons of conflict metrics to previous system-wide studies, which did not study resolutions, are presented. Then the regional variations in conflict metrics, such as the number of conflicts, phases of flight and the encounter angles for conflicting flights are presented. Metrics of resolution performance, such as delay incurred, and the number of trial plans required before a successful resolution maneuver is found are also presented. The results show that there are extremely large variations in the range of the resolution metrics, but statistical analysis is provided to show that resolution performance does vary due to conflict characteristics and the number of aircraft in close proximity to conflict locations. In particular, conflicts with one or both flights within 20 minutes of their destination are shown to incur 5.7 times more delay to resolve than other conflicts and higher local flight densities are shown to increase average delay for resolutions. Finally, the resolution algorithm was found to be fully capable of handling all conflicts under the current-day traffic density used in the simulation.
W
I. Introduction
HEN aircraft are predicted to violate minimum safe separation distances, they are in conflict. A critical function of the air traffic management system is to detect conflicts and redirect aircraft to resolve conflicts before the separation minima are violated. In current operations, this is the responsibility of air traffic controllers who, given the limitations of today’s system, can only monitor and direct a maximum of around 20 flights at one time under the best conditions. To improve controller capacity and enable increased future traffic demands, new operational concepts and tools, utilizing planned improvements to communications, navigation and surveillance, are under development. A common element of these new concepts is to automate the process of predicting conflicts and generating aircraft flight plan modifications to resolve the conflicts, which is commonly referred to as Conflict Detection and Resolution. For efficiency, the development and testing of automated Conflict Detection and Resolution algorithms and procedures is primarily carried out using air traffic simulations for flights within a limited geographical region. This enables fast simulation turn around times, which facilitates rapid development. However, air traffic patterns can vary significantly by geographic region and there is a risk that the algorithms and procedures developed within one region may perform poorly in other regions. To address this risk, system-wide simulations can be used to supplement the targeted regional simulations. System-wide simulations can identify regions of interest that should be studied in regional simulations and, if the actual algorithms under development are used, test the algorithms under a broader range of conflict situations. This paper presents such a system-wide study with simulated flights over the continental United States. Previous studies have addressed system-wide variations in conflict characteristics1-3 and others4,5 have examined resolution performance in regional simulations. However, only one other study,6 which was done concurrently with this one, is known to have addressed resolution performance in a system-wide simulation. That study was focused on factors that affect the coordination of independent resolutions. It did not simulate a full day of flights and did not address the conflict and resolution metrics presented here. *
Aerospace Engineer, Systems Modeling and Optimization Branch, MS 210-15, and AIAA Associate Fellow. 1 American Institute of Aeronautics and Astronautics
This material is declared a work of the U.S. Government and is not subject to copyright protection in the United States.
The two goals of this study are 1) to identify regional variations and possible correlations for conflict related metrics; and 2) to explore how resolution performance varies due to conflict characteristics and the number of aircraft in close proximity to the conflict. The first goal addresses the need to assess Conflict Detection and Resolution algorithm performance under a broad range of conditions. The second goal is to examine metrics that might be used in the future to establish guidelines for regulating traffic demand for safe and efficient operation of automated separation assurance. This study attempts to address these goals by running a full-day, national simulation with en-route Conflict Detection and Resolution. The results are presented following sections on background information and the experimental setup. A discussion and recommendations for future research is presented at the end.
II. Background In the current national air traffic control system, the Federal Aviation Administration (FAA) divides the national airspace into regions called Air Route Traffic Control Centers, hereafter referred to as centers. The 20 centers for the continental U.S. are shown in Fig. 1. The FAA further divides the airspace into regions known as sectors, which are assigned to controllers who are responsible for Conflict Detection and Resolution (CD&R) within their sectors. To ensure that controller workload remains manageable, the number of flights allowed in a sector at one time is constrained to a predetermine maximum value (generally around 20 flights.) Upstream controllers and air traffic managers delay and/or maneuver flights in order to enforce these constraints. By introducing greater automation in the CD&R process it is hoped that sector capacity constraints can be significantly relaxed and that sectors can be made larger or even eliminated. The National Aeronautics and Space Administration is actively developing two candidate systems that perform automated CD&R. These are the Airborne Separation Assistance System7 and the Advanced Airspace Concept5,8-12 (AAC.) The first system is a distributed system where flights independently perform their own CD&R, whereas AAC is a centralized system that performs CD&R and then transmits resolution maneuvers to flights as necessary. Both systems are being developed using high-fidelity simulations that model regions the size of a single center or smaller. One of the simulation systems used in the development of AAC is the Airspace Concept Evaluation System13 (ACES,) the same simulation system used in the study presented in this paper. As part of its CD&R algorithm, AAC evaluates several potential resolution maneuvers until it finds one or more maneuvers that succeed. The successful
Figure 1. The 20 continental U.S. Air Route Traffic Control Centers. Center boundaries and names with FAA code designations in parentheses. 2 American Institute of Aeronautics and Astronautics
resolution that delays the flight the least, is chosen for implementation. If no successful resolution is found, the set of potential resolutions is repeatedly expanded until a successful one is found or a failure criterion is reached. AAC is currently being developed using high-fidelity simulations in a single center. An effort6 has recently begun to simulate multiple centers within ACES, each with an instantiation of AAC, but, at the time of the present study, the effort had yet to expand to a full-day, nation-wide simulation. Determining how well AAC performs in other centers may help identify areas where the algorithm needs improvement. Details on how the ACES simulation was set up to perform this study are described in the next section.
III. Experimental Setup AAC is still under active development. The version used in this study was from February 2009. The full range of AAC resolution maneuvers were enabled, which includes path stretches, climbs and descents, and speed changes. Combinations of these maneuvers are also allowed. One of the major areas of AAC development is in coordinating conflict resolutions with the merging and sequencing of arrival traffic at meter fixes.12 For this study, AAC arrival management was enabled, but the only arrival airports that were identified were in the Cleveland center. Performing arrival management in other centers would have been computationally prohibitive at the time of this study, but enabling it in Cleveland did allow its effects to be observed. For this study, ACES was run with the single-center version of AAC, but the 20 centers depicted in Fig. 1 were combined into a single center. This eliminates center boundary coordination issues, but does mean that AAC is operating over a much larger region than designed. The most obvious effect of doing this is that the simulation takes around two days to simulate one day’s traffic, as the calculations are not distributed across multiple processes, normally one to a center, to deal with traffic on a national scale. The simulation was run for a full day of traffic with a demand schedule and flight plans representing current day traffic. No traffic management functions other than CD&R were enabled, so traffic densities were allowed to exceed those in the actual system, which actively constrains the number of flights in a sector. A total of 39,673 flights were simulated, with departure times over a 24-hour period. The schedule of flights was based on air traffic data for September 26, 2006. Although existing center boundaries were not used in the simulation, they were used as the regions for the CD&R statistics. Conflicts were included in a center’s statistical population if the location of either flight in a conflict pair was in the center at the point of their predicted loss of separation or within the center at the time of conflict detection. This means that a few conflicts were included in the statistics of more than one center. The resolution delay statistic is defined as the excess flight time that a resolution maneuver takes from the start of the maneuver to the point at which it returns to the original flight plan. AAC does allow “direct to” resolution maneuvers, for which a flight can be sent directly to one of it’s future flight plan way points and result in significant flight time savings. There are also situations when a resolution maneuver resolves more than one conflict, resulting in one or more “bonus” resolutions. The “bonus” resolutions are also assigned a delay of zero for the statistical calculations.
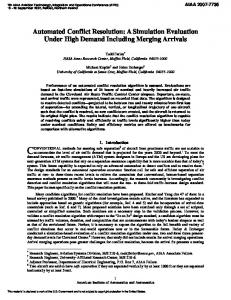
IV. Results The simulation resulted in a total of 14,628 conflicts. There were 14,617 successful resolutions and 11 failures. The failures were due to insufficient detection lead-times, that are an artifact of the simulation and not relevant to the analysis. There were 1586 conflicts cleared due to the resolution maneuvers of prior conflicts, these are referred as bonus resolutions. The horizontal locations of all 14,628 detected conflicts are presented in Fig. 2, along with center boundaries. As can be seen, there are localized regions of high conflict density, with a large region of high conflict density in the North East. Detailed results will be presented in three subsections. The first will compare the distribution of conflicts to prior work, the second will show how conflict metrics vary across the 20 centers, and the third will present NAS-wide relationships between resolution and conflict metrics. A. Comparison to Previous Work Table 1 presents the distribution of conflict properties from prior studies.1-3 Those studies, like this one, utilized flight plans from a particular day and then simulated trajectories based on the flight plans to generate conflicts. Unfortunately, none of the referenced simulations or the simulation performed for this study cover the same base traffic. The current study simulated a full day in the NAS for traffic on September 26, 2006. The study in Ref. 1 was a NAS simulation based on 24 hours of traffic in March 2001, Ref. 2 simulated a full day of traffic over Europe for June 13, 2003, and Ref. 3 was a NAS simulation based on 6 hours of traffic on April 3, 2008. Because the data from
3 American Institute of Aeronautics and Astronautics
Figure 2. Conflict locations over the continental U.S. For each conflict pair, circles are displayed at the locations where each conflicting aircraft is predicted to first violate minimum separation. the three references were compiled for conflicts occurring above 18,000 ft, the results presented in this section were filtered to only include flights in the same range. The first block of the table shows the distribution of conflicts according to the vertical phase of flight of each flight of a conflict pair at the time of the first loss of separation. For Level/Level, both flights are in cruise. For Level/Non-level, one flight is in cruise and one is either climbing or descending. For Non-level/ Non-level, neither Table 1. Comparison of Conflict Properties with Previous Work Conflict Property Ref. 1 Ref. 2 Ref. 3 This Paper Vertical Phase Level/Level 75% 18% 33% 30% Level/Non-level 20% 51% 43% 57% Non-level/Non-level 8% 31% 24% 13% Encounter Angle In-Trail (0-60°) 53% 43% 58% Cross-Trail (60-120°) 19% 27% 15% Opposite (120-180°) 28% 30% 28% Encounter Angle In-Trail (0-15°) 34% 18% 37% Cross-Trail (15-165°) 50% 72% 51% Opposite (165-180°) 16% 10% 12% flight is in cruise. The results show that there is little similarity between any two of the three prior studies. The results for this paper compare best with the Ref. 3, in terms of the relative proportions of the three categories, but values are not very comparable except for Level/Level. In addition to differences in the traffic modeled, the discrepancies may also be due to differences in how and when climbs and descents were simulated. The second and third blocks of the table presents the results for encounter angles between the conflicting aircraft, the second block is for the encounter angle definitions used in Ref. 1 and the third is for the definitions used in Ref.
4 American Institute of Aeronautics and Astronautics
2. The distributions for this paper seems to match both the Ref. 1 and Ref. 2 distributions very closely in their respective encounter angle categories, but does not match the Ref. 3 distributions in either encounter angle category. Figure 3 presents the percentage distribution of conflicts occurring above 18,000 ft for the 20 centers compared to data from Ref. 3. The distributions are largely similar, with some notable exceptions. The Atlanta center (ZTL) in Ref. 3 has double the percentage of conflicts for this paper’s simulation and the half percentages for Los Angeles (ZLA) and New York (ZNY.) These differences may be due to the use of different source days or because Ref. 3
Figure 3. The percentage of all conflicts above 18,000 ft that reside in each center. The left-hand bar for each ARTCC is the percentage for this paper, the right-hand is the percentage reported in Ref. 3. only used data from a partial day. Differences in simulation details might also have an effect. B. Variation of Conflict and Resolution Metrics by Center Four categories of conflict metrics are presented; these are the number of conflicts in each center, the vertical phase of flight, encounter angle, and en-route/arrival flight phase. In this section, the vertical phase of flight categories are level/level, level/non-level, and non-level/non-level. Encounter angles are divided into in-trail, crosstrail, and opposite, which are defined as encounter angle ranges of 0-15°, 15-165°, and 165-180° respectively. The en-route/arrival flight phase was defined as follows: if either conflicting aircraft is within 20 minutes of its final destination meter fix at the time of the first loss of separation, then the conflict is considered an arrival conflict, otherwise it is classified as an en-route conflict. Three categories of resolution metrics are also presented; these are resolution delay, the number of trial plans considered, and the percentages of all trial plans considered that successfully resolve the conflict. These metrics were chosen as potential indicators of how difficult a conflict is to resolve. Resolution delay is defined as the difference in seconds, between the flight time of the maneuvered aircraft and what its original flight time would be if it was not maneuvered. Resolution delay can be negative if a flight is sped up as part of the resolution or if the resolution maneuver is a “direct-to,” which enables it to shorten its flight path. The number of trial plans considered and the percentage of successful trial plans are self-explanatory. Bonus resolutions, which are conflicts resolved by prior resolutions, are assigned a resolution delay of zero, zero as the number of trial plans, and 100% as the percentage of successful trial plans. Figure 4 presents the distribution of conflict counts across all twenty centers. The Results are different from those presented in Fig. 3, because these include conflicts at all flight levels above 10,000 ft. Figure 4 shows that 5 centers account for nearly half of all of the conflicts. These are: Washington D.C. (ZDC), Los Angeles (ZLA), New York (ZNY), Chicago (ZAU) and Atlanta (ZTL) in order of descending conflict count. Figure 5 shows percentage distribution of en-route and arrival conflicts in the NAS and in each center. NASwide, arrival conflicts outnumber en-route conflicts, but there are a few centers where the majority of conflicts are en-route. Kansas City (ZKC) and Memphis (ZME) centers standout by having more than twice the number of enroute conflicts as arrival conflicts. The distribution of conflicts by encounter angle is presented in Fig. 6. Opposite encounter angles are in the minority NAS-wide and in each center. NAS-wide there are slightly more cross-trail conflicts than in-trail conflicts, but there are a few centers where in-trail conflicts are dominant. 5 American Institute of Aeronautics and Astronautics
Figure 4. Distribution of conflicts by center.
Figure 5. Percentage distribution of conflicts by en-route/arrival flight phase and center. Horizontal lines depict NAS-wide values.
Figure 6. Percentage distribution of conflicts by encounter angle and center. Horizontal lines depict NAS-wide values.
6 American Institute of Aeronautics and Astronautics
Figure 7 presents the distribution of conflicts by vertical phase. Level/Non-Level is the dominant phase NASwide and in every center except Kansas City (ZKC), where Level/Level is the dominant vertical phase. This is probably due to the fact that Kansas City has the highest percentage of en-route conflicts of all the centers, as shown in Fig.5. There are slightly more Level/Level conflicts than Non-Level/Non-Level conflicts NAS-wide, but there are several centers where this ranking is reversed.
Figure 7. Percentage distribution of conflicts by vertical phase and center. Horizontal lines depict NAS-wide values. Figures 8-11 show the distribution of resolution metrics NAS-wide and for each center. Figure 8 shows the distribution of resolution delay. When compared to the en-route/arrival distributions in Fig. 5, there seems to be some correlation between higher percentages of arrival conflicts and higher mean resolution delay. The reason for this is clearly seen in Fig. 9, where the mean resolution delay for arrival conflicts is much higher than for en-route conflicts. The mean number of trial plans per resolution for en-route and arrival conflicts is presented in Fig. 10. NAS-wide and for most centers, arrival conflicts tend to require more trial plans. A notable exception is Cleveland (ZOB), where AAC’s arrival planning was enabled for several of its airports. The percentage of successful trial plans is for en-route and arrival conflicts is shown in Fig. 11. There tends to be a slightly higher percentage success for arrival conflicts NAS-wide and for most centers, but Cleveland (ZOB) is again an exception, most likely due to the use of specialized arrival planning logic in that center.
Figure 8. Mean resolution delay for the NAS and each center. The horizontal line depicts the mean NAS-wide delay.
7 American Institute of Aeronautics and Astronautics
Figure 9. Mean resolution delay by en-route/arrival flight phase for the NAS and each center. Horizontal lines depict NAS-wide values.
Figure 10. Mean number of trial plans by en-route/arrival flight phase for the NAS and each center. Horizontal lines depict NAS-wide values.
Figure 11. Mean percentage of trial plan success by en-route/arrival flight phase for the NAS and each center. Horizontal lines depict NAS-wide values.
8 American Institute of Aeronautics and Astronautics
C. Relationships Between Conflict and Resolution Metrics Figures 12-15 present resolution delay as a function of the number of trial plans, the percentage of successful trial plans, the time from detection to the first loss of separation, and the number of flights within 25 nmi and 4000 ft of either conflicting flight at the time of the first loss of separation. The first characteristic to note in all of the figures is the large amount of scatter in the resolution delay values. Considering Figs. 12 and 13, even when there is a low percentage of successful trial plans or when the algorithm needs to evaluate a large number of trial plans, resolutions can be found with low or even negative delay. There seems to be a trend of higher delay with an increasing number of trial plans or decreasing percentages of successful trial plans, but more analysis and probably more simulations would be needed to confidently quantify these trends. Including trajectory prediction uncertainty should also significantly affect the results. Figure 14 seems to display slightly higher average delays with less than 200 seconds to first loss, but again it is difficult to quantify. The same difficultly in identifying trends is evident in Fig. 15, which shows resolution delay as a function of the number of flights in the proximity of the conflict.
Figure 12.
Resolution delay as a function of the number of trial plans.
Figure 13.
Resolution delay as a function of the number of the percentage of successful trial plans.
9 American Institute of Aeronautics and Astronautics
Figure 14.
Resolution delay as a function of the time to first loss of separation.
Figure 15. Resolution delay as a function of the number of number of other flights within 25 nmi and 4000ft. Flights were counted if they would be within 25 nmi and 4000 ft of either conflicting flight at the time of the first loss of separation. In an effort to extract meaningful, quantitative trends for resolution metrics as a function of selected conflict metrics, the mean values of the resolution metrics were determined along uncertainties represented by 95% confidence intervals. The 95% confidence interval is estimated to be ±2 σ N , where σ is the standard deviation and N is the number of conflicts. Mean resolution delay as a function of four proximity metrics is presented in Fig. 17. Mean resolution delay unambiguously increases as the number of proximate flights increase for the 10 nmi/2000 ft range. The other three ranges, show mean delay increasing initially, but the trend breaks down as the uncertainty rapidly increases at the higher flight counts. In order € to firmly establish that the trend holds, more simulations and simulations with higher flight densities would need to be run. Figures 18 and 19 show the trends for the mean number of trial plans and mean percentage of trial plan success as flight density increases. As would be expected, they indicate that the mean number of trial plans required increases with increasing flight density and that the mean percentage of trial plan success decreases with increasing flight density. Again, the trends seem to break down at higher flight counts due large uncertainties in the mean values.
10 American Institute of Aeronautics and Astronautics
Figure 17. Mean resolution delay vs. number of flights within proximity regions of conflicting aircraft. Mean values with uncertainty ranges (95% confidence.)
Figure 18. Mean number of trial plans vs. number of flights within proximity regions of conflicting aircraft. Mean values with uncertainty ranges (95% confidence.)
The means for resolution delay, trial plan success and the number of trial plans are presented as functions of vertical phase of flight, encounter angle and enroute/arrival phase in Table 2. The mean values are presented with their uncertainties based on 95% confidence limits. For this table, vertical phase of flight for each aircraft is identified as being in cruise, climb or descent. Climb/descent has the highest mean resolution delay, followed by cruise/descent and descent/descent. cruise/cruise, cruise/climb and climb/climb have the lowest delays, although there is significant uncertainty in the climb/climb value due to the low numbers (2.4%) of those conflicts in the simulation. Overall, it seems that conflicts with descending flights tend to yield conflict resolutions with higher delays. There are no clear trends in the percentage of trial plan success, although climb/climb conflicts seem to have a very low success rate. For mean number of trial plans required, cruise/climb has the least at 6.5, followed by Figure 19. Mean percentage of trial plan success vs. number of flights within proximity regions of cruise/cruise with 7.7. The second block of Table 2 shows variations with conflicting aircraft. Mean values with uncertainty encounter angle. Conflicts with opposite encounter ranges (95% confidence.) angles have significantly lower mean delays, the highest mean percentage of trial plan success, and the lowest mean number of trial plans required. In-trail conflicts have the lowest mean percentage of trial plan success and the highest mean number of trial plans required. En-route/arrival flight phase results are presented in the third block. En-route conflicts are shown to have 1/5 the mean resolution delay of arrival conflicts. They also require fewer trial plans on average, but they, counter intuitively, have a lower mean trial plan success.
11 American Institute of Aeronautics and Astronautics
Table 2. Resolution metrics for all conflicts by vertical phase, encounter angle and en-route/arrival phase. Metric
Categories
Percent
of
Conflicts
Resolution
delay
(sec)
Mean
Trial
Plan
Success
(%)
Std.
Dev.
Mean
Number
of
Trial
Plans
Std.
Dev.
Mean
Std.
Dev.
Vertical
Phase
Cruise/Cruise
25.2
13.9±2.0
60.7
50.5±1.0
31.1
7.7±0.3
7.6
Cruise/Climb
Cruise/Descent
17.9
13.9±2.3
37.9
28.7±1.7
60.0
65.1
48.3±1.1
46.4±0.9
27.5
32.4
6.5±0.2
9.4±0.2
6.0
7.4
Climb/Climb
2.4
13.9±10.0
93.5
42.1±3.3
31.1
9.2±0.9
8.8
Climb/Descent
Descent/Descent
9.1
37.7±4.6
7.5
27.7±4.0
84.1
66.5
51.0±1.7
53.3±2.0
31.5
33.8
8.5±0.4
9.5±0.5
7.7
8.7
Encounter
Angle
InTrail
(015°)
40.2
24.3±1.7
63.6
41.3±0.8
31.2
10.2±0.2
8.2
CrossTrail
(15165°)
52.2
23.5±1.6
69.0
53.0±0.7
30.9
7.2±0.2
6.8
Opposite
(165180°)
7.6
8.5±3.8
62.8
57.0±1.6
27.2
5.3±0.3
4.7
En-route/Arrival Flight
Phase
Enroute
38.7
5.8±1.3
49.8
44.8±0.7
27.8
7.3±0.2
6.8
Arrival
61.3
33.4±1.5
73.3
51.0±0.7
33.1
9.1±0.2
7.8
V. Discussion The main goals of this study were to perform an initial nationwide evaluation of the Advanced Airspace Concept, to gain an understanding of how conflict characteristics vary across the National Airspace System, and to explore the relationships between conflict and resolution metrics for the resolution algorithm. The principle conflict metrics studied were vertical phase-of-flight, encounter angle, en-route/arrival phase, and local flight density. Since this was a preliminary study that did not include the effects of trajectory prediction uncertainty, prediction accuracy was not a factor. Three resolution metrics were chosen to represent the relative difficulty of resolving conflicts. These were resolution delay, number of trial plans and the percentage of successful trial plans. The Advanced Airspace Concept was able to resolve all conflicts except for a handful where, due to simulation limitations, it was not given enough lead-time to provide a successful resolution. It was evident that the algorithm was not stressed under this simulation, which used current-day traffic densities and had no trajectory prediction uncertainty. Future studies will need to incorporate greater flight demand and include uncertainties. The type and number of conflicts vary considerably regionally, as was expected and was shown in Ref. 3. However, the differences between the current and previous studies are an indication that single day studies are probably insufficient to accurately characterize regional differences. The need for more data is especially evident when examining the resolution performance metrics. The magnitude of the variance in these metrics is much larger than the trend magnitudes due to conflict type or the number of proximal aircraft. To accurately quantify these trends, significantly more simulation data is needed. The large variance in metrics is likely to be due resolutions being extremely sensitive to small variations. A turn of 10° may not resolve a conflict, but a turn of 10.1° might. It is quite possible that a conflict in a densely populated region may have a very efficient and easy to find resolution, whereas a conflict in a less populated region may have a more elusive resolution. The occurrence of these, somewhat counter-intuitive resolution outcomes, leads to the large variance in the conflict metrics and the difficultly in quantifying trends. However, some trends do emerge. Arrival conflicts have much larger mean delays than en-route conflicts, yet they seem to require fewer trial plans and have a higher percentage of trail plan success. One consequence of this is
12 American Institute of Aeronautics and Astronautics
that centers with high percentages of arrival conflicts have higher mean resolution delay. The results also indicate that having one or both flights descending, leads to higher delays. The identification and quantification of such trends will be needed in order to develop guidelines for regulating traffic into regions with automated separation assurance. To do this, the scope and fidelity of the simulations will need to be expanded. In terms of scope, the range of scenarios should be increased to include higher traffic densities and a greater range of potential traffic patterns. In terms of fidelity, uncertainties in the detection and prediction of aircraft positions need to be included.
VI. References 1
Bilimoria, K.D. and Lee, H.Q., Oaks, R.,“Properties of Air Traffic Conflicts for Free and Structured Routing,” Proceedings of the American Institute of Aeronautics and Astronautics (AIAA) Guidance, Navigation, and Control Conference, August 6-9, 2001. 2 Ehrmanntraut, R., Christien, R., Novation, P., “Analysis of Aircraft Conflict Geometries in Europe,” AIAA/IEEE Digital Avionics Systems Conference, October 2004. 3 Paglione, M., Santiago, C., and Crowell, A., “Analysis of the Aircraft to Aircraft Conflict Properties in the National Airspace System,” Proceedings of the American Institute of Aeronautics and Astronautics (AIAA) Guidance, Navigation, and Control Conference, Honolulu, Hawaii, Aug. 18-21, 2008. 4 Kupfer, M., Farley, T., Chu, Y-C. and, Erzberger, H., “Automated Conflict Resolution - A Simulation-Based Sensitivity Study of Airspace and Demand,” International Council for the Aeronautical Sciences (ICAS) 2008 Congress, Anchorage, Alaska, 14-19 Sep. 2008. 5 McNally, D., and Thipphavong, D., “Automated Separation Assurance in the Presence of Uncertainty,” 26th International Congress of the Aeronautical Sciences, September 2008, Anchorage, Alaska. 6 Lauderdale, T., “The Effects of Passive Coordination on Distributed Separation Assurance,” Proceedings of the AIAA Modeling, Simulation and Technology Conference, Hilton Head, South Carolina, Sept. 21-23, 2009. 7 Wing, D., “A Potentially Useful Role for Airborne Separation in 4D-Trajectory ATM Operations,” AIAA's 5th Annual Aviation Technology, Integration, and Operations Forum, Arlington, Virginia, Sep. 26-28, 2005. 8 Erzberger, H., “Transforming the NAS: The Next Generation Air Traffic Control System,” NASA/TP-2004-212828, Oct. 2004. 9 Erzberger, H., “Automated Conflict Resolution for Air Traffic Control,” 25th International Congress of the Aeronautical Sciences (ICAS), Hamburg, Germany, 3-8 Sep. 2006. 10 Farley, Todd; Erzberger, Heinz, “Fast Time Air Traffic Simulation of a Conflict Resolution Algorithm under High Air Traffic Demand.” USA Europe ATM Seminar, paper # 173, July 2-5, 2007, Barcelona, Spain. 11 Erzberger, Heinz, “Algorithm and Operational Concept for Resolving Short Range Conflicts,” 26th International Congress of the Aeronautical Sciences, September 2008, Anchorage, Alaska. 12 Erzberger, Heinz, “Separation Assurance in the Future Air Traffic System,” ENRI International Workshop on ATM/CNS (EIWAC), March 2009, Tokyo, Japan. 13 Meyn, L., Windhorst, R., Roth, K., et. al., “Build 4 of the Airspace Concept Evaluation System,” Proceedings of the AIAA Modeling, Simulation and Technology Conference, Keystone, Colorado, Aug. 21-24, 2006.
13 American Institute of Aeronautics and Astronautics