Black pixels represent latencies greater than 40 ms or the ... (e) Average laser light-induced IOS response from normalized data (each animal scaled from -.
nature | methods Automated light-based mapping of motor cortex by photoactivation of channelrhodopsin-2 transgenic mice Oliver G S Ayling, Thomas C Harrison, Jamie D Boyd, Alexander Goroshkov & Timothy H Murphy
Supplementary figures and text:
Supplementary Figure 1
ChR2-negative animals show no response to photostimulation.
Supplementary Figure 2
ChR2 is expressed throughout the sensorimotor cortex in layer 5 cells.
Supplementary Figure 3
Response latency is inversely related to EMG amplitude.
Supplementary Figure 4
Glutamate receptor antagonist effect on light-evoked EMG and EEG activity.
Supplementary Figure 5
Estimates of CHR2 and ICMS electrode based cortical activation spread using IOS imaging.
Supplementary Figure 6
Focal and repeated photostimulation of motor cortex does not lead to degradation of motor map.
Supplementary Figure 7
Motor maps can be evoked weeks apart within the same animals.
Supplementary Figure 8
Stimulation-evoked movements detected by EMG and laser motion sensor.
Supplementary Table 1
Coordinates of the center point of cortical motor representations relative to bregma, as defined by two-dimensional Gaussian fitting.
Supplementary Table 2
Overlap of sensory and motor representations for forelimb and hindlimb (n = 3 mice).
Supplementary Methods
Nature Methods: doi:10.1038/nmeth.1303
Supplementary Figure 1 ChR2-negative animals show no response to photostimulation.
a
b
CHR2 -/-
c
d
140e-6 (mV.s)
electrode artifact 0
(a) Stimulation was delivered to an array of points (red crosses), and cortical activity was recorded by an EEG electrode (at right). (b) Each pixel represents the response evoked when the laser stimulated that cortical location, with lighter colors signifying a larger response. Scale bars in a and b 1 mm. (c) Raw EEG traces. Scale bars 3 mV, 200 ms. (d) selected traces enlarged from c. Note the large stimulation artifact produced when the laser strikes the recording electrode (bottom trace), which has amplitude and time kinetics dissimilar to genuine EEG responses. Scale bars 1 mV, 200 ms.
Nature Methods: doi:10.1038/nmeth.1303
Supplementary Figure 2 ChR2 is expressed throughout the sensory-motor cortex in layer 5 cells.
Nature Methods: doi:10.1038/nmeth.1303
Supplementary Figure 2 ChR2 is expressed throughout the sensory-motor cortex in layer 5 cells. Expression of YFP (a,b) and ChR2-YFP fusion protein (c-f) in fixed coronal sections of mouse cortex. Expression was under control of the Thy1 promoter in both cases. (a) Low magnification wide-field fluorescence micrograph of a YFP-H mouse cortex. Medial is to the right and dorsal is to the top. Borders between primary motor cortex (m1), secondary motor cortex (m2), and primary somatosensory cortex (s1) are marked with arrows. Scale bar equals 500 µm, and also applies to c. (b) Higher magnification view of the border between m1 and m2. Apical dendrites of YFP-expressing neurons in layer 5 can be seen ascending to layer 1. Scale bar 250 µm. (c) Low power wide-field fluorescence micrograph from a mouse expressing the ChR2-YFP fusion protein. The areal and laminar expression pattern is similar to that shown in a for YFP expression in YFP-H line mice. (d,e) Maximum intensity projections over 20 µm from coronal slices of 2 mice expressing ChR2YFP. Apical dendrites of layer 5 pyramidal neurons expressing ChR2-YFP extend into layer 1. No pyramidal neurons expressing YFP-ChR2 are seen in layer 2/3. Arrow in (d) shows an axon entering the white matter (wm). Scale bar in e equals 200 µm and applies to f. (f) Higher magnification maximum intensity projection of 3 µm through layer 5 from the same coronal slice illustrated in d. Examples of individual neurons expressing ChR2-YFP are indicated with arrows. Scale bar 100 µm. (g-j) Coronal sections (100 µm thick), anterior to posterior, of mice expressing ChR2-YFP, scale bar 1mm.
Nature Methods: doi:10.1038/nmeth.1303
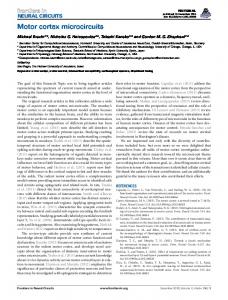
Supplementary Figure 3. Response latency is inversely related to EMG amplitude.
a
b
mFL
latency
ms
(a) High resolution forelimb motor map. White pixels are maximum EMG response, black is no response. Scale bar 1 mm. (b) Corresponding EMG latency map. Pixel values represent latency of EMG response from stimulus onset. Black pixels represent latencies greater than 40 ms or the absence of any response, white pixels represent latencies of less than 10 ms. Scale bar 1 mm.
Nature Methods: doi:10.1038/nmeth.1303
Supplementary Figure 4. Cortical application of glutamate receptor antagonists have little initial effect on light-evoked EMG and EEG activity.
a Pre-antag. mapping
Anatag. incubation Post-antagonist begins (30min) mapping 30-90 min
b
c
d 250
150 100
e
Amplitude (norm to pre-values)
Pre
75 min
50 min
X10-6 (mV.s)
200
50 0
1.2 EMG EEG
1.0
f
0.8 0.6 0.4 0.2 0.0
75 min (x2.5) 30-60
61-90
Time post drug application (min) (a) Experimental timeline for antagonist experiments (MK-801 0.3 mM and CNQX 4.5 mM, applied directly to the intact cortical surface, dura intact). (b) Forelimb motor map before antagonist application. Scale bar, 1 mm. (c) Forelimb motor map 50 min after initial antagonist application. (d) Forelimb motor map 75 min after initial antagonist application. Motor map amplitude, indicated by the gray scale with scale bar expressed in mV.s on a linear scale. (e) EMG (black bars) and EEG (red bars) amplitudes normalized to pre-antagonist values (error bars SEM, n = 4 animals). Group data indicates that cortical EEG responses and light-evoked muscle potentials are relatively resistant to blockade of excitatory transmission in the cortex consistent with EMG maps reflecting direct activation of cortical spinal neurons and not indirect intracortical circuits. (f) Motor map in d with Nature Methods: doi:10.1038/nmeth.1303 scale increased 2.5 times to highlight area of map rather than EMG amplitude.
Supplementary Figure 5. Estimates of CHR2 and ICMS electrode based cortical activation spread using IOS imaging.
a
c
0.2, 0.02%
ICMS electrode IOS
d 630 nm reflect % change
b
Laser CHR2 IOS activation
-0.3, -0.03%
500 µm
e
0.05
ICMS
0.00 -0.05 -0.10
Laser norm
-0.15 -0.20 -1200
-600 0 600 distance (µm)
f
1200
0
-1.0
Laser n=4 animals Nature Methods: doi:10.1038/nmeth.1303
Elect. n=3 animals
500 µm
Supplementary Figure 5. Estimates of CHR2 and ICMS electrode based cortical activation spread using IOS imaging. (a) Image of brain surface with the location of blue laser light stimulation marked by a blue dot. A 100 ms train of 10, 5 ms laser pulses given at 100 Hz was used for optical stimulation. Intracortical microstimulation was performed in approximately the same area using a glass-stimulating electrode (see Supplementary Methods). (b) Image showing change in reflected light signal 200 ms after the onset of a train of blue light pulses. A small reduction in reflected light is observed consistent with local brain activation. The scale for panel B is between -0.03 to +0.02 %; data is the average of 140 trials. (c) Change in reflected light signal in response to ICMS train stimulation, the average of 60 trials is shown. (d) Plot of change in IOS reflectance measured using a horizontal rectangle 180 µm in height placed across the centre of activation for both channelrhodopsin activation and ICMS. The data plotted is from panels b and c. No light activated changes in brain reflectance were observed in 2 wild type animals examined, or in animals killed by anesthetic overdose. (e) Average laser light-induced IOS response from normalized data (each animal scaled from 1.0 to 0) from n=4 animals using the parameters described above. Contour lines indicate 50, 75, and 90 % of the peak response in this panel and f. (f) Average (ICMS) stimulating electrode induced IOS response from normalized data (each animal scaled from -1.0 to 0) from n = 3 animals using the parameters described above.
Nature Methods: doi:10.1038/nmeth.1303
Supplementary Figure 6 Focal and repeated photostimulation of motor cortex does not lead to degradation of motor map.
a
b
c 0.0006 EMG Amplitude (mV.s)
0.0005
0.0003 0.0002 0.0001 0.0000
1mm
d
0.0004
e
1- 24
39 - 6 3 76-1 0 0 Stimulus Repetitions
f
ms
1st rep
(25ms/2mV)
50th rep
90th rep
(a) Image of cortex with region of focal and repeated stimulation displayed in red box. 103 repetitions of a 6 × 6 pattern of photostimulation (300 µm spacing between points) was delivered to the same region of cortex prior to motor mapping (up to 294 mWmm-1 and 50 ms). (b) Forelimb motor map created after focal and repeated photostimulation. There is a robust response in area corresponding to the position of focal stimulation after 100 repetitions (red box). Scale bars, 1 mm. (c) Plot of EMG amplitude over multiple repetitions of photostimulation. EMG amplitudes are taken as the average of multiple repetitions from the area corresponding to the red box in a and b (error bars are SEM). (d-f) Raw EMG traces corresponding to red box in a and b taken from the 1st, 50th, and 90th repetition of focal photostimulation. Scale bar 25 ms, 2 mV.
Nature Methods: doi:10.1038/nmeth.1303
Supplementary Figure 7. Motor maps can be evoked weeks apart within the same animals.
a
d
Bregma
Bregma
b
e
Max
41 post-surgery days
15 post-surgery days
c
f
25 post-surgery days Nature Methods: doi:10.1038/nmeth.1303
48 post-surgery days
0
Supplementary Figure 7. Motor maps can be evoked weeks apart within the same animals. Preliminary maps of forelimb movements evoked by ChR2 activation within sensory-motor cortex from two separate animals implanted with chronic cranial windows are shown (measurements made with a laser-based motion sensor). The animal in (a) has been mapped two times (b,c), with one week between mapping sessions. The animal shown in panel (d) has been mapped three times, the second (e) and third (f) maps are shown here. The map centers (defined by 2-D Gaussian fit) are marked on each map and at the corresponding cortical location (in the top panel). The boundaries of the cranial windows are outlined in red. For all maps, black pixels represent cortical locations from which no movements were evoked, and white pixels represent the location of maximal response. Maps b and c are on the same scale, with black representing no evoked movement and white representing a limb displacement of 2.2 mm. Map e is similarly scaled from 0-4.6 mm, and f is scaled from 00.43 mm. Scale bar 1mm. Note that limb displacement is strongly dependent on anesthetic state and is highly variable.
Nature Methods: doi:10.1038/nmeth.1303
Supplementary Figure 8. Stimulation-evoked movements detected by EMG and laser motion sensor.
a
b
Max
mFL 0
c
EMG
d
Movement
(a) EMG-based motor map of the extensor carpi radialis muscle. Pixel values signify EMG amplitude, with white corresponding to peak response and black to the absence of any response. (b) Forelimb movement map from the same animal obtained using a laser motion sensor. Pixel values correspond to the displacement of the forelimb, with values ranging from 15 mm (white pixels) to no movement. Scale bars 1 mm. (c) EMG trace corresponding to pixel circled in a. Scale bars 100 mV, 100 ms. (d) Laser motion sensor trace corresponding to pixel circled in b. Scale bar 0.5 mm, 100 ms.
Nature Methods: doi:10.1038/nmeth.1303
Supplementary Table 1. Coordinates of the center point of cortical motor representations relative to bregma, as defined by two-dimensional Gaussian fitting. n=8 animals, with 3-6 maps per animal. Note, both HL and FL muscles were not always assayed within the same animals and inter-animal variability can account for some variability in map centers. Muscle
Lateral from Bregma (mm)
Posterior from Bregma (mm)
Extensor carpi radialis brevis (FL extensor) Triceps brachii (FL extensor) Biceps femoris (HL flexor) Vastus lateralis (HL extensor)
1.84+/- 0.37 1.96 +/-0.29 1.47 +/- 0.32 1.60 +/- 0.25
0.42 +/- 0.97 0.15 +/- 0.66 0.55 +/- 1.04 -0.33 +/- 0.97
Supplementary Table 2. Overlapping sensory and motor representations of forelimb and hindlimb (n=3 mice). Muscle
% Motor map in sensory territory.
% Motor map in FL sensory territory
% Motor map in HL sensory territory
Extensor carpi radialis brevis (FL extensor) Triceps brachii (FL extensor) Biceps femoris (HL flexor) Vastus lateralis (HL extensor)
51 ±15
24 ±8
27 ±8
51 ±12 55 ±14 50 ±12
22 ±10 0 ±0 3 ±5
29 ±4 55 ±14 47 ±11
Results of one-way ANOVA F(7, 16) = 14.668, p < 0.0001, Bonferroni post-hoc test Comparison Mean Difference P value Biceps femoris FL sensory overlap vs. Biceps -55.39 P