doi:10.1038/nature06496
ARTICLES Predicting expression patterns from regulatory sequence in Drosophila segmentation Eran Segal1*, Tali Raveh-Sadka1*, Mark Schroeder2, Ulrich Unnerstall2 & Ulrike Gaul2 The establishment of complex expression patterns at precise times and locations is key to metazoan development, yet a mechanistic understanding of the underlying transcription control networks is still missing. Here we describe a novel thermodynamic model that computes expression patterns as a function of cis-regulatory sequence and of the binding-site preferences and expression of participating transcription factors. We apply this model to the segmentation gene network of Drosophila melanogaster and find that it predicts expression patterns of cis-regulatory modules with remarkable accuracy, demonstrating that positional information is encoded in the regulatory sequence and input factor distribution. Our analysis reveals that both strong and weaker binding sites contribute, leading to high occupancy of the module DNA, and conferring robustness against mutation; short-range homotypic clustering of weaker sites facilitates cooperative binding, which is necessary to sharpen the patterns. Our computational framework is generally applicable to most protein–DNA interaction systems. Precise spatio-temporal control of gene expression lies at the heart of metazoan development. The necessary instructions are encoded in cisregulatory elements, or modules, which typically contain multiple binding sites for multiple transcription factors1. When bound, transcription factors promote or inhibit expression of the neighbouring gene, with the net expression outcome determined by how all factor effects integrate. The binding of factors depends on their affinity to the binding sites, but also on their expression levels; because these vary spatially and temporally, the constellation of bound factors on the module sequence and the resulting expression level will vary accordingly. Thus, understanding the rules by which modules ‘compute’ expression from the input factor expression is key to understanding transcriptional processes in general and pattern formation in particular. Genetic, molecular and biochemical studies, more recently complemented by ChIP-chip2 and by computational approaches exploiting site clustering3–5, conservation6 or co-regulation detected by DNA microarrays7, have collectively identified many of the genes, modules and binding sites involved in key developmental processes. To unravel the logic by which these components interact, various types of logical8, probabilistic7,9, thermodynamic10–12, and reaction–diffusion models13–15 have been constructed, providing interesting insights. However, these methods do not explicitly model transcription factor binding to regulatory sequence, or do so on a limited scale10,12,16. Thus, a quantitative mechanistic description of the transcriptional control events that lie at the core of developmental pattern formation is still missing. Here we present a new computational framework that models the entire process of transcriptional regulation, from the expression of the input factors to their binding to cis-regulatory sequence and the module expression patterns resulting from these binding events. The model is based on physical properties and takes into account binding competition between factors, cooperative binding interactions, and contributions from weak binding sites. We apply our framework to the well-characterized segmentation gene network of the early
Drosophila embryo, which consists of a four-tiered hierarchy of maternal and zygotic factors that define the antero-posterior body axis in a stepwise refinement of expression patterns17–20. The maternal factors form gradients spanning the entire antero-posterior axis; they are translated into broad, non-periodic domains of zygotic gap gene expression and subsequently into periodic patterns of seven ‘pair rule’ and finally fourteen segmental stripes that prefigure the fourteen segments of the larva. Regulation within this network is highly combinatorial and, in the top tiers, almost entirely transcriptional. Thermodynamic model of transcription control Our model takes as input expression levels and DNA-binding specificities for a set of transcription factors, and predicts the expression level that any arbitrary DNA sequence will give rise to when receiving input from these factors (Fig. 1). The model has two main components: one that computes the occupancy distribution of factors on a given target DNA sequence, and another that translates this occupancy distribution into a level of expression. To account for differing input factor concentrations, these computations are performed separately for every position along the spatio-temporal axis of interest, here the antero-posterior axis. In the first model component, we consider all possible configurations of factor molecules on the sequence; by not allowing overlap between two molecules in any one configuration, we model the competition between factors that results from their steric hindrance constraints (Fig. 1, and Supplementary Fig. 1). The probability of a configuration is computed from the local concentration of the participating factors and the strength of the binding sites they occupy in the configuration, as measured by the position specific scoring matrix (PSSM) score21. We do not use predetermined thresholds for defining factor-binding sites, allowing both weak and strong factor binding to contribute, and we model self-cooperativity between two factor molecules bound to neighbouring sites, assuming that this effect decays with the distance between the sites. The second model
1 Department of Computer Science and Applied Mathematics, Weizmann Institute of Science, Rehovot 76100, Israel. 2Laboratory of Developmental Neurogenetics, Rockefeller University, New York, New York 10065, USA. *These authors contributed equally to this work.
1 ©2007 Nature Publishing Group
ARTICLES
NATURE
component translates each configuration into its resulting expression level. We assume that each bound factor molecule contributes independently to the expression outcome, with activator molecules contributing positively and repressor molecules contributing negatively. We use the logistic function to translate these contributions into expression because it has the desired saturation properties whereby maximal or minimal transcription is achieved beyond a certain number of bound activator and repressor molecules, respectively. The final expression outcome of a sequence is then the sum of the expression contributions of each configuration, weighted by their probability (see Supplementary Information). The model has three free parameters for each transcription factor, representing values that are typically unknown: (1) the absolute concentration of the factor in vivo; (2) the transcription rate resulting from its interactions with the basal machinery; and (3) the strength of binding cooperativity for the factor. In addition, we parameterize the PSSMs representing the factors’ binding preferences because they are typically based on a limited number of footprinted binding sites, but we constrain PSSM learning to maintain the measured consensus (see Methods). We devised a learning algorithm that fits the model parameters to minimize the error between the measured and modelpredicted expression for a set of input modules. This model-fitting task is complex because it requires traversing the uncomputably large number of possible factor configurations on the sequence, and calculating the expression contribution of each such configuration. To approximate this computation, we devised a sampling-based algorithm, guaranteed to converge to the correct computation as the number of samples increases.
patterns and the output module expression patterns are mature (mid-blastoderm; approximately 20 min into cell cycle 14). The expression patterns predicted by a model trained on these data exhibit good or fair agreement with the measured patterns for most modules (Fig. 2a). The parameters behave in a biologically plausible fashion: fitted values typically differ by less than an order of magnitude between the different factors, and the trained PSSMs show only small changes from their original settings (Fig. 3a, and Supplementary Fig. 2). The expression of gap gene modules is generally predicted very well, suggesting that our model has adequately captured their input and rules. In contrast, prediction of pair-rule gene modules is more mixed, with failures resulting from missing activation (modules receiving little maternal activator input), or occasionally from ectopic expression that is due to missing repression, mostly in the head region of the embryo (Supplementary Fig. 3). Because our model includes only self-cooperative interaction, we also fail to predict the module generating even-skipped (eve) stripe 2 (eve_2), which is known to require positive synergy between BCD and HB24. Overall, the failures of our model are as instructive as its successes—they suggest that some input factors and some higher interaction rules are not captured, but also that the model does not artificially compensate for these missing features. Model validation A critical test for our model is whether it can predict the expression patterns of modules that were not used as input when fitting the parameters. We used two such sets of held-out modules: 11 recently published anterior modules4, and 15 segmentation modules from the related species D. pseudoobscura, which we identified and tested in a separate study (S. Sinha et al., manuscript in preparation). The expression of D. pseudoobscura modules was measured using transgenic reporter constructs in D. melanogaster, such that all observed effects were attributable to module sequence. While producing only mild to moderate changes in expression, the D. pseudoobscura modules show substantial sequence turnover compared to their D. melanogaster orthologues (average sequence identity 49%; Supplementary Fig. 4) and thus represent a profound cis perturbation. For both test sets, our model, using the parameters trained on the original 44 modules, predicts expression with mostly good or fair
Modelling pattern formation in segmentation To apply our model to the segmentation network, we used as input the spatial expression patterns22 for eight key transcription factors, that is, Bicoid (BCD), Hunchback (HB), Caudal (CAD), Kruppel (KR), Giant (GT), Torso-response element (TorRE), Knirps (KNI), Tailless (TLL), and their binding-site preferences5,23. We asked the model to predict the spatial expression of 44 gap and pair-rule gene modules with known patterns, collated from literature and from our own work5. We modelled the input–output relationship for one developmental time point, using a time at which both the input factor Module sequence
Input factor distribution
Input
100
80
60
40
20
Binding preferences 0 %EL
…TAAATACTTGGCAA TACTCTAGGAATTTT CTAGACTTTACCTAC TGGCTAAATCGAAG…
CAD
CAD KNI HB AP position 35
200
400
600 bp
(No HB bindi ng)
Configurations (c)
Expression (E)
0.0018
0.002 x 0.0018
4w + 1w = -3
0.953 x 0.0071
4w + 3w = 1
0.269 x 0.0012
+ +
Module
Target gene
w = 1 w = –1
Transcript
…
KNI CAD Binding site
1w + 4w = –3
…
Configurations of factor binding to 0.0071 DNA and resulting 0.0012 expression
E x P(c)
…
P(c)
…
Thermodynamic modelling
0
Binding energy along module sequence, for a given AP position
= 0.26
Output
AP position 35
Factor occupancy over all AP positions Predicted module expression Measured module expression AP position (% EL)
Fit parameters to maximize agreement between measured and predicted patterns
2 ©2007 Nature Publishing Group
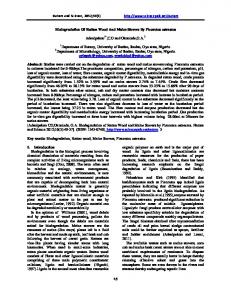
Figure 1 | Overview of the thermodynamic model and approach. Flow diagram showing input, output and the main steps of the computational framework, for a simplified version of the eve_4_6 module with three transcription factor inputs. The computation is shown for one particular position along the antero-posterior (AP) axis, measured as percentage of egg length (%EL). At each anteroposterior position, the factor concentrations (top panels) define a binding energy landscape for all factors across the module sequence, which is then translated into a factor occupancy distribution (middle panel). Each factor configuration, c, results in a particular expression level, E, represented as a fraction of the maximal achievable transcription rate and calculated from the number of transcription factors bound in the configuration and the factor-specific expression contribution parameters wtf , using the logistic function. The overall resulting expression outcome at each position (bottom panel) is then computed as the sum of the expression contribution of each configuration, weighted by their probability P(c). For a detailed description see main text and Supplementary Information.
ARTICLES
NATURE
accuracy; the success rate is similar to that obtained with the training data (Fig. 2b, c). Notably, with few exceptions, modules that are predicted well in D. melanogaster are also predicted well in D. pseudoobscura, highlighting the model’s intrinsic consistency. As a further test, we conducted a standard tenfold cross validation assay, using an automated objective performance measure that scores the expression predictions at each antero-posterior position as ‘on’ or ‘off’, depending on whether they are above a certain threshold, and iterates over all possible thresholds. The resulting sensitivity/ specificity plots reveal that our model performs much better than random expectation or models using various types of randomized weight matrices; similar results are obtained when applying this automated performance assessment to the above two sets of held-out modules (Supplementary Fig. 5). Taken together, our validation tests provide strong evidence that the successful predictions are not the result of overfitting the input data, and thus suggest that our model indeed captures core principles governing pattern formation in the segmentation network. Weak sites and cooperativity Our model predicts a high occupancy of factors on the modules: on average, 14–27% of the module DNA is occupied by factor molecules, with some variation along the antero-posterior axis (Fig. 4a). Translated into binding events, this suggests an average of 10–60 bound molecules per module at each antero-posterior position, depending on module length. This high occupancy is consistent with the results of footprinting experiments and genome-wide chromatin immunoprecipitation of segmentation and other factors25–27. Much of the occupancy is attributable to factor binding to moderate or weak binding sites. Although modules are enriched in stronger sites, such sites collectively account for only about half of the total factor occupancy; the other half comes from weaker sites that occur no more frequently than is expected by chance and whose PSSM scores place them at the low end of the range defined by footprinted sites (Fig. 3b). Interestingly, models that exclude weaker binding sites have a
Kr_CD2
h_15
eve_5
kni_–5
prd_+4
run_5
gt_–6
odd_–5
gt_–3
hb_ant
D_+4
h_6
cnc_+5
Kr_CD1
cad_+14
hkb_ven
h_3_4
oc_+7
eve_37e
Kr_AD2
knrl_+8
run_3
eve_1
kni_+1
run_–9
run_1
oc_otd
odd_–3
ftz_+3
tll_P2
pdm2_+1
eve_2
slp2_–3
nub_–2
hb_cent
gt_–10
eve_46
h_7
gt_–1
kni_83
tll_K2
run_–17
btd_hd AP position (%EL) Measured
b
Design principles of segmentation Earlier work on individual modules34–37 had shown that their expression patterns are generated by combinatorial action of input factors, with maternal factors acting as activators and gap factors mostly as
fkh_–2 AP position (%EL)
Predicted module expression
AP position (%EL) Good
Fair
Poor
Figure 2 | Predicted expression patterns and model validation. a–c, Comparison between measured module expression patterns (red) and those predicted by the model (blue) for all 44 modules used to fit the parameters (a), as well as for modules not used for parameter fitting (b, c): b, 11 recently identified anterior modules4 (note that gt_23, gt_1, prd_1 and D_body represent shorter delineations of our modules gt_210, gt_26, prd_14 and D_14, respectively); c, Fifteen modules from D. pseudoobscura (S. Sinha et al., manuscript in preparation). Sequence identity as determined by pairwise sequence alignment is indicated in parentheses; the orthologous D. melanogaster modules are marked by grey triangles in a. Modules were subjectively classified into three categories (good, fair, poor) on the basis of the quality of the match between measured and predicted pattern and the amount of spurious expression.
slp_B
CG9571
tll_head
mir7
slp_A
bowl_col
gt_1
gt_23
D_body
h_0
c
lower predictive power (Supplementary Fig. 5b), demonstrating their importance for pattern formation. The use of many contributing sites may help to reduce gene expression noise by increasing the frequency of activation steps28, and confer robustness to the module expression pattern against point mutations and small deletions: by in silico mutational analysis, we find that point and small deletion mutations are tolerated in 8 to 15% of total module length, with little effect on the resulting expression patterns (Supplementary Fig. 6). Low affinity binding sites will frequently occur by chance within the length of a typical module, but specificity may be increased by clustering. Indeed, we find that 5 of the 8 transcription factors participating in the system show significant short-range homotypic clustering of binding sites within the modules, typically within 200 bp (Fig. 3c); the only exceptions are factors for which the available binding site information is either relatively unspecific or very sparse (see Methods). We observe no systematic heterotypic clustering between binding sites of different factors. An important feature of homotypic site clustering is that it facilitates cooperative binding, which plays an important role in transcriptional switches29 and leads to a sharpening of expression patterns in BCD-dependent modules30,31. Notably, when cooperativity effects are disregarded, our model predicts expression patterns with a very gradual decay along the antero-posterior axis, in contrast to the sharp boundaries of the measured expression profiles and indeed to the much sharper patterns predicted by the full model (Fig. 4b, and Supplementary Figs 7, 8); this suggests the pervasive use of cooperativity in segmentation. We do not know how cooperativity is achieved mechanistically—by homotypic protein–protein interactions, transcriptional synergy, or perhaps competition with nucleosomes32,33— but the similar narrow range within which the clustering occurs for most factors suggests a general common mechanism.
prd_1
Kr_CD2
(52%) gt_–10
(44%) nub_–2
(50%)
kni_–5
(43%) gt_–1
(44%) kni_83
(41%)
gt_–6
(38%) h_15
(53%) gt_–3
(41%)
kni_+1
(41%) Kr_CD1
(57%) h_6
(61%)
slp2_–3
(50%) eve_37e (51%)
eve_1
(66%)
3 ©2007 Nature Publishing Group
ARTICLES
NATURE
the gap gene gt (Fig. 5, and Supplementary Figs 9, 10). Modules generally disfavour but do not exclude sites for co-extensively expressed repressors; sites for the cognate factor, however, are very rare: of the 11 modules driving the expression of the primary gap gene domains, only 3 have significant input by the factor itself (gt_26, Kr_CD2, tll_K2) (Supplementary Fig. 10). This argues against a significant role for direct auto-regulation of gap factors in the patterning, which had figured prominently in several theoretical models15,41. Interestingly, we find no (positive) correlation between the strength of BCD input and the posterior border of target module expression (Fig. 4c). This finding suggests that the number/quality of BCD-binding sites in the target modules is not the sole determinant of position in the anterior portion of the embryo as envisaged by the gradient–affinity model of BCD action42,43; rather, module expression boundaries seem to be determined as much by repressive gap gene input as by attenuation of maternal activation4. We find little overlap between the binding preferences of the different input factors, and as noted above, no heterotypic clustering. This suggests that the different factors bind to the DNA largely independently and that sequence-specific competition or occlusion, which had been proposed as a mechanism of repressor action35,44,45, does not play a major role. The one exception is the strong overlap in binding preferences between HB and CAD (Fig. 4d, and Supplementary Fig. 11), which is in fact exploited in the design of many posterior modules: because the two factors have opposing
repressors. The results of our modelling support these general notions, but argue against other previously suggested design principles. Our model classifies the maternal factors BCD, CAD and TorRE as activators, and the zygotic gap factors (HB, GT, KR, KNI, TLL) as repressors (Fig. 3a), suggesting that context-dependent function, which had been proposed for some gap factors24,35,38–40, is not necessary to account for most expression patterns. The maternal activators show higher total occupancy in modules that are expressed and lower occupancy in modules that are not expressed in the same region as they are, indicating that their prevalent mode of action is indeed activation; the zygotic factors show the converse behaviour (Fig. 3d). Interestingly, both activators and repressors show significant binding in ‘inappropriate’ modules, albeit at lower levels, suggesting that module design is not entirely parsimonious. When we examine how the expression patterns of individual modules are generated, we find that all modules are highly combinatorial in design and generally contain one or two types of activating input and multiple repressive inputs, with preference for co-extensive activator(s) and against co-extensive repressors: modules typically receive activation from the activator most appropriate for their region, with some choice in the middle (BCD/CAD) and at the termini (BCD/TorRE or CAD/TorRE) of the embryo; the choice of activator(s) entails the choice of appropriate repressors. An illustrative example for these design features is the differential factor occupancy in the modules generating the two main expression domains of a
b
Bicoid
Original Conc. 0.003 Expr. Trained 1.85 Coop. 5.73
c
Site freq. vs Fraction of: random binding sites total occupancy known sites 0.2 3 0.1
8 6
2
4
0.0 1 –11 –7 –3 1 5 9 13 17
2 0
Caudal
Binding site strength Conc. 0.001 Expr. 1.04
Kruppel
Hunchback
Coop. 4.20 Conc. 0.008 Expr. –0.05 Coop. 6.22 Conc. 0.004 Expr. –0.22 Coop. 4.45
0.3
4
20
0.2
3
15
0.1
2
10
0.0 1 –11 –7 –3 1 5 9 13 17
5
0.2 20 0.1
10
0.0 0 –11 –7 –3 1 5 9 13 19 0.3 3
0.2
2
0.1
0.0 1 –11 –7 –3 1 5 9 13 17
Figure 3 | Participating transcription factors and their behaviour. a, PSSMs representing binding preferences before (upper panels) and after (lower panels) training and other parameters (absolute factor concentration, expression contribution and self-cooperativity) as fitted by our model, for four key transcription factors regulating segmentation (see Supplementary Fig. 2 for all eight factors). b, Binding-site strength and contribution to occupancy. For each factor, histograms show as a function of site strength: the number of binding sites (expressed as fraction of all sites, light blue columns, left scale), and the fraction of the total factor occupancy contributed by sites of this strength (orange columns, left scale). Bindingsite strength is defined as the log-ratio between the PSSM and background model score of the site21, using a uniform background. Over-/underrepresentation of sites in modules (grey line, right scale) is calculated as the ratio of the number of sites of a given strength in the actual module sequence
d True sites Permuted sites P < 0.01
0 25 20 15 10 5 0 5 4 3 2 1 0
Avg. factor Factor occupancy in: expression expressed modules non-expressed modules 6 1 4 2
0 0 200 400 600 800 100 75 50 25 AP position (%EL) Site-to-site distances (bp)
0 0
12
1
8 4 0
200
400
0 600 800 100
75
50
25
0
10 8
0
200
400
6 4 2 0 600 800 100
0 1
75
50
25
0
20
0 1
15 10 5 0
200
400
0 600 800 100
0 75
50
25
0
versus the number of such sites in randomly permuted module sequence (shown is mean 6 s.d. computed from 100 permutations). The strength of experimentally footprinted sites is represented by dark blue squares below the histogram. c, Short-range homotypic clustering of binding sites. Shown is the number of pairwise distances between same-factor sites that are within a range of k to k 1 50 bp, plotted for values of k from 0 to 800 (y axis) and expressed as average per module (blue line), compared to results of 1,000 permutation tests in which the predicted sites are randomly placed within each module (grey line, mean 6 s.d.). d, For each factor, shown is the measured endogenous expression (black), compared with the average predicted total factor occupancy in modules expressed at a given anteroposterior position (blue), and with average predicted total occupancy in modules not expressed at that position (pink); note differing behaviour of activators and repressors.
4 ©2007 Nature Publishing Group
ARTICLES
NATURE
0
8 6 4 2 0 100 80 60 40 20 0 Posterior border of expr. (%EL)
10 r = 0.31 –10 –20 –30 –40
Known sites: CAD Known sites: HB –60 –40 –20 0 Hunchback
20
10 r = 0.03 0 –10 –20 –30 –40 Known sites: BCD –50 Known sites: HB –60 –60 –40 –20 0 20 Hunchback
Figure 4 | Cooperative DNA binding and binding site overlap. a, Fraction of module sequence (mean 6 s.d.) that is occupied by factors at each anteroposterior position, averaged across all modules. b, Effects of modelling selfcooperativity for the hb_ant module: with cooperative binding permitted, graded BCD input is translated into a much sharper pattern of BCD occupancy and predicted module expression. c, Strength of BCD input shows no (positive) correlation with the posterior boundary of module expression. For each module, the position of its measured posterior expression boundary (x axis) is plotted against the maximum predicted total occupancy of BCD along any antero-posterior position (‘Bicoid affinity’, y axis); BCD protein distribution is shown as a purple curve. d, Scatterplots visualizing the correlation between the binding-site strengths (presented as the log-ratio between the PSSM and background model score) with which two factors bind to each position in the concatenated sequence of all modules. HB and CAD show significant overlap in their binding preferences, whereas HB and BCD do not; see also Supplementary Fig. 11. The known binding sites for the two factors, from which the PSSMs were derived, are highlighted.
expression patterns and functions, a broad abdominal pattern can be generated through differential occupation of overlapping CAD/HB sites along the antero-posterior axis by one or the other factor, with CAD causing activation in the posterior portion of the embryo and HB causing repression in the anterior and near the posterior terminal. Additional repressive input then further narrows module expression boundaries, as seen, for example, in gt_23 (Fig. 5, and Supplementary Fig. 10). The central biological task of the segmentation gene network is to subdivide the embryo along the antero-posterior axis by translating broad maternal gradients into successively narrower and sharper patterns. Our analysis suggests that this is accomplished by parallel combinatorial input of multiple factors and self-cooperative factor interaction. It is intriguing that these crucial design features are embedded locally within the cis-regulatory sequence rather than in the trans-factor network and the basal machinery, which presumably increases the reliability of the readout and the ability of the system to evolve. Conclusions We have presented a quantitative model for transcription control in pattern formation that integrates sequence and expression information and seeks to capture the mechanistic core of the process. Input factors bind DNA at thermodynamic equilibrium, dependent only on their concentration and on the arrangement and quality of their sites within the modules, but without introducing thresholds or other filters. By applying the model to the segmentation network of Drosophila, we demonstrate that these principles, in conjunction with uniform and biologically plausible parameters for the unknown aspects of the molecular interactions, are sufficient to produce the patterns of most experimentally validated modules with substantial
100
Maternal genes (activators) HB
GT
KR KNI
TLL Gap genes (repressors)
75
50 25 AP position (% EL)
0 Pair-rule genes
b Expression
Measured
Activator occupancy
BCD
Repressor occupancy
HB
Predicted
CAD GT
KR
TorRE KNI
TLL
AP position (%EL)
gt_ –1
BCD
Measured module expr. AP position (%EL)
TorRE
e v e _ 4_ 6
10
d
0
CAD
gt_ – 3
Coop. 80 60 40 20 AP position (%EL)
Input factor distribution
No coop.
BCD
Kr_CD1
Occupancy Module expression
0.15
a
hb_ a nt
0.20
Bicoid
Bicoid affinity
hb_ant
tll_ p2
0.25
0.10 100
c
BCD binding energy Sequence position BCD distribution
gt_ –10
b
0.30
Caudal
Occupied base pairs (%)
a
Figure 5 | Regulatory input and expression of segmentation modules. a, Distribution of the eight participating transcription factors along the antero-posterior axis, with maternal factors (activators) and gap factors (repressors) plotted separately, and schematic depiction of the global architecture of the segmentation network. b, Graphs show the occupancies of the participating transcription factors at every position along the anteroposterior axis for selected modules, thus indicating which factors control expression at a particular position. Occupancy curves are colour-coded by factor; the curves for activators (middle) and repressors (bottom) are superimposed and plotted separately; the resulting predicted expression level (grey) is shown on top, superimposed on measured expression level (orange); see also Supplementary Fig. 10.
accuracy, even across species. A notable feature of our approach is that the network structure between factors and their target genes is not pre-defined; rather, we assume a fully connected network in which all possible factor–module interactions are considered and the network structure is an emergent property of the molecular cisregulatory interactions, changing dynamically with the variation in local factor concentrations. Our framework is generally applicable and likely to prove useful for many other protein–DNA interaction systems. Several important issues need to be addressed to improve further the predictive accuracy of our model, such as integrating the temporal evolution of expression patterns, modelling heterotypic synergy (BCD/HB) or other non-additive factor interactions (for example, repressor quenching), identifying missing input factors, and incorporating competition with nucleosomes. The model will also greatly benefit from additional experimentation to constrain parameter values, such as measuring factor cooperativity and improving the PSSMs. METHODS SUMMARY Spatial expression patterns and measured binding preferences for eight transcription factors in the segmentation network were obtained from published sources5,22; for selected factors, the functionality of the consensus sites was confirmed by insertion into a synthetic enhancer46. Expression patterns for segmentation gene modules were collected from published sources4,5 or our own work and measured as described5. The full mathematical details and fitting procedures of our model are described in the Supplementary Information. The significance of local clustering of binding sites was assessed by calculating 5
©2007 Nature Publishing Group
ARTICLES
NATURE
the number of all pairwise distances between sites for the factor(s) considered that fall within moving windows of 50 bp, and comparing this to the results obtained when the same number of binding sites are randomly placed within each module. The occupancy of a factor at a base pair and antero-posterior position is defined as the sum of the probabilities of all configurations in which the base is occupied by the factor; the total occupancy contribution of a binding site is then the sum of its occupancy across all antero-posterior positions, and the fractional occupancy contribution of a binding site is equal to its total occupancy divided by the total occupancy of all binding sites for the factor. For input data and results, see our website http://genie.weizmann.ac.il/pubs/segnet08. Full Methods and any associated references are available in the online version of the paper at www.nature.com/nature. Received 2 August; accepted 20 November 2007. Published online 2 January 2008. 1. 2. 3.
4.
5. 6. 7. 8.
9.
10. 11. 12.
13. 14. 15. 16.
17.
18. 19. 20. 21. 22.
23.
Jackle, H. et al. Transcriptional control by Drosophila gap genes. J. Cell Sci. (suppl.) 16, 39–51 (1992). Ren, B. et al. Genome-wide location and function of DNA binding proteins. Science 290, 2306–2309 (2000). Berman, B. P. et al. Computational identification of developmental enhancers: conservation and function of transcription factor binding-site clusters in Drosophila melanogaster and Drosophila pseudoobscura. Genome Biol. 5, R61 (2004). Ochoa-Espinosa, A. et al. The role of binding site cluster strength in Bicoiddependent patterning in Drosophila. Proc. Natl Acad. Sci. USA 102, 4960–4965 (2005). Schroeder, M. D. et al. Transcriptional control in the segmentation gene network of Drosophila. PLoS Biol. 2, E271 (2004). Xie, X. et al. Systematic discovery of regulatory motifs in human promoters and 39 UTRs by comparison of several mammals. Nature 434, 338–345 (2005). Tavazoie, S., Hughes, J. D., Campbell, M. J., Cho, R. J. & Church, G. M. Systematic determination of genetic network architecture. Nature Genet. 22, 281–285 (1999). Albert, R. & Othmer, H. G. The topology of the regulatory interactions predicts the expression pattern of the segment polarity genes in Drosophila melanogaster. J. Theor. Biol. 223, 1–18 (2003). Segal, E. et al. Module networks: identifying regulatory modules and their condition-specific regulators from gene expression data. Nature Genet. 34, 166–176 (2003). Granek, J. A. & Clarke, N. D. Explicit equilibrium modeling of transcription-factor binding and gene regulation. Genome Biol. 6, R87 (2005). Bintu, L. et al. Transcriptional regulation by the numbers: models. Curr. Opin. Genet. Dev. 15, 116–124 (2005). Zinzen, R. P., Senger, K., Levine, M. & Papatsenko, D. Computational models for neurogenic gene expression in the Drosophila embryo. Curr. Biol. 16, 1358–1365 (2006). von Dassow, G., Meir, E., Munro, E. M. & Odell, G. M. The segment polarity network is a robust developmental module. Nature 406, 188–192 (2000). Eldar, A. et al. Robustness of the BMP morphogen gradient in Drosophila embryonic patterning. Nature 419, 304–308 (2002). Jaeger, J. et al. Dynamic control of positional information in the early Drosophila embryo. Nature 430, 368–371 (2004). Janssens, H. et al. Quantitative and predictive model of transcriptional control of the Drosophila melanogaster even skipped gene. Nature Genet. 38, 1159–1165 (2006). Nasiadka, A., Dietrich, B. H. & Krause, H. M. in Advances in Developmental Biology and Biochemistry: Regulation of Gene Expression at the Beginning of Development (ed. DePamphilis, M.) 155–204 (2002). Rivera-Pomar, R. & Jackle, H. From gradients to stripes in Drosophila embryogenesis: filling in the gaps. Trends Genet. 12, 478–483 (1996). Furriols, M. & Casanova, J. In and out of Torso RTK signalling. EMBO J. 22, 1947–1952 (2003). St Johnston, D. & Nusslein-Volhard, C. The origin of pattern and polarity in the Drosophila embryo. Cell 68, 201–219 (1992). Stormo, G. D. & Hartzell, G. W. III. Identifying protein-binding sites from unaligned DNA fragments. Proc. Natl Acad. Sci. USA 86, 1183–1187 (1989). Myasnikova, E., Samsonova, A., Kozlov, K., Samsonova, M. & Reinitz, J. Registration of the expression patterns of Drosophila segmentation genes by two independent methods. Bioinformatics 17, 3–12 (2001). Rajewsky, N., Vergassola, M., Gaul, U. & Siggia, E. D. Computational detection of genomic cis-regulatory modules applied to body patterning in the early Drosophila embryo. BMC Bioinformatics 3, 30 (2002).
24. Simpson-Brose, M., Treisman, J. & Desplan, C. Synergy between the hunchback and bicoid morphogens is required for anterior patterning in Drosophila. Cell 78, 855–865 (1994). 25. Tanay, A. Extensive low-affinity transcriptional interactions in the yeast genome. Genome Res. 16, 962–972 (2006). 26. Carr, A. & Biggin, M. D. A comparison of in vivo and in vitro DNA-binding specificities suggests a new model for homeoprotein DNA binding in Drosophila embryos. EMBO J. 18, 1598–1608 (1999). 27. Biggin, M. D. & Tjian, R. Transcriptional regulation in Drosophila: the post-genome challenge. Funct. Integr. Genomics 1, 223–234 (2001). 28. Raser, J. M. & O’Shea, E. K. Control of stochasticity in eukaryotic gene expression. Science 304, 1811–1814 (2004). 29. Ptashne, M. & Gann, A. Genes and Signals 26–37 (Cold Spring Harbor Laboratory Press, Cold Spring Harbor, 2002). 30. Crauk, O. & Dostatni, N. Bicoid determines sharp and precise target gene expression in the Drosophila embryo. Curr. Biol. 15, 1888–1898 (2005). 31. Lebrecht, D. et al. Bicoid cooperative DNA binding is critical for embryonic patterning in Drosophila. Proc. Natl Acad. Sci. USA 102, 13176–13181 (2005). 32. Segal, E. et al. A genomic code for nucleosome positioning. Nature 442, 772–778 (2006). 33. Vashee, S., Melcher, K., Ding, W. V., Johnston, S. A. & Kodadek, T. Evidence for two modes of cooperative DNA binding in vivo that do not involve direct protein–protein interactions. Curr. Biol. 8, 452–458 (1998). 34. Hoch, M., Seifert, E. & Jackle, H. Gene expression mediated by cis-acting sequences of the Kru¨ppel gene in response to the Drosophila morphogens bicoid and hunchback. EMBO J. 10, 2267–2278 (1991). 35. Small, S., Kraut, R., Hoey, T., Warrior, R. & Levine, M. Transcriptional regulation of a pair-rule stripe in Drosophila. Genes Dev. 5, 827–839 (1991). 36. Rivera-Pomar, R., Lu, X., Perrimon, N., Taubert, H. & Jackle, H. Activation of posterior gap gene expression in the Drosophila blastoderm. Nature 376, 253–256 (1995). 37. Arnosti, D. N., Barolo, S., Levine, M. & Small, S. The eve stripe 2 enhancer employs multiple modes of transcriptional synergy. Development 122, 205–214 (1996). 38. Sauer, F. & Jackle, H. Heterodimeric Drosophila gap gene protein complexes acting as transcriptional repressors. EMBO J. 14, 4773–4780 (1995). 39. La Rosee, A., Hader, T., Taubert, H., Rivera-Pomar, R. & Jackle, H. Mechanism and Bicoid-dependent control of hairy stripe 7 expression in the posterior region of the Drosophila embryo. EMBO J. 16, 4403–4411 (1997). 40. Langeland, J. A., Attai, S. F., Vorwerk, K. & Carroll, S. B. Positioning adjacent pairrule stripes in the posterior Drosophila embryo. Development 120, 2945–2955 (1994). 41. Meinhardt, H. Hierarchical inductions of cell states: a model for segmentation in Drosophila. J. Cell Sci. (Suppl.) 4, 357–381 (1986). 42. Driever, W. & Nusslein-Volhard, C. The bicoid protein determines position in the Drosophila embryo in a concentration-dependent manner. Cell 54, 95–104 (1988). 43. Ephrussi, A. & St Johnston, D. Seeing is believing: the bicoid morphogen gradient matures. Cell 116, 143–152 (2004). 44. Hoch, M., Gerwin, N., Taubert, H. & Jackle, H. Competition for overlapping sites in the regulatory region of the Drosophila gene Kruppel. Science 256, 94–97 (1992). 45. Stanojevic, D., Small, S. & Levine, M. Regulation of a segmentation stripe by overlapping activators and repressors in the Drosophila embryo. Science 254, 1385–1387 (1991). 46. Sutrias-Grau, M. & Arnosti, D. N. CtBP contributes quantitatively to Knirps repression activity in an NAD binding-dependent manner. Mol. Cell. Biol. 24, 5953–5966 (2004).
Supplementary Information is linked to the online version of the paper at www.nature.com/nature. Acknowledgements We thank D. Leaman and M. Dandapani for the in vivo analysis of binding sites and are indebted to E. Siggia, S. Sinha and J. Widom for valuable discussions at the outset of the project. This work was supported by a Fellowship from the Center for Studies in Physics and Biology at Rockefeller University (E.S.), by the European Network of Excellence (E.S. and T.R.-S.), by a Rockefeller University Graduate Fellowship (M.S.) and by an NIH grant (U.G.); E.S. is the incumbent of the Soretta and Henry Shapiro career development chair. Author Information Reprints and permissions information is available at www.nature.com/reprints. Correspondence and requests for materials should be addressed to E.S. (
[email protected]) or U.G. (
[email protected]).
6 ©2007 Nature Publishing Group
doi:10.1038/nature06496
METHODS Data sets. Spatial expression patterns for eight transcription factors in the network were obtained from ref. 22, and measured binding sites for these factors were obtained from ref. 5. Sequences and expression patterns for 44 gap and pairrule gene modules are from ref. 5, S. Sinha et al., manuscript in preparation, and M.S and U.G., unpublished, and are available at our website (see below). Module expression patterns were measured as described5. Binding-site information is available for all eight transcription factors5, but varies considerably in extent and quality, with two factors, KNI and TLL, having fairly unspecific PSSMs, and TorRE an overly specific one, owing to the paucity of known binding sites (Supplementary Fig. 2a). Despite such differences, the consensus sequences for BCD, HB, GT, KR47 and KNI48 show excellent in vivo binding when placed in synthetic modules (Supplementary Fig. 12) and can thus be considered reliable. We therefore constrained our procedure for fitting the factor weight matrices such that they maintain the experimentally derived consensus. Thermodynamic model. The full mathematical details and fitting procedures of our model are provided in Supplementary Information. Testing the significance of local clustering of binding sites. We define the occupancy of a factor at a base pair and a particular antero-posterior position as the sum of the probabilities of all those configurations at that antero-posterior position in which the base pair is occupied by the factor. This quantity can be computed exactly using dynamic programming (see Supplementary Information). To test whether binding sites of a factor are significantly locally clustered in modules, we defined discrete binding sites for each factor as those sites that have an occupancy for the factor of $0.2 in at least one antero-posterior position. We then calculated the number of all pairwise distances between sites for the same factor that fall within a window k to k 1 50 base pairs, for different values of k ranging from 0 to 1,000. To test for significance, we randomly permuted the locations of the binding sites for the tested factor within each module (while preserving the number of binding sites per module), and repeated the computation for the randomly placed sites. Each permutation was performed 1,000 times. Calculating the occupancy contribution of binding sites. The occupancy of a binding site by a factor at each particular position is computed as above. We define the total occupancy contribution of a binding site as the sum of its occupancy across all antero-posterior positions. The fractional occupancy contribution of a binding site is then equal to its total occupancy divided by the sum of the total occupancy of all binding sites for the factor. For the histograms in Fig. 3b, we only considered binding sites that achieve occupancy $0.01 at any antero-posterior position. Experimental methods. The functions of transcription-factor-binding sites were tested by insertion into a synthetic ventral enhancer driving a lacZ reporter46 and examination of the resulting in vivo expression by RNA in situ hybridization. URLs. For input data and results, see http://genie.weizmann.ac.il/pubs/segnet08. The results are viewable in Genomica (http://Genomica.weizmann.ac.il), a genomic analysis software freely available for academic use. 47. Gray, S. & Levine, M. Short-range transcriptional repressors mediate both quenching and direct repression within complex loci in Drosophila. Genes Dev. 10, 700–710 (1996). 48. Arnosti, D. N., Gray, S., Barolo, S., Zhou, J. & Levine, M. The gap protein knirps mediates both quenching and direct repression in the Drosophila embryo. EMBO J. 15, 3659–3666 (1996).
©2007 Nature Publishing Group