AAS 08-076
Navigation System for Reusable Launch Vehicle Markus Schlotterer German Aerospace Center (DLR)
31st ANNUAL AAS GUIDANCE AND CONTROL CONFERENCE February 1-6, 2008 Breckenridge, Colorado
Sponsored by Rocky Mountain Section
AAS Publications Office, P.O. Box 28130 - San Diego, California 92198
AAS 08-076
NAVIGATION SYSTEM FOR REUSABLE LAUNCH VEHICLE Markus Schlotterer∗ PHOENIX is a downscaled experimental vehicle to demonstrate automatic landing capabilities of future Reusable Launch Vehicles (RLVs). PHOENIX has flown in May 2004 at NEAT (North European Aerospace Test range) in Vidsel, Sweden. As the shape of the vehicle has been designed for re-entry, the dynamics are very high and almost unstable. This requires a fast and precise GNC system. This paper describes the navigation system and the navigation filter of PHOENIX. The system is introduced and the high requirements are shown. The sensor configuration to fulfill the requirements is presented. Special focus is laid on the development and the structure of the navigation filter. The flight results of PHOENIX are shown and the performance of the navigation system is analyzed, which includes sensor failure scenarios.
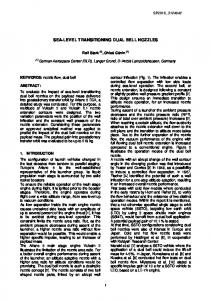
INTRODUCTION The flight experiment PHOENIX shown in figure 1 is a downscaled prototype (length: 6.775 m, wingspan: 3.84 m, mass: 1200 kg) of a Reusable Launch Vehicle which has flown in May 2004. It has been built by EADS Space Transportation, while EADS ST, OHB System GmbH Bremen and the university institute ZARM (Center of Applied Space Technology and Microgravity) have been responsible for navigation system design, sensor selection, navigation algorithm development and software implementation. PHOENIX has been dropped from a helicopter at an altitude of 2400 m and after a short flight phase it landed automatically on a runway. As the shape of PHOENIX has been developed for re-entry, the dynamics of the vehicle are very fast and almost unstable. To control it, a fast and precise navigation system is required. The navigation solution has to be provided with a sample rate of 50 Hz. The requirement for the attitude estimation is 0.3 deg, the horizontal position has to be measured or estimated with an accuracy of 10 m to reach the runway and the accuracy of the vertical position has to be better than 3% of the altitude or 0.6 m for altitudes lower than 200 m. On the other hand, to be independent ∗ German
Aerospace Center (DLR), Institute of Space Systems, Am Fallturm 1, D 28359 Bremen, Germany. E-mail:
[email protected].
1
Figure 1: PHOENIX Experimental Vehicle from the landing site only non-ground-based sensors or sensors with minimal ground equipment have been used. To meet all these requirements the following sensors have been utilized: an inertial navigation system with laser ring gyros and accelerometers to measure attitude rates and accelerations. These are integrated to attitude, velocity and position. To overcome the problem of the drift of the inertial solution, the solution has been corrected by position measurements from a Differential GPS receiver and by altitude measurements from a radar altimeter and a laser ranger. To merge the data from the different sensors, to estimate non-measured states and to provide a fast and optimal navigation solution an Extended Kalman-Filter has been implemented. This paper describes the PHOENIX mission, the used navigation sensor configuration and the navigation filter concept. Problems that arose during the filter development are presented and the solutions to overcome these problems are described. This includes numerically improved Kalman-Filter algorithms and implementation issues to handle preintegrated navigation data from the inertial navigation system. The test results of the successful PHOENIX flight tests are presented. The navigation data are analyzed and compared to the covariances. Using the sensor data from the test flights it is shown how the navigation filter reacts to sensor failure and whether the requirements for the navigation solution are still reached. Problems that arose during the flight test and the following data analysis have been identified. It is shown to what extend the choice of the navigation filter concept has an
2
impact on the appearance of these problems. An outlook is given on what can be improved for future flights. This includes development of an advanced simulator, better choice of the navigation coordinate system and filter concept as well as extended data recording for high accuracy flight path reconstruction. MISSION SCENARIO PHOENIX has been lifted to an altitude of 2400 m by a helicopter. During this captive flight all navigation sensors have been working and the correct function of the navigation system has been tested. The helicopter with the attached PHOENIX flew a lying eight to stimulate the attitude estimation of the navigation filter (see figure 2).
Figure 2: PHOENIX nominal ground track At an altitude of 2400 m PHOENIX has been aligned with the runway and has been released with an initial velocity of v = 51.7 m/s (see figure 3). During the first seconds the flight of PHOENIX has been like a free fall and the vehicle took its nose down to accelerate. At a velocity of about v = 100 m/s the guidance started, PHOENIX aligned itself with the runway and reached the nominal approach path with a flight path angle of γ = −21◦ and a almost constant velocity of v = 120 to 127 m/s (see figure 4). 43 seconds after the release at an altitude of 650 m the flare maneuver started, PHOENIX took its nose up and decelerated. 26 seconds later the rear wheels of PHOENIX touched down on the runway at a flight path velocity of 72.45 m/s and a vertical velocity of 0.97 m/s. A few seconds later the front wheel touched down too and about 100 seconds after the release PHOENIX stood still on the runway. An overview of the altitude profile of the PHOENIX free flight is shown in figure 5. REQUIREMENTS To control the vehicle safely and precisely despite the high and fast dynamics the requirements for the navigation system had to be very demanding regarding accuracy and sample rate. The requirements are summarized in table 1 (3σ values).
3
2000 1000 0 4700
4720
4740
4760 Time [s]
4780
4800
4820
50 0 −50 −100 4700
4720
4740
4760 Time [s]
4780
4800
Euler angles [rad] −6000
−5000
−4000
−3000 −2000 Position X [m]
−1000
0
1000
−0.2 4700
0
4720
4740
4760 Zeit [s]
4780
4800
−5 4820
10 0 −10 X−Acc. Y−Acc. Z−Acc.
−20 4720
4740
4760 Time [s]
4780
4800
4820
Flight path velocity Ground velocity
100 50
4720
4740
4760 Time [s]
4780
4800
0
4720
4740
4760 Time [s]
4780
4800
4820
4720
4740
4760 Time [s]
4780
4800
4820
0.4 0.2 0 −0.2 −0.4 4700
4820
Roll angle Pitch angle Azimuth
−0.5 −1 4700
2000
Attitude rates [rad/s]
Position Y [m]
20
150 Velocity [m/s]
0
0.5
0
0 4700
5 Flight path azimuth Lateral velocity
−30 4700
4820
−20
40 −7000
0.2
Figure 4: Flight data of first flight
4
Lateral velocity [m/s]
Flight path azimuth [rad]
3000
Accelerations [m/s2]
Vertical velocity [m/s]
Attitude above ground [m]
Figure 3: Release from helicopter
Figure 5: Altitude profile of the PHOENIX mission Quantity Altitude Horizontal position Vertical velocity Horizontal velocity Accelerations Attitude Attitude rates
Accuracy 3% / 0.6 m 10 m 0.2 m/s 2.0 m/s 0.1 m/s2 0.3 ◦ 0.2 ◦/s
Sample rate 25 Hz 25 Hz 25 Hz 25 Hz 50 Hz 50 Hz 50 Hz
Coordinate system Altitude above ground Runway system Runway system Runway system Body system Body system Body system
Table 1: Requirements for the navigation system NAVIGATION CONCEPT It is obvious that the requirements listed in table 1 cannot be fulfilled by one single sensor. A combination of different sensors has been necessary to reach the required overall performance and for redundancy. In the following, the sensors applied to the PHOENIX navigation system are listed: • Embedded GPS/INS (EGI): As inertial navigation system the Honeywell H-764G INS/GPS system has been used. The system consists of an inertial navigation system (INS) and a GPS receiver. Three laser gyros as well as three accelerometers are part of an INS. Knowing the initial state one can compute attitude, velocity and position for every time by integration of the inertial measurements. The INS provides measurements with high sample rates and short latency. Another advantage is the
5
high reliability of such a system. The disadvantage of an INS is the bad long-time stability due to measurement errors in the inertial measurements such as bias, noise and quantization. Because of the integration, the errors sum up and cause a drift in the estimation of attitude, velocity and position. For this reason, the EGI provides not only the Pure Inertial navigation solution but also a blended GPS/INS solution. This solution does not fulfill the PHOENIX requirements and in contrast to the Pure Inertial solution it has the disadvantage that it could not be used for further processing in a navigation filter as it is a prefiltered navigation solution. For this reason, the Blended Solution has been used only for failure detection. The Pure Inertial solution also does not fulfill the accuracy requirements for velocity and position, but it can be used for sensor fusion and can be corrected by other measurements. The attitude estimation however is very precise and fulfills the accuracy requirements for the automatic landing even after a 3 hour mission. • Differential GPS (DGPS): The Parthus Sharpe XR6 DGPS receiver is a 12 channel C/A code, L1 frequency receiver and provides position measurements with a sample rate of 10 Hz. In the ideal case the receiver works in Real-Time Kinematic Mode (RTK) and the position error is only a few centimeters. This assumes a good visibility and distribution of the GPS satellites, mean accelerations and a good connection to the DGPS ground station. Due to the high latitude of the runway, but mainly due to the masking of the GPS antenna because of the helicopter, it has been assumed that the ideal conditions would not be reached for the PHOENIX mission. To analyze the behavior of the GPS receiver under different conditions the receiver has been tested in a GPS simulator. It has been shown that the accuracy of the horizontal position measurement is sufficient for the PHOENIX mission even with bad conditions like high acceleration and bad visibility of the GPS satellites. For the vertical position measurement the accuracy of the DGPS receiver is not enough. In addition, the DGPS provides the altitude above the WGS84 Earth ellipsoid. The altitude above ground has to be computed using a terrain model. Hence, the accuracy of the altitude above ground measurement also depends on the accuracy of such a model. • Radar altimeter: The Honeywell HG8500 radar altimeter provides altitude above ground measurements for a safe landing for altitudes lower than 1500 m. As the radar beam is sent over a large angle, always the shortest distance to ground is measured. In the normal case the accuracy is sufficient, but multipath effects can occur while in lower altitudes. The radar altimeter provides measurements with a sample rate of 25 Hz. • Laser ranger: In lower altitudes from about 200 m the LDM 300 C laser ranger supports the estimation of the altitude above ground. As the altitude is the most critical value, the laser ranger has been chosen for redundancy reasons. It can provide altitude measurements with very high accuracy if the radar altimeter fails. As
6
a laser beam is used for measurement, the laser ranger provides a distance to the ground along this beam. Hence the measurements do not only depend on the altitude but also on the attitude of the vehicle. The output sample rate of the laser ranger is 25 Hz. NAVIGATION FILTER For the fusion of the data from the different sensors, a navigation filter is needed. The main tasks of such a filter are: • Sensor data fusion and calculation of the optimal navigation solution • Estimation of non-measured values like attitude and velocity • Estimation of the state vector between the measurements The core of the navigation filter is an Extended Kalman-Filter. Using the knowledge about the dynamic behavior of the system, it is possible to integrate the measured accelerations and attitude rates and compute attitude, velocity and position. These are compared with the measured position from the DGPS, the radar altimeter and the laser ranger. To weight the different measurements, the Extended Kalman-Filter uses knowledge about the covariances of the sensor errors. The Extended Kalman-Filter has the following advantages: • Optimal estimation of the state vector • Altitude dependent weighting of the sensor measurements • Good behavior on sensor errors and sensor failure Open-Loop Kalman Filter For the PHOENIX navigation system an Inertial Navigation System (INS) has been used. In addition to the measurement of inertial accelerations and attitude rates, an INS also integrates the measurements to attitude, velocity and position. If an INS is used for coupled navigation, the problem occurs that the states of the INS are readable but it is not possible to correct them using external measurements. To solve this problem, a so-called Open-Loop Kalman-Filter has been used. The idea of the Open-Loop Kalman-Filter is to split the state in two parts. The first part is the state of the INS x˜ and the second part is the error of the INS ∆x. For small INS errors the differential equation describing the dynamics of the system can be written as x˙ = f (x) = x˙˜ + ∆x˙ = f (x˜ + ∆x) ∂ f (x) = f (x) ˜ + ∆x = f (x) ˜ + F (x) ˜ ∆x. ∂x
7
(1)
The nonlinear part is the differential equation of the INS state: x˙˜ = f (x) ˜ .
(2)
The differential equation of the INS error which is integrated in the Kalman-Filter is: ∆x˙ = F (x) ˜ ∆x.
(3)
To get the full state both parts are added: x = x˜ + ∆x.
(4)
This concept offers a couple of advantages: • The INS already has an algorithm for initialization. While the initial position comes from the GPS, the initial attitude is estimated by the measurement of the Earth attitude rate and the gravitation (Gyrocompass Alignment [2]). Using the Open-Loop Kalman-Filter, the initialization is done by the Gyrocompass Alignment algorithm of the INS. The initial value of the INS error is set to zero. There is no need for an initialization algorithm in the navigation filter. • The states of the INS are only read and need not to be changed. Only the INS error, which is estimated in the navigation filter, has to be corrected using additional measurements. • The error of the INS changes slowly. Fast dynamics based on external accelerations are integrated by the INS. So the Kalman-Filter can run with much slower sample rates than the INS itself. While the inertial measurements in the INS are processed with sample rates higher than 200 Hz, it is sufficient to run the navigation filter at a sample rate of 50 Hz. On the other hand, there is the disadvantage that the linearization is only valid for small INS errors. If the INS errors are too large, the Open-Loop Kalman-Filter can not work well. For the PHOENIX mission a maximum mission time starting from switching on the systems until the standstill on the runway of 2 hours has been assumed. It has been shown that for the INS, which has been used for the PHOENIX vehicle, the INS errors are small enough to justify the usage of the Open-Loop Kalman-Filter [5]. Due to the feedback of the gravitation, which depends on the estimated position, the vertical channel of an INS is naturally unstable. That is why an external altitude measurement is needed. For this, the INS contains a feedback loop for external barometric measurements. To estimate the states of the vertical channel with an Open-Loop KalmanFilter, the exact knowledge of the parameters of this feedback loop is needed which is not the case. In addition, the feedback loop contains an additional state which would degrade the quality of the estimation. Therefore, for the vertical channel (vertical velocity and altitude) one has decided that the measured accelerations are integrated in the navigation filter itself (Closed-Loop Kalman-Filter). The altitude and the vertical velocity from the INS are not used for navigation.
8
Numerical improvements During the development of the PHOENIX navigation filter problems arose due to numerical instabilities in the standard Kalman-Filter algorithms. The covariance matrix P of the estimated state xˆ is a symmetric positive definite matrix. For certain choices of the covariance matrix of the system’s input Q the matrix P was not positive definite any more due to the numerical resolution of a double precision variable. To improve the numerical stability of the navigation filter, the following algorithms have been used: • Scaling: The state vector x is scaled by a scaling matrix A in such a way that the scaled covariance matrix P∗ = A P A is well-conditioned. • Sequential update: If the measurement errors from the different sensors are uncorrelated, it is possible to process the measurements sequentially. Thus the matrix inversion can be avoided as only a scalar measurement is processed. In addition, the sequential processing of measurements has the following advantages: – Only sensors that provide a new measurement are used to correct the state estimation. The computational effort is reduced and the different sensors can work asynchronously and with different sample rates. – Problems and measurement failures can be traced back to a certain sensor. Due to this fact, sensors can be excluded from estimation update. – Only the parts of the measurement function h(x) and the measurement matrix H(x), that are needed for state correction, are computed. • UD factorization: The symmetric positive definite matrix P is splitted in an upper triangular unit matrix U and a diagonal matrix D such that P = U DU T . The Kalman-Filter algorithms for temporal update and state corrections are reformulated for the matrices U and D. In addition, an algorithm for the decomposition of the state covariance matrix P is needed [1]. Dynamic model The estimated state consists of the following quantities: • Velocity in the North-East-Down frame (NED). Horizontal velocity is estimated as error of the INS (Open-Loop Kalman-Filter). • Position as geodetic latitude φ , longitude λ and altitude h. Latitude and longitude are estimated as error of the INS (Open-Loop Kalman-Filter). • Attitude error between the NED frame estimated by the INS and the NED frame estimated by the navigation filter. The error can be described by three small angles εN , εE and εD . • Bias of the accelerometers in the body fixed frame bbACC . • Gyro drift in the body fixed frame bbGY RO .
9
The differential equation of the velocity in the NED frame can be written as: v˙n = T nb abi + gn − 2ω nie × vn − ω nen × vn − ω nie × (ω nie × rne ) − T nb bbACC − ani × ε n . | {z } | {z } | {z } | {z } | {z } | {z } |{z} Measured acceleration
Gravitation
Coriolis
Coriolis (Schuler)
Centripetal
ACC Bias
Attitude error
(5)
The position is calculated as φ˙ λ˙ = ˙h
1 RN +h
0 0
0 1 (RE +h) cos φ
0
0 vnN 0 vnE vnD −1
(6)
with the curvature radii of the Earth ellipsoid in north (RN ) and east (RE ) direction. Time correction of DGPS measurement The geodetic position of the DGPS is computed by the DGPS receiver using measured pseudoranges. Due to the computation time, a delay occurs between measurement and output. The delay is so large (about 80 ms) that the influence on the navigation solution can not be neglected as the vehicle moves during the time between measurement and output (about 10 m at maximum velocity). The delay is written out by the receiver. Therefore, the measurement can be corrected using the estimated velocity. Due to the short delay and the small position error compared to the Earth radius, the correction value can be computed from the delay time ∆T and the estimated velocity using the Euler equation: 1 0 0 ∆φ vnN RN +h 1 ∆λ = 0 vnE ∆T. (7) 0 (RE +h) cos φ n ∆h vD 0 0 −1 FLIGHT RESULTS To analyze the performance of the navigation filter, different approaches have been used. First of all, there is no reference trajectory to compare the estimated navigation solution to. To analyze the behaviour of the position sensors, the different altitude measurements have been compared and the resulting errors have been checked with the expected covariances. Another method to analyze the performance of the navigation filter is the analysis of the residues of the different position sensors. In the time domain they have been compared to the assumed covariances. In the frequency domain modeling errors can be identified using the power spectral density of the residues. To test the performance of the navigation filter in case of sensor failures, simulations have been carried out using flight data to show the capability of the filter to handle sensor failures and to provide a navigation solution which fulfills the requirements for a save landing.
10
50
0
−5
−15 4750
4760
4770
Standstill
−10
4780 4790 Time [s]
4800
20 10 0 −10 −20 −30 −40
4810
4820
−50 4720
4730
4740
4750
Touchdown
5
30
Flare initiation
Comparision of measurements from DGPS and RA [m]
10
∆h Covariance DGPS Covariance RA Combined Covariance DGPS + RA
40
4760
4770 4780 Time [s]
Standstill
∆h Covariance LR Covariance RA Combined Covariance LR + RA
Touchdown
Comparision of measurements from LR and RA [m]
15
4790
4800
4810
4820
Figure 6: Comparison of altitude measurements Comparison of altitude measurements In figure 6 the comparison of the laser ranger and the radar altimeter measurement (on the left) and the comparison of the DGPS altitude and the radar altimeter measurement (on the right) are shown. All measurements are converted to the altitude of the center of mass (CoM) above the WGS84 ellipsoid. By subtracting the measurements from each other, the sum of the measurement errors is obtained. In addition, the covariances of the sensors as well as the combined covariance of both measurements are plotted as 3σ values. The altitude dependent covariances are the values taken from the sensor data sheets and passed to the Kalman-Filter to weight the different measurements. Figure 6 shows that the errors lie well within the 3σ boundaries of the combined covariance. Actually, in most cases the errors are much smaller than the 3σ boundary. That reveals that the values for the covariances have been chosen too conservative which means the sensors provide a better accuracy than assumed. Furthermore, the differences between the laser ranger and the radar altimeter measurements are much smaller than the differences between the DGPS and the radar altimeter measurements. Both laser ranger and radar altimeter measure the altitude above ground while the DGPS measures the altitude above the WGS84 ellipsoid. Therefore, the biggest part of the error between DGPS and radar altimeter measurement is not a measurement error of one of the sensors but an error in the terrain model describing the altitude of the ground above the WGS84 ellipsoid. Analysis of the residues in the time domain Another possible method to analyze the performance of the navigation filter is the analysis of the residues in the time domain. As an example in figure 7 (left plot) the residues of the altitude measurements of the DGPS in addition to the covariances of the measurement, of the filter and the combined covariance of both are shown. For the accuracy of the DGPS
11
15
15
∆h Covariance Filter Covariance DGPS Combined Covariance
10
DGPS Residues Altitude [m]
DGPS Residues Altitude [m]
10
5
0
−5
−10
5
0
−5
−10
−15 3200
∆h Covariance Filter Covariance DGPS Combined Covariance
−15 3400
3600
3800
4000 4200 Time [s]
4400
4600
4800
5000
3200
3400
3600
3800
4000 4200 Time [s]
4400
4600
4800
5000
Figure 7: Residues of DGPS altitude measurement before and after adaption of covariance matrices altitude measurement a covariance of 9 m (3σ ) has been assumed. The covariance of the residues S is the combination of the covariance of the filter P and of the measurement R S = R + H P HT
(8)
with the measurement matrix H. Obviously, the residues are much smaller than their covariance. The assumed covariance of the DGPS measurement has been chosen too large, the accuracy of the DGPS altitude measurement is far better than assumed. In a post-flight simulation the covariances of the measurements have been adapted. For the DGPS the self-assessment of the DGPS receiver has been used as measurement covariance for the navigation filter. The right plot in figure 7 shows that the residues of the DGPS altitude measurement are smaller now, the navigation filter provides a more accurate navigation solution. Analysis of the residues in the frequency domain To identify modeling errors, the residues can be analyzed in the frequency domain. In the ideal case the power spectral density (PSD) of the residues is constant for all frequencies [1]. In figure 8 the PSD of the DGPS residues for the altitude and longitude measurements are shown. In both plots considerable peaks can be seen at 1 Hz and multiples. Taking a closer look at the time signal, these frequencies can also be recognized as peaks with a maximum height of about 0.4 m. To analyze this unexpected behaviour, the time dependency of the 2 Hz line has been calculated and plotted in figure 9 (spectrogram). Apparently, the oscillations are not constant over time but show considerable maximums and minimums. Furthermore, the minimums in the longitude coincide with the maximums in the latitude and vice versa. The plot of the flight path azimuth χ (also figure 9) reveals that the maximums of the 2 Hz line in the residues of the latitude coincide with the north-south direction of the
12
10
−120
0
−130
Power/Frequency (dB/Hz)
Power/Frequency (dB/Hz)
−10 −20 −30 −40 −50 −60
−140 −150 −160 −170 −180
−70 −190
−80 −90
0
0.5
1
1.5
2
2.5 3 Frequency (Hz)
3.5
4
4.5
−200
5
0
0.5
1
1.5
2
2.5 3 Frequency (Hz)
3.5
4
4.5
5
Figure 8: Power spectral density of the DGPS altitude and longitude measurements
Lat. Lon. Alt.
sin2(χ)
Power/Frequency at 2Hz [m 2/Hz]
0.1
0
1 sin2(χ)
3600
3800
4000
4200
4400 Time [s]
4600
4800
5000
0.5
0 5200
Figure 9: Spectrogram of the 2 Hz line compared to flight path azimuth velocity vector, the maximums of the 2 Hz line in the residues of the longitude coincide with the east-west direction of the velocity vector. In conclusion, the disturbance only occurs in the direction of the flight path velocity. Furthermore, the absolute value of the disturbance is proportional to the absolute value of the flight path velocity. It is also noticeable that the disturbance occurs at the exact frequency of 1 Hz and multiples. This points to a timing problem in the onboard computer rather than an external cause or a modeling error. To further investigate the problem, the difference between the time tags of two consecutive DGPS measurements have been analyzed (figure 10).
13
105 104 103
∆TDGPS [ms]
102 101 100 99 98 97 96 95 3752
3754
3756
3758
3760 Time [s]
3762
3764
3766
Figure 10: Sample rates of the DGPS It can be seen that the measurements of the DGPS have not been recorded at equal distances. Jumps in the sample rate occur with a regularity of 1 Hz. The dependency of the disturbance signal from flight path velocity and from irregularities in the sample rate of the DGPS indicates a problem in the time correction of the DGPS. That is to say the time correction depends on the estimated velocity and the time tag of the DGPS. Actually, the disturbance vanishes if the time correction is not applied. But this also degrades the accuracy of the navigation solution. The occurrence of the frequency peaks can be explained as follows: the measurements of the DGPS are tagged with a time tag at the moment when they are retrieved by the onboard computer. This is not necessarily the time when the DGPS provides the measurement. The onboard computer works with a real-time operation system. If a task of the real-time system with a sample rate of 1 Hz is called before the task which fetches the measurement, the observed fluctuations in the time tag of the DGPS measurement occur. The second point, that argues for that explanation, is the fact that the fluctuations in the time-tags (about 8 ms) multiplied by the velocity during the captive flight (about 50 m/s) coincide with the peaks in the time signal of the residues (about 0.4 m). Concluding, the reason for the problem is as follows: the time-tags do not mark the time when the DGPS provides the measurement but mark the time when the measurement is fetched by the onboard computer. Although the small fluctuations of some milliseconds are only a fraction of the sample time of the navigation filter, the errors can be larger than the accuracy requirements. Sensor failure scenarios It was required that the navigation filter should provide a navigation solution accurate enough for a safe landing even in case of sensor failures. During the 3 test flights of PHOENIX all sensors worked properly so the case of a sensor failure did not happen during real flight. To test the capability of the navigation filter to handle sensor failures and to check the achieved accuracy, post-flight simulations have been carried out using
14
sensor data recorded during the test flights with simulated sensor failures. The navigation solution can be compared to the solution computed by the navigation filter without sensor failure. Figure 11 shows the estimation error of the position for a DGPS failure directly after the release of PHOENIX from the helicopter. It can be seen that the error along the runway (XRW direction) is 7 m, the error perpendicular to the runway (YRW direction) is 2 m at most. The required accuracy is 100 m in runway direction and 10 m perpendicular to the runway. Looking at the estimation error, the navigation system is likely to fulfill the requirements for the accuracy of the horizontal position during the complete flight. 8 ∆h Residues LR Accuracy requirement
6
Altitude estimation error in case of DGPS failure [m]
Horizontal estimation error in case of DGPS failure [m]
6
4
2 ∆XRW ∆YRW 0
−2
−4
4
2
0
−2
−4
−6 −6 4700
4720
4740
4760 Time [s]
4780
4800
4820
4700
4720
4740
4760 Time [s]
4780
4800
4820
Figure 11: Estimation error in case of DGPS failure Figure 11 also shows the difference between the two navigation solutions (with and without DGPS) in the vertical axis as well as the accuracy requirement. Taking only this difference as measure, the requirement is not fulfilled while flying in lower altitudes. But as the requirement refers to an altitude above ground, it makes more sense to have a look on the residues of a terrain based altitude sensor like the laser ranger (also shown in figure 11). In case of a DGPS failure, the navigation filter orientates itself toward the measurement of the radar altimeter and the laser ranger. That is the reason why the residues of the laser ranger are smaller than its residues during a simulation with working DGPS. Furthermore, the residues consist not only of the estimation error of the KalmanFilter but also of the measurement error of the sensor, which is very large at the beginning of the laser ranger measurement due to the high altitudes. If it is subtracted from the residues it appears that the estimation error is within the requirements for all altitudes and a save landing is possible even in case of a DGPS failure. Figure 12 shows the altitude estimation error in case of a laser ranger failure and in case of failure of both terrain based sensors. For the simulation of the failure of the laser ranger only it can be seen that the errors of the altitude estimations are still within the accuracy requirements. In case of failure of the terrain based sensors, the Kalman-Filter has to rely completely on the altitude measurement of the DGPS. The computation of the altitude above ground can only be done using the terrain model. Due to the inaccuracies
15
2 Estimation error in case of failure of terrain based position sensors [m]
1.5 ∆h Accuracy requirement
Estimation error in case of LR failure [m]
1
0.5
0
−0.5
−1
−1.5 4750
4760
4770
4780 4790 Time [s]
4800
4810
4820
∆h Accuracy requirement 1.5
1
0.5
0
−0.5
−1
−1.5
−2 4720
4730
4740
4750
4760
4770 4780 Time [s]
4790
4800
4810
4820
Figure 12: Estimation error in case of LR and RA failure of this model, the results are not sufficient for a safe landing. Looking at the residues of the DGPS, it can be seen the DGPS is able to measure the altitude above the WGS84 Earth ellipsoid with sufficient accuracy. The terrain height has to be measured with high precision before flight to obtain sufficiently accurate estimations of the altitude above ground. This could be done using the mobile DGPS receiver and the DGPS ground station. In general, it can be stated that the navigation filter is capable to guarantee a safe landing even in case of failure of one position sensor. It also would be possible to land with only one altimeter and without DGPS. Due to the large inaccuracies in the terrain model a safe landing with DGPS alone would not have been possible. SUMMARY PHOENIX is an experimental vehicle to demonstrate the autolanding capabilities of a possible Reusable Launch Vehicle which has been flown in May 2004. As the shape of PHOENIX has been designed for re-entry, the dynamics of the vehicle are very high. To control such a vehicle demanding requirements for a navigation system had to be fulfilled. This could not have been done by a single sensor. For PHOENIX several sensors have been used including DGPS, INS, radar altimeter and laser ranger. A navigation filter had to be designed for sensor fusion, estimation of non-measured values and failure detection. To include pre-integrated values from an Inertial Navigation System, an Open-Loop Kalman-Filter has been used as core of the navigation filter. Numerically improved algorithms have been included to overcome problems with numerical instabilities. To show the performance of the navigation filter, the altitude measurements from the different sensors have been compared and the residues have been analyzed. Both analyses show that the assumed covariance matrices have been chosen too conservative for most sensors. Choosing more realistic values for the covariance matrix can improve the accuracy of the navigation solution. During the analysis of the residues in the frequency domain unexpected peaks in the spectrum have been identified as timing problem in the
16
real-time operation system while recording the correct time tag of the DGPS measurements. To analyze the behaviour of the navigation filter in case of sensor failures, several simulations have been done. It has been shown that the navigation solution fulfills the requirements for a safe landing even in case of the failure of one sensor. It is also possible to perform a safe landing with one altimeter alone. Due to the large inaccuracies in the terrain model, the navigation solution using DGPS as single position sensor is not accurate enough. OUTLOOK To analyze whether the navigation system is capable to fulfill the requirements for all mission phases like start, ascent, orbit phase and re-entry, a mission profile and an advanced simulator for all phases has to be designed. The simulator is also necessary to decide if it makes sense to estimate the errors of the inertial sensors. The use of the WGS84 coordinate system and the use of the Euler angles is predetermined by the navigation coordinate system of the INS. Disadvantages are singularities especially for spacecrafts. The usage of a more suitable coordinate system would imply the usage of another inertial navigation system. Due to the linearization errors of the Open-Loop Kalman-Filter, it would make sense to directly integrate the inertial measurements in a Closed-Loop Kalman-Filter. This is more accurate but also more intricate as higher sample rates and initialization algorithms are needed. Again, this would also imply the usage of another inertial navigation system or an inertial measurement unit. By recording the GPS raw data (carrier and code phase) it would be possible to generate a very accurate reference trajectory as improved ephemeris data of the GPS satellites are available after the flight. A more precise measurement of the terrain especially the height of the runway is a must to be able to use the DGPS as redundant altitude sensor. ACKNOWLEDGMENTS The project PHOENIX has been financed by the German Aerospace Agency (DLR) and the Bremen Federal State. The design of the navigation filter concept, the development and the implementation of the algorithms as well as the analysis of the flight data were carried out at the Center for Applied Space Technology and Microgravity (ZARM) within a dissertation project. REFERENCES [1] Mohinder S. Grewal and Angus P. Andrews. Kalman Filtering - Theory and Practice using MATLAB. John Wiley & Sons, Second edition, 2001. [2] Mohinder S. Grewal, Lawrence R. Weill, and Angus P. Andrews. Global Positioning Systems, Inertial Navigation and Integration. John Wiley and Sons, Inc., 2001.
17
[3] M. Schlotterer and S. Theil. Numerical Improvements of Navigation Algorithms for RLV Demonstrator. In 53rd International Astronautical Congress - The World Space Congress 2002, Houston, Texas. IAF, October 2002. [4] M. Schlotterer, S. Theil, M. Wiegand, S. Voegt, B. Lübke-Ossenbeck, and L. Peters. Navigation System for Auto-Landing of RLV. In 52nd International Astronautical Congress, Toulouse, France. IAF, October 2001. [5] Markus Schlotterer. Robuste Schätzung und Sensorfusion zur Navigation von wiederverwendbaren Raumtransportern. PhD thesis, Universität Bremen, Fachbereich Produktionstechnik, 2008. [6] S. Voegt, M. Tava, and M. Schlotterer. The PHOENIX Navigation System for Automatic Landing. In 10th Saint Petersburg International Conference on Integrated Navigation Systems, Saint Petersburg, Russia, May 2003.
18