Cairney et al. BMC Pediatrics (2016) 16:42 DOI 10.1186/s12887-016-0577-y
RESEARCH ARTICLE
Open Access
Evaluation of the revised Nipissing District Developmental Screening (NDDS) tool for use in general population samples of infants and children John Cairney1,2,3*, Jean Clinton2,4, Scott Veldhuizen1, Christine Rodriguez1, Cheryl Missiuna3,6, Terrance Wade7, Peter Szatmari8,9 and Marilyn Kertoy10
Abstract Background: There is widespread interest in identification of developmental delay in the first six years of life. This requires, however, a reliable and valid measure for screening. In Ontario, the 18-month enhanced well-baby visit includes province-wide administration of a parent-reported survey, the Nipissing District Developmental Screening (NDDS) tool, to facilitate early identification of delay. Yet, at present the psychometric properties of the NDDS are largely unknown. Method: 812 children and their families were recruited from the community. Parents (most often mothers) completed the NDDS. A sub-sample (n = 111) of parents completed the NDDS again within a two-week period to assess test-retest reliability. For children 3 or younger, the criterion measure was the Bayley Scales of Infant Development, 3rd edition; for older children, a battery of other measures was used. All criterion measures were administered by trained assessors. Mild and severe delays were identified based on both published cut-points and on the distribution of raw scores. Sensitivity, specificity, positive and negative predictive values were calculated to assess agreement between tests. Results: Test-retest reliability was modest (Spearman’s rho = .62, p < 001). Regardless of the age of the child, the definition of delay (mild versus severe), or the cut-point used on the NDDS, sensitivities (from 29 to 68 %) and specificities (from 58 to 88 %) were poor to moderate. Conclusion: The modest test-retest results, coupled with the generally poor observed agreement with criterion measures, suggests the NDDS should not be used on its own for identification of developmental delay in community or population-based settings.
Background The first six years of life are the crucial period of human development, and there is broad consensus that investment in optimizing health and development in this period will result in significant individual, social and economic benefits [1]. Results from developmental neuroscience suggest that both prevention and treatment efforts need to occur as early in this period as possible,
* Correspondence:
[email protected] 1 Department of Family Medicine, McMaster University, 175 Longwood Road South, Suite 109A, Hamilton, ON L8P 0A1, Canada 2 Offord Centre for Child Studies, McMaster University, Hamilton, ON, Canada Full list of author information is available at the end of the article
as treatment later in life may be less effective in preventing poor outcomes [2, 3]. Developmental delay is one target for early identification and intervention. While the prevalence of global delay in children under 6 is between 1 and 3 % [4], 12 to 16 % of children show meaningful delay in one or more cognitive, motor, language, and socioemotional areas [5–7]. Such delays are associated with increased risk of future physical and mental health problems and with poor functional and educational outcomes later in life [8, 9]. Early intervention requires early identification. The detection rate of developmental delay in clinical settings,
© 2016 Cairney et al. Open Access This article is distributed under the terms of the Creative Commons Attribution 4.0 International License (http://creativecommons.org/licenses/by/4.0/), which permits unrestricted use, distribution, and reproduction in any medium, provided you give appropriate credit to the original author(s) and the source, provide a link to the Creative Commons license, and indicate if changes were made. The Creative Commons Public Domain Dedication waiver (http://creativecommons.org/publicdomain/zero/1.0/) applies to the data made available in this article, unless otherwise stated.
Cairney et al. BMC Pediatrics (2016) 16:42
however, is well below the estimated prevalence [10]. Systematic screening provides a possible solution, but requires measures that are cost-effective, easily administered, reliable, and valid. These requirements are exacting, given the complexities of measuring development in early childhood [11]. While early screening and surveillance is recommended by many professional organizations [5, 10], and has been implemented in many countries, there is no consensus on the instruments to be used. The Nipissing District Developmental Screening tool (NDDS), is increasingly used for this purpose in Canada [12, 13] and the United States (e.g., Early Head Start Program: http://www.nemcsa.org/headstart/ECDHS_A.aspx). The NDDS was first developed in 1993, and its content and design were revised in 2011. It comprises 13 age group-specific parent-completed checklists of developmental milestones for children between 1 month and 6 years of age. In Ontario, the NDDS is one of the recommended measures to be used during the recently-implemented enhanced 18-month well-baby visit [14, 15], a population-wide, comprehensive developmental assessment and parenting education session connected to the 18-month immunization visit. In Ontario, the government has paid to provide free access to the NDDS to all parents. Despite its increasing use, the psychometric properties of the NDDS are largely unknown; we could locate only three reports, two of them unpublished, and all limited by small samples [16–18]. Only Currie et al. [16] evaluated the current version of the NDDS, and this was a pilot study of 31 children, only 4 of whom met criteria for mild developmental delay. The psychometric properties of the NDDS have not therefore been assessed with an adequate sample.
Methods Sample
We recruited a sample of participants from community organizations who provide services to families in Hamilton, Ontario and surrounding areas and which targeted sociodemographically diverse populations. Organizations included Ontario Early Years Centres and Parent and Family Literacy Centres. Staff of some organizations shared information about the study with their clients, and some referred families directly. We also used recruitment posters and notices on web sites, and operated a booth at the Hamilton Baby and Toddler Expo, which is well-attended by families from Hamilton and surrounding areas. Families were recruited between May 2010 and October 2011. Parents were eligible if they could speak and read English, and were the child’s primary caregiver and legal guardian. We aimed to recruit 50 children for each of the NDDS’s 10 age bands up to 36 months (group A;
Page 2 of 8
n = 500) and 100 in each of the remaining 3 age bands (4 to 6 years of age; group B; n = 300), for a total of 800 children across all 13 age bands. Child age was adjusted for prematurity if the child was under 2 years and born 4 weeks or more prematurely. Study design
We randomly selected 111 (14 %) participants to complete the NDDS a second time after an interval of 2 weeks, and 55 (7 %) to complete a qualitative interview. Criterion measures were administered by research assistants, all of whom had an undergraduate or Master’s degree (e.g., psychology, health sciences). RAs received a minimum of 8 h of pre-test administration training and at least 10 h of supervised test administration experience prior to being able to conduct independent assessments. Assessment reports were monitored continuously for quality assurance throughout the study. We received ethical approval from the McMaster University Research Ethics Board, and all parents provided informed, written consent. Parent-completed measures Nipissing district developmental screen-2011
The NDDS-2011 asks parents to indicate whether they have observed their child performing various motor, cognitive or language tasks. There are separate checklists for each of 13 age groups. The checklist for infants under 1 month old includes 4 items, while others include between 12 and 22 items. Milestones not yet observed by the caregiver are counted to produce a score. Current recommendations are for a health professional to follow up with any scores of 1 or higher. Before the 2011 revision, a cut-point of 2 or higher was used [12, 17]. As the proportion of children identified at the 1+ threshold may be too large for some situations, we also explored the performance of the NDDS at the 2+ cut-point. Criterion measures
As there is no single gold standard for assessing development in children, we designed a protocol using widely-used instruments with demonstrated reliability and validity. Given the broad age range covered by the NDDS, it was not possible to use the same criterion measure for all children. For children 3 years and under (Group A), we used the Bayley Scales of Infant Development, 3rd Edition (BSID-III; 19). The BSID-III produces a set of raw and normal scores for each of five domains: Cognition, receptive communication, expressive communication, fine motor, and gross motor. We identified as “mildly delayed” those children who scored below the “borderline” cut-point in one or more domains, and as “severely delayed” those with at least
Cairney et al. BMC Pediatrics (2016) 16:42
one score below the “extremely low” cut-point according the manual [19]. For children aged 4 to 6 (Group B), we selected three separate measures assessing development in motor coordination, cognition, and language: the Movement Assessment Battery for Children, 2nd Edition (M-ABC; 20); the Kaufman Brief Intelligence Test, 2nd Edition (KBIT-2) [20]; and the Pre-school Language Scale, 4th edition (PLS-4) [21, 22], respectively. The M-ABC [20], PLS-4 [21], and KBIT-2 [23] have all shown good agreement with clinical evaluation and with other instruments. Children were identified as having “mild” or “severe” delay by using the 15th and 5th percentile cutpoints on each instrument. The M-ABC does not provide a 15th percentile cut-point; instead, the 16th percentile is recommended [20]. The K-BIT produces a standard score with a mean of 100 and an SD of 15. We therefore used cut-points of 84.5 and 75, which correspond to the 15th and 5th percentiles. On the BSID-III, the published “borderline” cut-points produced a prevalence of 27 % in children under 1 and of only 5 % in those aged 2 or 3. It is unlikely that this reflects genuine variation within our sample, as we drew on the same sources to recruit all participants. Concerns over published BSID-III norms have also been raised previously [24]. We therefore produced a second set of classifications (i.e., cut-points to classify mild and severe delay) based on the distributions of raw scores. We repeated this process for the PLS-4, as the norms for this instrument identified only a single “case”. The K-BIT and M-ABC produced plausible prevalence’s, based on the literature, that did not vary markedly with child age. To produce distribution-based indicators of caseness, we used quantile regression, with the scale score as the outcome and fractional polynomial transformations of age as the independent variables. These models yield equations that can be solved at any child age to calculate a cut-point at the designated quantile. For the BSID-III, we fit two models for the raw score of each subscale: One corresponding to the “borderline” (−1.33 SDs; 9.2nd percentile) and one to the “extremely low” (−2 SD; 2.275th percentile) cut-point. For the PLS-4, to be consistent with other measures used for older children, we estimated cut-points at the 5th and 15th percentiles. To do this analysis, we used the xmfp Stata program by Royston [25]. Statistical analysis
We measured test-retest reliability by calculating Spearman correlations for total scores and kappa statistics for agreement using scores of 1 and 2 as cut-points. We compared the NDDS with the criterion measures by calculating sensitivity, specificity, positive predictive value (PPV) and negative predictive value (NPV), along
Page 3 of 8
with exact binomial 95 % confidence intervals. We used Stata 13 for all analyses [26].
Results We received initial referrals for 1012 parent–child pairs and have final data for 812: 594 children aged 1 month to 36 months (Group A) and 218 children aged 4 to 6 years (Group B). This represents an 80.2 % response rate from the total sample of referrals, and an 83.8 % response from eligible families. Figure 1 shows the stages of recruitment, participant exclusions, and consent rate. Parent demographics are shown in Table 1. In 98 % of cases, the NDDS was completed by the child’s biological mother, and the 812 child-parent pairings were drawn from 572 families. The number of children in each NDDS age band varied from 41 to 98. Test-retest reliability
Test-retest reliability after a two-week delay was moderate (Spearman’s rho = 0.61, p < 0.001), as was agreement at specific cut-points (at the 1+ cut-point, kappa = 0.59; 2+, kappa = 0.57). 86 of 111 (78 %) retests produced the same result as the initial screen; of the remainder, 15 (14 %) scores decreased and 10 (9 %) increased. The difference between the proportions increasing and decreasing was not significant (exact binomial p = 0.42). Criterion validity
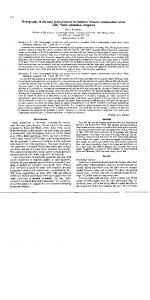
We fit models to identify distribution-based cut-points for the BSID-III and PLS-4. In both cases, these resulted in higher prevalence than those derived using the published norms, and in prevalences that did not vary substantially with child age. Results of this analysis are illustrated in Fig. 2, which shows ‘borderline’ cases on the expressive communication subscale of the BSID-III according to the published cut-points (crosses) and according to our distribution-based model (all those below the regression line). Similar results were obtained for the other BSID-III subscales and for the PLS-4. Group A (children 1 month to 3 years of age)
103 of 594 children (17.3 %) scored in the “borderline” range in one or more BSID-III domains. At the recommended 1+ cut-point (i.e., one or more “no” responses on the NDDS), the sensitivity of the NDDS was 59 % and the specificity 67 %. 17 children (2.9 %) scored in the “extremely low” range in at least one domain, and the sensitivity and specificity in this case were 65 % and 63 %, respectively (see Table 2). Using distribution-based cut-points produced generally poorer agreement. 175 children (29 %) were below the “borderline” cut-point in at least one domain. For this outcome, the sensitivity of the NDDS at the 1+ cutpoint was 50 % and the specificity 68 %. 45 children
Cairney et al. BMC Pediatrics (2016) 16:42
Page 4 of 8
Fig. 1 Participant flow diagram
(7.6 %) were below at least one “extremely low” cutpoint. The sensitivity and specificity in this case were 60 % and 64 %, respectively (see Table 2). Group B (children 4 to 6 years of age)
Seven children (3.2 %) had incomplete or invalid results on one or more instruments, and were excluded from the analysis. Of the remaining 211 children, 40 (19 %) met norms-based criteria for mild delay. At the 1+ cutpoint, the NDDS had a sensitivity of 68 % and a specificity of 63 %. For the adjusted outcome, there were 57 cases (27 %). Sensitivity was 60 % and specificity 63 %.
Twelve children (5.7 %) met norms-based criteria for severe delay. The sensitivity of the NDDS was 67 % and the specificity 58 %. Using the adjusted measure produced a prevalence of 8.1 % (17 of 211), a sensitivity of 65 %, and a specificity of 59 % at the 1+ cut-point on the NDDS; (see Table 3). For severe delay, all PPVs were under 20 %, implying a low probability that a child with a positive screen will meet reference criteria. In keeping with the higher prevalence, PPVs for moderate delay were higher, but still under 50 %. Using the alternative 2+ cut-point raised specificities to 81 %-84 %, but reduced sensitivities to 33 %-50 %.
Cairney et al. BMC Pediatrics (2016) 16:42
Page 5 of 8
Table 1 Sample Description Group A
Group B
Total
594
218
812
Female
586 (99 %)
213 (98 %)
799 (99 %)
Male
8 (1 %)
4 (2 %)
12 (1 %)
137 (23 %)
42 (20 %)
179 (22 %)
Own
449 (76 %)
171 (80 %)
620 (77 %)
Other (eg, lives with family)
3 (1 %)
1 (