Oct 10, 2016 - the tested vehicles indicating increases of test mass and road load from NEDC to ..... free gear shift strategy is allowed, as long as the requirement of sufficient ..... TNO used this tool also when the testing programme was.
Earth, Life & Social Sciences Van Mourik Broekmanweg 6 2628 XE Delft P.O. Box 49 2600 AA Delft The Netherlands
TNO report TNO 2016 R11285
www.tno.nl
NEDC - WLTP comparative testing
T +31 88 866 30 00
Date
10 October 2016
Author(s)
Norbert E. Ligterink Pim van Mensch Rob F.A. Cuelenaere
Copy no Number of pages Number of appendices Sponsor
2016-TL-RAP-0100300211 29 -
Project name Project number
Dutch Ministry of Infrastructure and the Environment PO Box 20901 2500 EX THE HAGUE The Netherlands NEDC-WLTP correlatie 060.20569
All rights reserved. No part of this publication may be reproduced and/or published by print, photoprint, microfilm or any other means without the previous written consent of TNO. In case this report was drafted on instructions, the rights and obligations of contracting parties are subject to either the General Terms and Conditions for commissions to TNO, or the relevant agreement concluded between the contracting parties. Submitting the report for inspection to parties who have a direct interest is permitted. © 2016 TNO
TNO report | TNO 2016 R11285 | 10 October 2016
2 / 29
Samenvatting In de aanloop naar de nieuwe typekeuringsprocedure voor het bepalen van de fabrieksopgave van de CO2-emissies, de WLTP (World Harmonised Light-duty Test Procedures), heeft TNO in opdracht van het ministerie van Infrastructuur en Milieu de voorstellen voor WLTP typekeuringsprocedures vergeleken met de bestaande NEDC typekeuringsprocedure. Daartoe zijn in de afgelopen jaren in totaal veertien personenauto’s getest zowel op de huidige NEDC test als op een voorlopige versie van de WLTP test. Dit rapport geeft een overzicht van alle resultaten met betrekking tot de verschillen en overeenkomsten in de CO2-emissies in de twee testen aan dezelfde voertuigen. De tests waren veelal onderdeel van een breder testprogramma naar het emissiegedrag van moderne personenauto’s. De tests zijn zo ingericht dat onderscheid kon worden gemaakt tussen de invloed van veranderingen in de emissietest op de rollenbank in het laboratorium en veranderingen in de instellingen van de rollenbank. Veranderingen in de emissietest zelf, zoals de lengte van de test en het ritpatroon geven in totaal slechts een klein verschil in CO2-emissies tussen de NEDC test en de WLTP test, doordat de belangrijkste effecten elkaar grotendeels compenseren. Deze effecten omvatten de bijdrage van de koude start van de motor, de veranderde schakelstrategie in de WLTP voor auto’s met een handgeschakelde transmissie en de inperking van de mogelijkheid om vooraf aan de test de accu volledig op te laden. De inschattingen van de instellingen van de rollenbank lopen uiteen en blijken van grote invloed te zijn op de gemeten CO2-emissies. De autofabrikanten verwachten dat de testmassa en de rijweerstand van auto’s door de wijzigingen in de WLTP met respectievelijk zo’n 20% en 50% zullen toenemen ten opzichte van de NEDC. Dit zou resulteren in 15-20 g/km hogere CO2-emissies. Als meer realistische uitgangspunten worden gehanteerd van 10% toename van de testmassa en 20% toename van de rijweerstand, dan zal het verschil tussen WLTP en NEDC CO 2emissie zelden meer dan 10 g/km bedragen. De uiteindelijke waarden van testmassa en rijweerstand zullen pas bij de invoering van de WLTP in 2017-2018 beschikbaar komen. Een opvallend resultaat van het testprogramma is dat de CO2-emissie van een onafhankelijke, volgens de procedures uitgevoerde NEDC test over het algemeen 20 g/km hoger uitvalt dan de opgegeven NEDC typekeuringswaarde. Dit verschil is alleen het effect van de emissietest. Bovenop dit verschil moet nog een effect van de typische lagere massa en rijweerstand, bepaald in een aparte uitroltest, in de NEDC test opgeteld worden.
TNO report | TNO 2016 R11285 | 10 October 2016
3 / 29
Summary Prior to the determination of the new type-approval test procedure, the WLTP (World Harmonized Light-duty Test Procedures), TNO has carried out side-by-side testing of 14 passenger cars on the current type-approval test procedure, the NEDC and the WLTP in its different stages of fixation. The tests were carried out in the period 2014-2016 at the request of the Dutch ministry of Infrastructure and the Environment and were aimed at exploring the impact of changes in the test procedures. The tests were often part of a more elaborate test programme which examined different aspects of the emission performance of these vehicles. This report summarizes and compares the CO2 emissions on the different tests of the same vehicles. The test programme was specifically designed to isolate the impact of changes in the emission test on the chassis dynamometer in the lab from changes in the settings of the chassis dynamometer. Changes in the emissions test as such, in particular the length of the test and the driving cycle, contribute only marginally to differences in CO 2 emissions results between NEDC and WLTP tests. The effects of the major changes, related to e.g. cold start contributions, gear-shift strategies, and battery charging prior to the test, almost cancel each other out. Estimations of changes with the pending introduction of the WLTP to the settings of the chassis dynamometer strongly deviate, but turn out to have a substantial impact on the measured CO2 emissions. The car manufacturers provided estimations for the tested vehicles indicating increases of test mass and road load from NEDC to WLTP of respectively 20% and 50%, that would result in 15-20 g/km higher CO2 emissions. If more realistic values of 10% test mass increase and 20% road load increase are applied the difference between NEDC and WLTP CO2 emissions will seldom exceed 10 g/km, Only with the introduction of the WLTP type-approval in 2017-2018 the actual figures of test mass and road load will become available. A striking result of the test program is the large and systematic deviation between the CO2 emissions obtained by independent tests following the official NEDC procedures and the officially reported NEDC type-approval CO2 emissions. The difference is 20 g/km on the chassis dynamometer emission tests alone. The effect of the low rolling resistance, determined in a separate coast-down test, and test mass on the NEDC must be added to this difference.
TNO report | TNO 2016 R11285 | 10 October 2016
4 / 29
Contents Samenvatting ........................................................................................................... 2 Summary .................................................................................................................. 3 1
Introduction .............................................................................................................. 5
2
WLTC driving cycle ................................................................................................. 7
3
Engine work and CO2 emissions ........................................................................... 9
4 4.1 4.2 4.3 4.4 4.5 4.6
Differences in test conditions and settings ........................................................ 11 Start conditions ........................................................................................................ 11 Test mass and inertia settings ................................................................................. 11 Road load settings ................................................................................................... 13 WLTP versus NEDC road load determination ......................................................... 14 Gear selection .......................................................................................................... 15 Electric equipment and use ..................................................................................... 16
5 5.1 5.2 5.3 5.4 5.5 5.6 5.7 5.8 5.9 5.10 5.11 5.12 5.13 5.14 5.15
Vehicle tests ........................................................................................................... 17 BMW 320d automatic transmission in two model versions, diesel .......................... 18 VW Passat cc diesel ................................................................................................ 19 Mazda CX5 diesel.................................................................................................... 19 Opel Zafira diesel in two model versions ................................................................. 19 Peugeot 208 diesel .................................................................................................. 20 Mercedes-Benz C220 diesel automatic transmission ............................................. 20 AUDI Q7 diesel ........................................................................................................ 21 BMW 530 xd diesel .................................................................................................. 21 Ford Focus diesel .................................................................................................... 21 Renault Megane diesel ............................................................................................ 21 VW Golf diesel ......................................................................................................... 22 Smart gasoline automatic transmission ................................................................... 22 Peugeot 508 petrol .................................................................................................. 22 VW Polo diesel ........................................................................................................ 24 Overview .................................................................................................................. 24
6
Conclusions ........................................................................................................... 26
7
Signature ................................................................................................................ 29
TNO report | TNO 2016 R11285 | 10 October 2016
1
5 / 29
Introduction The WLTP will be the new test procedure for determination of CO2 and pollutant emissions for type-approval testing of passenger cars and light commercial vehicles from September 2017 onwards. Over the last couple of years, ahead of the introduction of the WLTP, TNO has performed testing of the same vehicles on the NEDC test, the current test procedure, and the WLTP. This report summarizes the results of CO2 emissions of these comparative tests. For the NOx emissions of the diesel vehicles a separate report giving full details of the tests executed was 1 published in March 2016 . This report focusses on the CO2 emissions of comparable NEDC and WLTP tests. European CO2 targets for passenger cars and light duty vehicles and national policies are based on the official CO2 figures derived during type-approval testing as these are the only figures available for every individual vehicle. In the next two to three years all NEDC based CO2 figures will be replaced by WLTP based figures. A change in CO2 figures merely related to the transition from NEDC to WLTP will affect the effectiveness and stringency of policies aiming at CO 2 emissions reductions of vehicles. The impact of the changes from NEDC to WLTP is yet unknown. It is suggested that the WLTP will be a major improvement in CO2 emission testing, i.e. yielding higher CO2 emission test results closer to the realworld CO2 emission values established from monitoring programs. By performing back-to-back tests of the same vehicle according to NEDC and WLTP and by changing test settings (like vehicle mass), the impact of the transition from NEDC to WLTP is analysed. Since the WLTP is not compulsory yet, and, until recently, the procedure was not fixed, the WLTP testing is performed according to the interpretation of experts involved of the protocol, the parameters and the settings. The WLTP results reported here cannot be taken directly as an indication of the emissions if the car manufacturers would have conducted official WLTP tests for comparable new vehicles, but the effects of the different aspects of the test procedure can be deduced. For example, in the NEDC the tyres on the production vehicles do not have to be the same as on the test vehicle. In the WLTP this is no longer the case, and the tyre energy label will be taken into account in the CO 2 certification. Using the current NEDC type-approved production vehicles as example for future WLTP vehicles may be a worst-case approximation, since, very likely, the tyre choice will change with the introduction of the WLTP. Hence NEDC type-approved vehicles are 2 only a proxy for the future WLTP type-approved vehicles. In general NEDC and the new WLTP have a similar design: Road load and mass of the test vehicle are determined. The road load is determined by a separate coastdown test on a test track and reflects rolling resistance and air drag of the vehicle. 1
TNO 2016 R10083, “NOx emissions of Euro 5 and Euro 6 diesel passenger cars – test results in the lab and on the road”, Gerrit Kadijk et al., 2016 2 In general a WLTP vehicle will not be comparable to the previous NEDC vehicle as WLTP requires a new type-approval to be issued. Car manufacturers will seize the opportunity to introduce a new model.
TNO report | TNO 2016 R11285 | 10 October 2016
6 / 29
Road load and mass are used to adjust the settings of a chassis dynamometer in a laboratory. The test vehicle is mounted to the chassis dynamometer and is preconditioned. A test cycle is run. Emissions are collected and official CO2 emissions, fuel consumption and pollutant emissions results are calculated.
If considered in more detail, NEDC and WLTP differ on all elements given above. The most important changes are: Road load: procedures have been improved, test margins have been reduced, but also new testing options have been introduced (road load family concept, wind tunnel, flat belt testing, etc.). Mass: the test mass under WLTP is intended to reflect actual mass of the individual vehicle, rather than the mass of a basic vehicle as was the case under NEDC. Pre-conditioning: battery charging prior to the test, which was understood to be common practice in NEDC testing, will be explicitly forbidden in the WLTP. Test cycle: a new driving cycle will be introduced, requiring different amounts of cycle energy to be delivered by the engine, gear changes are no longer prescribed and the cold start contribution will change. These effects are investigated and quantified in this report. It should be understood that there are a number of interpretations in the testing. For instance, the WLTP tests have been performed with settings of mass and road load delivered by the car manufacturers. It’s generally unclear how manufacturers have determined the values of the test mass and road load; attempts to independently determine these values usually lead to different – generally substantially higher – values, with an impact of up to 15 g/km from a very wide variation in road load and test mass. Moreover, the test can be executed with a cold engine, at laboratory temperatures, or successively to another test with a warm engine. Finally, the road load setting on the chassis dynamometer must be confirmed by a laboratory road load determination. This means that the tests performed do not qualify as official type-approval tests. Nevertheless, the test-to-test variations give sound insight for NEDC to WLTP comparison. The tests performed by TNO are all part of programmes sponsored by the Dutch Ministry of Infrastructure and Environment. For two cases the services were offered to the European Commission as part of a larger program to correlate the performance of the NEDC and the WLTP. The different tests are described separately, as the variation in testing was large, and the program evolved with the development of WLTP legislation. The tests described span the period from Summer 2012 to Spring 2016.
TNO report | TNO 2016 R11285 | 10 October 2016
2
7 / 29
WLTC driving cycle The NEDC driving cycle was last updated in the early seventies of last century. The cycle poorly reflects modern driving behaviour. On the other hand, the stylized driving in the NEDC left little room for test flexibilities. With the WLTP a new driving cycle will be introduced, the WLTC. The WLTC is developed to better reflect modern driving and it is considered to be more demanding as it contains (compared to the NEDC cycle) more dynamics and higher speeds.
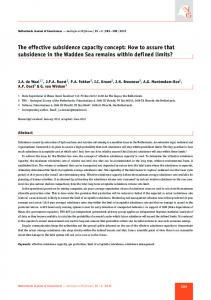
Figure 1
The velocities of the NEDC and the WLTC driving cycles.
The impact of the introduction of the WLTC driving cycle as such on the official CO2 emissions will be very limited. If the same vehicle is tested on the NEDC cycle and on the WLTC, keeping all laboratory settings ( in particular vehicle mass and road load) and conditions unchanged, the CO2 results will be comparable. In some cases a little higher, but in other cases WLTP results might even be lower than NEDC results. This is the net result of three effects that average out: The more demanding WLTC will increase the WLTP CO2 emission, typically in the range of +3 to +7 g/km. The total cold start emissions will not change significantly as a consequence of WLTC introduction, but the total emissions will be averaged over a substantially longer trip. The WLTC covers almost double the distance of an NEDC cycle. This leads to a lower gr/km contribution of the cold start on the WLTP, typically in the range of -3 to -5 g/km. The NEDC cycle contained prescribed gear shifting points. Under the WLTP a free gear shift strategy is allowed, as long as the requirement of sufficient power for vehicle acceleration is met. For vehicles with a manual gear box, ecodriving can be fully exploited, leading to lower WLTP CO 2 emissions, typically in the range of -3 to -6 g/km.
TNO report | TNO 2016 R11285 | 10 October 2016
8 / 29
The impact of the introduction of the WLTC drive cycle as such is small compared to the impact of changes in the test settings of the chassis dynamometer in the laboratory. The cold start yields additional CO2 emissions in the range of 60 g to 200 g. The contribution to the type-approval CO2 emissions varies with the length of the test. For the 11 kilometre distance of the NEDC test, the average 80 g CO2 cold start contribution results in over 7 g/km, while on the distance of 23 kilometre of the WLTP test, the cold start contributes less than 4 g/km. This result may vary from vehicle to vehicle, but a few gram per kilometre less on the WLTP is the typical result of the increased test length.
TNO report | TNO 2016 R11285 | 10 October 2016
3
9 / 29
Engine work and CO2 emissions The vehicle CO2 emissions are proportional to the work the vehicle combustion engine has to deliver. In the case that the test procedure gives substantial changes to the work demand, the changes in the CO2 emissions will be significant. In Chapter 2 it was concluded that the introduction of the WLTC cycle as such will not change the work required substantially. Hence, it is important to understand how the work will change with the different test settings used. The dominant settings found in the test programmes are: the road load (or driving resistance), the vehicle test mass and the battery charging. The differences in these settings explain most of the variations found in the tests.
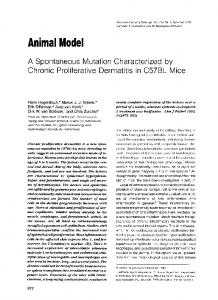
Figure 2
A sketch of two important settings in the test: the mass and the driving resistance. Based on current values and the actual changes in the legislation the expected change will bring the values close to the measured values. The estimates from other parties are typically much higher.
The WLTP will introduce new procedures to determine the test mass. In the WLTP every individual vehicle will have its own test mass. The WLTP test mass will be substantially higher than the NEDC test mass that was measured on a basic vehicle. The higher vehicle mass will increase the engine work required during the test and therefore will increase WLTP CO2 emissions. A 10% increase in weight will require 10% more power at acceleration and therefore 10% more work for accelerations. Additional mass will increase the rolling resistance of the vehicle as well. A 10% increase of weight will approximately give a 10% increase in rolling resistance. The driving resistance will be mainly affected by changes in the procedures to 3 determine the rolling resistance of the vehicle . Apart from the change in rolling resistance due to the change in vehicle weight, the tyre-energy label will also affect the rolling resistance. Currently, manufacturers can use tyres with low rolling resistance in the coastdown test, tyres that are different from the tyres on a production vehicle. Consequently, at independent testing at TNO the rolling resistance is much higher than the official rolling resistance of the type-approval test. The new WLTP procedures will limit the freedom of tyre choice and tyre 3
The second component of running resistance, the air drag, is not expected to change substantially by the transition from NEDC to WLTP.
TNO report | TNO 2016 R11285 | 10 October 2016
10 / 29
preparation. The change in tyres in the future with the WLTP will probably lead to lower rolling resistance than currently observed during independent testing with NEDC type-approved vehicles. The additional work from the additional mass and the higher rolling resistance will yield higher CO2 emissions, but not proportional to the increase. Each accounts for about a quarter of the total CO2. Hence, a 20% increase in weight will yield about 5% increase in CO2 emissions, or 10% if the associated effect of rolling resistance is included. A 40% increase in rolling resistance will give 10% increase in CO2 emissions. Sticking to the letter of the WLTP, the change in test mass may be 100 to 150 kg on a midsize car, as a combined effect of maximally 50 kg increase due to the removal of a NEDC flexibility linked to the inertia settings of the chassis dynamometers and a prescribed additional 15% payload on the WLTP.. Currently, vehicles are tested with a low road load, which must in part be due to low rolling resistance of the tyres. On the other hand the road load given for the WLTP must be related to high rolling resistance, typically tyre labels C or D. Replacing the tyres with low resistance tyres, e.g., the change from a tyre label C/D to A/B will half the rolling resistance difference between NEDC and WLTP claimed on the basis of the current NEDC type-approval practice. In this report the following typical estimates of changes in mass and road load and their associated impacts on CO2 emissions are used: An increase in vehicle mass of 110 kg leads to 2 g/km higher CO2 emissions. An increase in road load, in particular the rolling resistance by 10 N will lead to 2 g/km extra CO2 emissions. The absolute values of weight and force are directly associated with work and therefore a better proxy for the changes in CO2 emissions than relative numbers. An increase of test mass by 110 kg and an increase in rolling resistance by 10 N may be considered small but realistic changes once the WLTP is the new typeapproval test. Given these numbers it is clear that a lot of CO2 emissions are not directly related to the power delivered at the wheels. The losses in the engine and the driveline are substantial in the NEDC. The significant contribution of the losses in the NEDC cycle, with its high amount of idling and its low velocities, did drive the technological improvements in engine efficiency over the last twenty years. Further improvements, especially with the change to the WLTP, where engine losses play a smaller role, are expected to be limited. These losses are only marginally related to the additional weight and changes in resistance in the different tests. One of the complicating factors in discussing the WLTP test settings is the use of the interpolation family. Under the WLTP a vehicle Low and a vehicle High will be selected. They represent the vehicles with the lowest and the highest CO2 emission and cover the full range of vehicles of a single type-approval type. In most cases both vehicles High and Low will be tested and will be used to calculate – via interpolation - the CO2 emissions of an individual vehicles of the family. The WLTP provides the option only to test vehicle High. This might inflate the difference between NEDC and WLTP CO2 emissions. Moreover, it does not reflect the production models which are likely to cluster around the low end of the range with stringent CO2 targets.
TNO report | TNO 2016 R11285 | 10 October 2016
4
11 / 29
Differences in test conditions and settings The CO2 results of NEDC and WLTP tests strongly depend on the test conditions and test settings. In the investigations conditions and settings have been varied and relations between test parameters and test results have been derived. Based on these relations the impact of changes in the WLTP test procedure, compared to the NEDC procedure, can be described. The NEDC and WLTP tests contain two major parts: 1. Determination of the road load by execution of a coastdown test. In particular variations in vehicle weight, wheel and tyre selection, tyre pressure and (optimized) test conditions determine variations in road load values. 2. The execution of the emission test in the laboratory with the road load values derived from the coast down test. In particular variations in the conditioning of the vehicle and the settings of the dynamometer (mass and road load) determine the variations in CO2 results. This chapter describes the main aspects and the variations thereof in the tests conducted.
4.1
Start conditions TNO performed WLTP and NEDC tests with a cold start as well as with a hot start. Tests with a cold start are mandatory for official type approval tests. However, the disadvantage of cold tests is the limited number of tests that can be performed per day. Due to a limited time schedule for some vehicles sometimes only WLTC tests with a hot start were performed. In that case also a NEDC with a hot start was tested. In general the cold start effect is larger at the NEDC due to shorter trip distance.
4.2
Test mass and inertia settings There is difference between the test mass and inertia settings used for the NEDC and the settings used for the WLTP. For the NEDC tests the criteria from UNECE regulation No. 83 are used and for the WLTP the criteria from the UNECE GTR No. 15 are used. For the NEDC the test mass is related to the reference mass, which is defined as: "Reference mass" means the "unladen mass" of the vehicle increased by a uniform figure of 100 kg. "Unladen mass" means the mass of the vehicle in running order without the uniform mass of the driver of 75 kg, passengers or load, but with the fuel tank 90 per cent full and the usual set of tools and spare wheel on board, where applicable;" The reference mass is used to determine the road load by means of a coast down test and to determine the correct inertia weight class for the chassis dynamometer setting of the specific vehicle, see Table 1. This inertia is used during the NEDC test.
TNO report | TNO 2016 R11285 | 10 October 2016
Table 1
12 / 29
Inertia weight classes for the NEDC
Reference mass range (min max)
Equivalent inertia
kg
kg
Min
480
455
966
1080
1020
1081
1190
1130
1191
1305
1250
1306
1420
1360
1421
1530
1470
1531
1640
1590
1641
1760
1700
1761
1870
1810
1871
1980
1930
1981
2100
2040
2101
2210
2150
2211
2380
2270
2381
2610
2270
2611
max
2270
The WLTP will introduce a different approach to determine the test mass. The concept of inertia classes will be abandoned. In principle the exact vehicle mass of the production vehicle will be used. Only if the chassis dynamometer is not capable of handling exact masses, gradual inertia steps may be used. In that case the test mass shall always be the next higher setting. There are two important vehicles masses; Test Mass Low (TML) and Test Mass High (TMH). The difference between TML and TMH is inclusion of ‘optional equipment’ mass. These are the features which are not included in a standard vehicle but they can be ordered by the consumer. The test mass shall be the sum of: Mass in running order (vehicle mass including the mass of the driver and liquids, fitted with the standard equipment) 25 kg Optional equipment (only for TMH) Vehicle load (15% * (maximum laden mass – (mass in running order + 25 kg + optional equipment) The following example will illustrate that WLTP test mass may deviate substantially from NEDC test mass. If the mass in running order is 1350 kg, the optional equipment 200 kg and the maximum laden mass is 2000 kg, then: TMH = 1350 + 25 + 200 + ((2000-1575)*0.15) = 1639 kg TML = 1350 + 25 + ((2000-1575)*0.15) = 1439 kg NEDC reference mass = 1375 kg NEDC inertia setting = 1360 kg
TNO report | TNO 2016 R11285 | 10 October 2016
13 / 29
During the performed WLTP tests most vehicles were tested at TMH on a dual axis chassis dynamometer. For the NEDC the inertia weight class was used. For TMH a difficulty is to determine the mass of optional equipment. In some cases the OEM was involved in the measurement programme, then the OEM could estimate this mass. In other cases TNO made an estimation by comparing unladen mass of the same vehicle types. A third method used was weighing the actual vehicle and comparing it with the mass in the type approval documents. The mass for optional equipment was in the range between 50 and 225 kg. On average the inertia setting during the chassis dynamometer tests was 15% higher for WLTP compared to NEDC. It is unlikely that 15%, i.e. 200 kg or more for a midsize car, will be the actual test mass increase once the WLTP is introduced, because production models are likely to cluster closer to vehicle Low than to vehicle High. A mass increase of about 100 kg seems more realistic. 4.3
Road load settings Road load settings, or driving resistance coefficients, are mostly determined by means of a coast down test. As mentioned in the previous paragraph the coast down measurements for the WLTP are performed with a higher test mass than for the NEDC (UNECE Regulation 83). In addition to the higher test mass, other aspects which influence the road load have been changed as well. Amongst others, the requirements for tyre selection and tyre pressure have become more stringent, as well as test margins and test accuracies. As a result of the more stringent regulation for coast down testing, the road load of the vehicles will increase. During the TNO measurement programme various road load settings were used for the WLTP and/or NEDC. It is important to mention that there are no official WLTP type approved vehicles yet. Therefore the only official road loads are determined by using the NEDC criteria. The following road load settings were used: 1. NEDC Type approval settings: Obtained via the type approval documents. The road load settings are taken directly from the reported driving resistance coefficients or calculated from the reported coast times, whichever was available. WLTP OEM settings: Obtained in collaboration with the OEM of the supplied vehicle. The OEM obtained its WLTP settings either by performing coast down measurements or calculating the settings; 2. WLTP settings by using the industry calculation tool. The tool uses the NEDC road load coefficients as a basis. This tool has been made available to TNO as part of the participation in the European test program. Furthermore, input is needed for the difference in rolling resistance between the best-case-tyre (NEDC) and the worst-case-tyre (WLTP). In addition input is needed for the difference in cd*A (coefficient for air drag times frontal area) between the bestcase-vehicle (NEDC) and the worst-case vehicle (WLTP). Based on these input parameters and the test mass of the vehicle WLTP road load coefficients are estimated. In some cases the OEM which delivered TNO road load settings used this tool. TNO used this tool also when the testing programme was performed independently. TNO made an estimation for the test mass; 3. WLTP real world settings: In a few cases TNO performed coast down measurements to determine WLTP road load settings.
TNO report | TNO 2016 R11285 | 10 October 2016
14 / 29
The industry calculation tool was mostly used to determine the WLTP road loads. Compared to the NEDC road load coefficients the tool increased the f0 coefficient which is related to rolling resistance - on average with 50%, within a range between 30% to 75%. The f2 - which is related to the air drag - was increased on average with 8% within a range between 6% to 12%. These averages and ranges only apply for the vehicles tested with estimated input parameters. For other vehicles the results may differ. The WLTP test mass based on the measured actual vehicle mass was usually much lower than the test masses supplied by the OEMs. The independent road load determination by TNO, using the WLTP and the appropriate test mass was in many cases close to the OEM results. However, these are nonoptimized tests. Given the bandwidth in road load determinations, a 5% lower value will require only limited extra test effort. The following combinations for road load settings and driving cycles are used: 1. OEM type approval settings for both the NEDC and WLTP comparison of the cycles 2. OEM WLTP settings for both the NEDC and WLTP comparison of the cycles at a higher load. 3. OEM type approval setting for the NEDC, WLTP settings for the WLTP comparison of complete testing procedure
test cycle = CADC 150
Figure 3
Effect of different road load (RL) and inertia (IN) settings on the CO2 emissions measured in a chassis dynamometer test using the real-world CADC 150 driving cycle4. The inertia setting based on the WLTP is 30% higher than the NEDC setting. For the road load settings according to WLTP a 60% increase on f0 is assumed and a 10% increase on f2 compared to the NEDC settings.
4.4
WLTP versus NEDC road load determination The main difference in the road load determination procedure from NEDC to WLTP is the applicable vehicle test mass in the coast down test. A higher test mass results in a higher rolling resistance. A secondary aspect is the tyre pressure according to the user manual. There have been limited comparative studies of NEDC and WLTP road load determination on the same vehicle. TNO has executed this for the Smart 4
For more information on the CADC test cycle see e.g. TNO 2016 R11178, “Assessment of road vehicle emissions: methodology of the Dutch in-service testing programme”, V.A.M. Heijne et al., 2016
TNO report | TNO 2016 R11285 | 10 October 2016
15 / 29
vehicle model. But the changing weather conditions on the test day led to the discard of this data in the correlation program. In the morning the test track was slightly moist, which may have affected the outcome of the NEDC coast-down test. It was difficult to achieve the NEDC test mass of 800 kg of the tested Smart (see section 5.12). Eventually, the passenger chair was removed to reach the test mass. The measured NEDC road load values were somewhat lower than the WLTP values, but nowhere in the range of the NEDC values reported by the OEM. In the case that the WLTP test mass of 933 kg was used, the measured road load values were similar to the OEM WLTP values. 4.5
Gear selection For vehicles with a manual transmission the NEDC contained prescribed gear shifting points. Under the WLTP the gear shift strategy is free as long as sufficient power for vehicle acceleration is available. It is quite complex to calculate the WLTP gear selection. Consultant Heinz Steven developed a tool which calculates the gear selection in accordance to the WLTP regulation. The following input parameters are needed: Rated engine power: maximum engine power as declared by the manufacturer; Rated engine speed: engine speed at maximum engine power; Unladen mass; Test mass: test mass high or test mass low; Idling speed; Number of gears; Gear ratios: engine speed divided by vehicle speed per gear; Road load values (f0, f1, f2): default values are available based on test mass; Full load curve: default curves are available for diesel and petrol engines. An important parameter for WLTP gear selection is the minimum engine speed, ‘n_min_drive’, during drive phases in gears higher than 2. For the WLTP the n_min_drive is limited to: 0.125 * (rated speed – idling speed) + idling speed. For instance: With a rated engine speed of 3500 rpm and an idling speed of 750 rpm. n_min_drive = 0.125 * (3500 – 750) + 750 = 1094 rpm To avoid too many downshifts to gear 1, the minimum engine speed is lowered for gear 2. For the TNO measurement programme the tool developed by Heinz Steven is used to determine the gear selection. For two vehicles three different gear shift patterns were developed by modifying the n_min_drive values. In some other cases the gear selection strategy was recycled from an earlier test with a comparable (for power-tomass) vehicle. This was sometimes done because otherwise a new driver aid file is needed for each new vehicle. It is likely the gear shift strategy could be optimized further than was the case in the test program. For vehicles with an automatic gearbox the WLTP prescribes that the standard selected gear should be used. This is also done in the TNO measurement programme. For one vehicle both the ‘sportive’ and ‘eco’ setting was used during a WLTP test.
TNO report | TNO 2016 R11285 | 10 October 2016
4.6
16 / 29
Electric equipment and use Battery charging prior to the test, considered to be common practice under the NEDC, will no longer be allowed in the WLTP type-approval test. In the test program different battery charging strategies were applied. Sometimes charging occurred before every test, sometimes only overnight. The latter is associated with charging only before cold tests. For two vehicles no battery charging was used at all. Overall, the test variations provide sufficient information to assess the impact of battery charging on the CO 2 results. Vehicles do not always perform as expected in the emission tests. In some cases, start-stop did not work. This can have a large influence on the CO2 results. Similarly, headlights which switched on automatically could lead to results that deviate significantly from the type-approval values.
TNO report | TNO 2016 R11285 | 10 October 2016
5
17 / 29
Vehicle tests Since the number of vehicles tested was limited and the variations in the test protocol are large and complex the results are summarized in this chapter per vehicle. It is not meaningful to generate tables or plots with the overview of the test results, as would be the case in many other test programs where the same test protocol is carried out with different vehicles. In principle, the official NEDC is to be compared with the official WLTP test. Both test need to be executed with a cold engine at the start. Since a cold start requires an overnight soak of the vehicle, the number of cold start tests in a test program is limited by its duration. Therefore, in a number of cases the effect of a cold start must be estimated as a separate effect and added to a warm test to make the NEDC and WLTP test comparable. If one test is executed with a warm engine and the other test with a cold engine such an analysis is needed, on top of the fact that other test settings, such as mass and road load can differ between the different tests. In this chapter these analyses are performed to make the comparisons possible. The steps to make the different tests comparable are summarized per vehicle and are a combination of five aspects: 1. In the absence of a cold start test on either NEDC or WLTP, the cold start is determined from the other test executed both warm and cold. This yields an absolute difference of 20-200 g, which is then distributed over the length of the test, to yield a cold start effect to be added to a warm test. 2. In the case of a different test mass, the mass difference gives on average 1.85 g/km per 100 kg. This average physical effect is subtracted from the result, to arrive at the effect of the test alone, separate from the choice of test mass. It should be noted this does not include the effect of mass on rolling resistance, which is included separately. 3. The differences in road load are dominated by the normalized rolling resistance, 5 f0 + 22.5 * f1. An increase of this force by 5 Newton will result in a typical difference of 1 g/km in CO2 emissions. 4. The non-functioning of CO2 reducing systems, such as a stop-start system that fails to function in a test, should be excluded. If no appropriate cold start test was available the effect is estimated from the warm tests and applied to the cold tests. 5. A NEDC test flexibility excluded in the WLTP test is battery charging prior to testing. Nevertheless, most WLTP tests have been executed with charging. Typically all the cold tests are performed with battery charging prior to the test. The effect of this flexibility is investigated for the cases that different test protocols were used, such that the effect can be isolated. In the next chapter some general conclusions are given based on the test results. This chapter includes only vehicles in the test program for which both NEDC and WLTP tests are executed side by side. A few of these vehicles were part of the European test program for the correlation between the NEDC and the WLTP. These tests were executed with the collaboration and the input of the manufacturer. In one 5
Based on least-square error fit of a constant rolling resistance (R) and a standard air drag: R + A v2 of the road-load coefficients for the standard force curve: Force[N] = f0 + f1 * v + f2 * v2.
TNO report | TNO 2016 R11285 | 10 October 2016
18 / 29
case the road-load values were part of a non-disclosure agreement and TNO erased the data from their records. Regarding the emission testing and results provided, it should be clear that: 1. These vehicles do not have to comply with the WLTP test and the emission results should be taken as exploratory rather than definite. 2. TNO did not find peculiar behaviour of the vehicles, apart from the problems described below, that could be construed as illegal software control strategy of the vehicle. The CO2 emissions and the variation therein were generally explained by the test variation. The effects observed for NOx emissions, with a manifold increase in the emissions, are not observed for CO2 emissions. 3. All WLTP settings for road load and test mass were determined prior to the final version of the WLTP legislation. Moreover, the test execution reflects the state of the WLTP draft text at the time of the tests. Hence, the test would have been executed somewhat different if the WLTP as adopted in Spring 2016 was applied. 4. The CO2 test results of NEDC tests with a cold start and executed within the full specification of the test protocol are typically about 20 g/km higher than the CO2 type-approval values. The same vehicle test mass and road load settings are used in both cases, so the difference is solely the result of the execution of the emission test, the state of the vehicle, and the subsequent administrative steps prior to reporting. The difference is observed but could not be traced back to known flexibilities. Moreover, it should be noted that these vehicles are all type-approved under the NEDC and therefore likely optimized for the NEDC and not for the WLTP. In a number of cases the tests were repeated. From the repetition of the same test a test-to-test variation can be estimated. In many cases the test results of repeated tests lie within a bandwidth of 2-3 g/km. Only in some cases the variation was much larger. These cases are often associated with a failure to achieve the right settings, for example, the functioning of the stop-start system or the running of head lights. More details of the tests and the vehicles, in particular the diesel vehicles, can be 6 found in the report on the NOx emissions of these vehicles. 5.1
BMW 320d automatic transmission in two model versions, diesel This vehicle was tested on the NEDC and the WLTP with the same test mass and road load. Without reference to “warm testing” in this report, the NEDC and WLTP are to be taken official tests and therefore with a cold engine start. The battery was charged prior to the test. The NEDC test gave 128 g/km with was only 4 g/km higher than the type-approval value of 124 g/km. The WLTP value for the same setting was 7 g/km higher at 135 g/km. This result is considered to reflect the upper limit of the changes in dynamics and speed from NEDC to WLTC. The vehicle was also tested on the WLTP with additional weight increasing the test mass from 1590 to 1930 kg. This increase of 340 kg, with no adjustment of the road
6
For reference see footnote 1.
TNO report | TNO 2016 R11285 | 10 October 2016
19 / 29
load, gave an increase in CO2 emission of 9 g/km. The 21% weight increase resulted therefore in 7% increase in CO2 emissions. A much larger increase in CO2 emission was observed for a second version of this vehicle with a 120 kg lower mass, lower road load and type-approval CO2 of 109 g/km by changing the transmission setting from “eco” to “sportive”. The CO2 emission on the WLTP increased from 112 g/km to 149 g/km from only changing the transmission setting and keeping the rest of the test identical. It should however be noted that the road load settings on the eco-setting test was slightly outside the bounds on the NEDC requirements. 5.2
VW Passat cc diesel The VW Passat was tested twice with a warm engine on the NEDC and the WLTP with the same mass and road load setting. In that case CO2 emission on the WLTP was 1.5 and 1.9 g/km lower than on the NEDC test. In part, this is the result of the cold start. From the difference between a cold NEDC and a hot NEDC the cold start can be estimated at 150 g extra CO2 emissions. For the NEDC it adds 12 g/km to the result, while for the WLTP it adds only 7 g/km to the result. Hence on an official cold NEDC and WLTP test the difference, correcting for the cold start on the WLTP, is expected to be 3 g/km emission more on the WLTP with the same test execution. The cold NEDC test gave 149 g/km, which is 22 g/km higher than the type-approval value of 127 g/km.
5.3
Mazda CX5 diesel This vehicle did not give consistent results. There were large variations in the results, up to 10 g/km, with the repetition of the same test. Roughly, the NEDC is expected to be 5-10 g/km lower than the WLTP with the same test mass and road load. However, this vehicle seems heavily optimized and calibrated for NEDC performance. In one of the hot NEDC tests the stop-start system did not function which resulted in 3 g/km higher CO2 emission than with the stop-start functioning. Another NEDC test had a DPF regeneration and the CO 2 emissions were 10 g/km higher than without this regeneration. The difference between hot NEDC and hot WLTP test gave 4 and 7 g/km extra on the WLTP. Adding another 5 g/km from the cold start difference to the NEDC, will make the NEDC and WLTP comparable with the official tests. Hence for this vehicle the difference is expected to be about 10 g/km higher for the WLTP type-approval test.
5.4
Opel Zafira diesel in two model versions The first Opel Zafira tested participated in the European test program under guidance of JRC with the participation of the car manufacturers. This vehicle was tested with different settings for the NEDC and the WLTP. Eventually, the NEDC test results were considered faulty because the head lights were on during the test. The type-approval CO2 was 117 g/km, and the average value from the measurements with official test mass and road-load was 137 g/km. The single test where the headlights were off gave 5 g/km lower emissions. Given 150 Watt power consumption of running lights and a 60% alternator conversion efficiency would result more or less in such a difference. The warm NEDC test had an average of 130 g/km, which would correspond to a cold start contribution 80 g. The WLTP test
TNO report | TNO 2016 R11285 | 10 October 2016
20 / 29
was carried out with different mass and road load settings prescribed by test program. This information is no longer available, but the vehicle was tested on the WLTP with 354 kg higher mass than on the NEDC. This is a 21% higher weight. Only the cold tests were executed with a charged battery. The average of the cold WLTP tests was 152 g/km, which is 15 g/km higher than the faulty NEDC test average with the light on, and 20 g/km higher than the correct NEDC test when the lights were off. The subsequent warm WLTP tests were with the battery state as the result of the previous test, but the result gave a minor difference from the cold test at 151 g/km. It can therefore be concluded that the cold start emissions in the WLTP, in the order of 90 g or 4 g/km are compensated by the charging of the battery prior to the test. A second Opel Zafira was tested by TNO independently. This vehicle had a typeapproval CO2 emission of 109 g/km, and a NEDC test value of 129 g/km. The WLTP test was carried out with a mass and road load as suggested by the industry tool for the WLTP high. The WLTP mass was 19% higher than the NEDC mass, 2029 kg compared to 1700 kg. Moreover the road load 38% higher, which incorporates the 19% of the weight increase, but the other 19% difference should come from the tyre choice and pressure as the remaining difference in the NEDC and WLTP test protocol for road load determination. The CO2 emission on the WLTP test was 146 g/km. The 17 g/km increase in CO2 emissions for this vehicle for 15 g/km explained by the higher power demand from the substantial increase in vehicle weight and road load. 5.5
Peugeot 208 diesel The battery of this vehicle was charged before every test, also the warm tests, which is not common in the test programs. The three (cold) NEDC tests gave between 102 and 109 g/km with an average of 104 g/km. The WLTP test was again carried out on the basis of the WLTP mass and road load estimates from the industry tool. The cold WLTP test gave 122 g/km and the warm test 2 g/km less. For the NEDC the difference between a hot and cold test was 4 g/km, with the warm NEDC of 100 g/km, which is consistent considering the double distance covered in the WLTP test. Based on the differences in weight and road load, with were respectively 35% and 61% higher the expected difference based on the total work is 14 g/km which leaves 4 g/km of the 18 g/km difference for the differences in the test rather than the vehicle-based settings. Also this test, like most WLTP tests, are executed with the adapted gear-shift strategy from the Heinz Steven tool. Such a gear shifts are somewhat optimized, but with a gear shift indicator even lower engine speeds and better engine efficiencies could be achieved.
5.6
Mercedes-Benz C220 diesel automatic transmission The type-approval CO2 of this vehicle was 110 g/km, and the NEDC test gave 121 g/km, with a modest difference between the two of 11 g/km, while 20 g/km difference is typical. The WLTP value was 13 g/km higher than the NEDC value, which corresponds precisely with the prediction based on the increase in mass and road load of 16% and 52%. From other aspects in test difference no net effect is to be expected. In this case the gear shift strategy does not play a role.
TNO report | TNO 2016 R11285 | 10 October 2016
5.7
21 / 29
AUDI Q7 diesel Again here the mass and the road load have been adapted with the industry tool. A 19% increase in test mass, corresponding to 438 kg higher weight, and 35% increase in road load yield a 27 g/km higher CO2 emission, from 223 on the NEDC to 250 g/km on the WLTP. The type-approval is 195 g/km. This vehicle had a high cold start contribution, estimated at 200 g extra CO2. Based on the extra work 21 g/km would be the estimated difference between the NEDC and the WLTP. This would mean that 6 g/km on the high-end value of 223 g/km is not covered by the different vehicle specifications as estimated for the WLTP.
5.8
BMW 530 xd diesel The measurements of this vehicles raise some doubt on its WLTP test results. The hot WLTP test probably had a DPF regeneration but this was not properly recorded at the time. The extra high phase (motorway part) of the WTLC gave 229 g/km for the hot test against 186 g/km for the cold test. Moreover, the NEDC test did not pass the chassis dynamometer coast down determination, so some general deviations are to be expected. Yet the comparison is in line with the expected result. The type-approval value is 152 g/km, the NEDC test gave 184 g/km with a cold start contribution of 160 g, or 14 g/km. The WLTP test gave 190 g/km. Based on the different mass and road load on the WLTP test, respectively 11% and 29% higher, the expected difference would be 17 g/km, but the observed difference is only 6 g/km. But, again, the NEDC test may deviate upward from the fact that the road load deviated somewhat from the official values.
5.9
Ford Focus diesel The Ford Focus tests were performed with a OEM test mass of 1470 kg, much higher than the official NEDC test mass according to the vehicle documents. Correspondingly, the weight increase from the NEDC to the WLTP was limited to 6%. The road load, on the other hand increased a staggering 74% by the application of the industry tool. These test settings do reflect the outcome of the tests. The type-approval CO2 was 98 g/km. The NEDC test gave 117 g/km and the WLTP 133 g/km. The increase of 16 g/km is half explained by the change in settings. About 8 g/km difference remains once the results are compensated for the different settings.
5.10
Renault Megane diesel The Renault Megane was tested with a rather low test mass of 1250 kg on the NEDC. The type-approval CO2 value is 93 g/km. The two NEDC test give 104 and 109 g/km. This vehicle like a few others had a small difference between the cold and hot NEDC CO2 emissions, yielding an average cold start contribution of 54 g. The weight and road load were increased by (291 kg) 23% and 54% respectively for the WLTP hot test which yields 120 g/km. Including a cold start contribution of 2 g/km, the result of 122 g/km and 15 g/km higher than the NEDC test is well in line with the expected difference of 12 g/km from test mass and road-load changes alone.
TNO report | TNO 2016 R11285 | 10 October 2016
5.11
22 / 29
VW Golf diesel o
This vehicle has a type-approval value of 99 g/km. The NEDC cycle test at 15 C gave 125 g/km with the battery charged prior to the test. The hot WLTP test, without charging, gave 124 g/km. The hot NEDC test, also without charging, gave 119 g/km. A rough estimation of the cold start would therefore yield 66 g and 3 g/km extra on the cold WLTP test. Based on the increase in weight and road load one would expect an increase of 9/km, instead 1 g/km is observed. Including an effect of charging of about 4 g/km on the NEDC, would increase by 2 g/km the cold start to 5 g/km on the WLTP. Still, for this vehicle the difference due to the cycle alone is expected to yield a decrease of CO2 emissions from the NEDC to the WLTP. 5.12
Smart gasoline automatic transmission The Smart was part of the European correlation program. The testing was therefore more restrictive, which resulted in higher differences than normally observed. The type-approval value is 106 g/km, which is quite high to comparable vehicles. But the testing was carried out in 2013. So this is a slightly older vehicle, compared to the other vehicles. The automatic transmission on the chassis dynamometer gave quite a bother. Many tests were excluded as being unstable. The NEDC average was 105 g/km, 1 g/km less than the type-approval value. This was the only time the independent test was lower than the type-approval value. The hot NEDC tests without charging prior to the test gave an average of 99 g/km, yielding a net effect of battery charging and cold start of 6 g/km, showing the dominance of the coldstart effect over charging for this vehicle. The difference in road load and mass between the NEDC and WLTP were substantial for such a compact car with a weight increase from 800 kg to 933 kg, and a large road load increase of 74%. This resulted in a WLTP test result which was 22 g/km higher, of which 14 g/km can be explained from the change in work. This vehicle has no advantage from the difference in gear shift strategies, since it is an automatic transmission. This may account for about 5 g/km higher WLTP result. Moreover, the NEDC test result below the official type-approval value does indicated optimized vehicle preparation and NEDC testing in this program.
5.13
Peugeot 508 petrol Early on in the development of the WLTP legislation this vehicle was tested in an extensive program comparing the different parts of the change from NEDC to WLTP. The type-approval CO2 of this vehicle was 144 g/km. There were four different test masses used and five different road loads, partly associated with the weight increase of the vehicle. The road loads were separately determined. At the time the cycle changed from version 5.2 to 5.3 mainly to incorporate the wishes of the Japanese delegates who wished to cap the decelerations in the tests.
TNO report | TNO 2016 R11285 | 10 October 2016
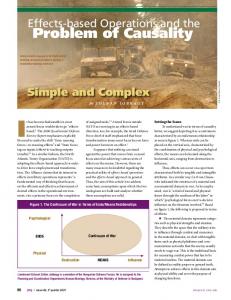
Figure 4
23 / 29
The Peugeot 508 test results with different test masses and the road load changed accordingly
In some cases, in particularly the NEDC, the road load on the chassis dynamometer was not within the specified bounds. But since the results were very similar to the cases where the road load precisely satisfied these tests are taken into account in the current analysis. The change from WLTC 5.2 to 5.3 gave a difference of 4 g/km more on the cold test, however, based on a single test. For the warm WLTP tests the difference was 2 g/km. The difference of the two NEDC tests with the type-approval value of 144 g/km was 19 g/km. In the case of the three warm NEDC tests the CO2 emissions was on average 149 g/km, resulting in a cold start emission of 159 g, or 14 g/km. The warm WLTP 5.2 test with the NEDC mass and road load of the warm NEDC test gave a lower CO2 at 142 g/km, compared to an average of 149 /km on the NEDC. Apart from the larger cold start effect for petrol, the higher cycle power demand seem to make the WLTP more beneficial for petrol. Increasing the test mass and road load gives more or less the expected effect: The different test masses and road loads are expected to increase the CO2 emissions by 21, 27, and 30 g/km for the different increases in mass and road loads. The NEDC test result was 17 g/km higher instead 21 g/km. The warm NEDC test results were 19 and 28 g/km instead of the estimated 21 and 30 g/km. The WLTP test results show a similar variation. There was no cold WLTP test executed with the low test mass and road load. But the warm test gave a lower WLTP than NEDC value. Across the board comparing the tests with the same test mass and road load gives, for warm test, 5-6 g/km lower CO2 emissions on the WLTP. For the cold test the difference is more pronounced at 12 g/km.
TNO report | TNO 2016 R11285 | 10 October 2016
24 / 29
The four different test masses and road loads give a range of results, the effects of a 3 to 4 g/km with every increase in test mass and road load is consistent with the expectations. The comparison of the same cycle with different road loads yield 17 g/km from 1 to 2, where 21 g/km was expected on the NEDC. From test mass and road load 2 to 3 the difference of the cold NEDC is 17 g/km, where 6 g/km as expected. This is based on a single measurement on the second road load. For the warm WLTP the measured difference is 6 g/km as expected, in line with the rd th expectation. For the 3 to 4 road load the expected difference is 3 g/km. Both the rd cold and warm WLTP yield 4 g/km on average. For the NEDC there is no 3 road nd th load available, but the difference between the 2 and 4 is 9 g/km, where 9 g/km is also expected from the increases in test mass and road load. Overall, the conclusion is that for this vehicle the WLTP cycle would lead to a lower CO2 emission. The increase in weight and road load adjust this upward such that the result between the low mass NEDC and 100 kg and 40% higher road load leads to 5 g/km higher CO2 emission. 5.14
VW Polo diesel The VW Polo diesel has been tested more extensively as well. Part of the testing was to bring the vehicle in line with the type-approval result of 89 g/km. Initial testing gave cold NEDC result of 114 g/km, but in this case the stop-start system did not function. Later the tests were repeated with functioning stop-start system, and the test results were on average 100 g/km, 11 g/km higher than the type approval value. Using the higher test mass and road load, of respectively 7% and 54% higher with the stop-start inactive, yielded 124 g/km which is, with 10 g/km, similar to the expected effect of 11 g/km. The cold start effect fluctuated somewhat, especially with the problems with the stop-start system, but from the WLTP tests the effect of the cold start can be estimated at about 3 g/km, based on the same test mass, road load and WLTP cycle version. The increase of 7% and 54% other test-mass and road load setting, respectively, were used on the WLTP. Furthermore, different versions of the WLTP were tested. The effect of the increasing test mass and road load on the WLTP is somewhat larger than expected based on the estimates: The 2% and 3% increases in road load and the 6% and 12% increase in test mass yields 5 and 10 g/km additional CO2 emissions, rather than the estimated 2 and 4 g/km. Possibly the gear shift strategy played a role in this difference.
5.15
Overview The differences in observed CO2 test results can be categorized in three groups: 1. The CO2 test results of independent NEDC tests executed within the full specification of the NEDC test protocol are typically in the order of 20 g/km higher than the NEDC CO2 type-approval values. With the involvement, or assistance, of the vehicle manufacturer lower values, but still 0-10 g/km higher than the type-approval result, could be obtained. 2. The differences from using different test masses and road loads, on the WLTP and the NEDC alike, are in the order of 10 g/km. The higher test mass and
TNO report | TNO 2016 R11285 | 10 October 2016
25 / 29
higher road load are key in the difference between the NEDC and the WLTP. The test cycle itself yields only a difference of a few grams both up and down. In general for automatic transmissions the difference between WLTP and NEDC result is somewhat higher, compared to manual transmission cars, as automatic transmissions will not benefit from the WLTP gear shift procedure. 3. Finally, differences in the order of 5 g/km from flexibilities, the change of cycle, the cold start effect, etc. which often disappear in the uncertainty of the single tests. A few gram per kilometre difference on a singly repeated test lies within the uncertainty of the test results. Differences of 5 g/km or more are significant. The battery charging is the only flexibility singled out in the chassis dynamometer tests, with an impact of 3-5 g/km higher CO2 emissions on the WLTP. It is unclear what the actual increase in test mass and road load will be once the WLTP will be the type-approval procedure. The increase of 20% in in test mass and 50% in road load seems to be on the high side, compared to results from weighing and testing current vehicles on the road.
TNO report | TNO 2016 R11285 | 10 October 2016
6
26 / 29
Conclusions There are no WLTP type-approved vehicles yet. Until Spring 2016 the WLTP test procedure was not even completely fixed. Hence, all reported results so far on the WLTP tests are preliminary. One of the main findings of the NEDC-WLTP comparative testing is the large systematic difference of 20 g/km between the NEDC type-approval CO2 emissions and the TNO NEDC test results, independent tests performed according to the official protocol. In the tightening of the regulation with the WLTP, these differences between type-approval results and the independent tests were never fully expounded. The known flexibilities, in particular battery charging and inertia classes, account for at most 7 g/km which are to be removed in the WLTP. For twothird the flexibilities responsible for the gap seem to remain in place, leaving room to manoeuvre WLTP test values in any direction. In addition to this difference also flexibilities can be exploited in the determination of the road load values, i.e. the driving resistance, by means of coastdown tests. These two distinct, but in discussions generally mixed up, issues add up independently to a total test flexibility in the order of 30-40 g/km. Though independent, both issues interact in the emissions tests performed on the chassis dynamometer, because the adjustment of the chassis dynamometer requires road load values and test mass. Claims of large changes in test mass and road load values due to the introduction of the WLTP are made, such as a test mass increase of 20% and a road load increase of 50%. An increase in test mass of 20% and an increase in road load in the order of 50% is extreme by all accounts.. The claimed differences in test mass and road load will not materialize once the WLTP is the official type-approval procedure. Once the WLTP is introduced, and the manufacturers need to reduce the type-approval CO2 emission the common practice will be to pay full attention to reduce test mass and optimize tyre selection and preparation in order to get low CO2 emissions. If the WLTP tests are executed with a the high test mass and road load values claimed by the manufacturers of the supplied vehicles, WLTP CO 2 test results are 15-20 g/km higher than the NEDC test results. Tests at TNO do not confirm a large change from the change of the test itself. Independent side-by-side testing of NEDC and WLTP give comparable CO2 emissions. It is mainly the interpretation of the procedure which may result in a difference. In part, the more strict test protocol leaves less room, or flexibility, to optimize the test toward low emissions. As important as the reduced flexibilities are the representativeness of the tested vehicle for the vehicles sold and used. The weight and the tyre type are key elements in the changed protocol. Very likely the WLTP will not result in an increase in test mass of more than 10% and a road load increase of more than 20%. Assuming a realistic test mass and road load increase the expected difference between the NEDC and the WLTP will seldom exceed 10 g/km. Using higher test masses and road loads will exaggerate the difference between the NEDC and the WLTP beyond what would be expected once vehicles are type-approved on the WLTP.
TNO report | TNO 2016 R11285 | 10 October 2016
27 / 29
The rolling resistance and the tyre choice are another issue more related to the NEDC than the WLTP. From independent testing and tyre-label information it is known that the tyres of production vehicles have a relatively high rolling 7 resistance. The rolling resistance from the type-approval documents is much lower. This results in a gap between the type-approval and real-world CO2 emissions of about 6-8 g/km on average. This issue is unrelated to the WLTP, because in the WLTP the rolling resistance of the tyres has to be accounted for in the declared CO2 value of the vehicle. Very likely it reduces the rolling resistance of production vehicles. The translation of the gap between the real-world performance and NEDC type-approval value to the difference of the WLTP and the NEDC is not realistic. Hence, the fair comparison is to compare independent test results of the same vehicle on NEDC and WLTP. From this comparison, it can be deduced that the change in the velocity and dynamics, i.e., the driving cycle combined with the cold start and the gear shift strategy makes little net difference for the CO 2 emissions. Furthermore, the test flexibilities actually removed in the WLTP test are only battery charging, tyre selection, tyre preparation, and test mass inertia classes. To summarize the effects on the basis of the NEDC-WLTP comparative testing: 1. With the same test mass, road load settings, and test execution, the NEDC and WLTP CO2 values are more or less the same. 2. The removed possibility of pre-test battery charging may result in 3-5 g/km higher CO2 on the WLTP. 3. The change in test mass consists partly of a removal of the NEDC inertia class flexibility of about 50 kg and 50-100 kg additional weight from the change in test procedure. This may lead to an additional few grams per kilometre CO2. 4. The current NEDC production vehicles will not likely be representative for the rolling resistance of the future WLTP type-approved vehicles. But even in this worst-case scenario, combined with a realistic increase in test mass on the WLTP, the resulting difference in CO2 emissions will not be more than a few grams per kilometre. Taking into account these findings a simple relation between NEDC and WLTP CO2 values has been established: 𝑔 𝐶𝑂2,𝑊𝐿𝑇𝑃 [ ] = 𝐶𝑂2,𝑁𝐸𝐷𝐶 + 0.05 ∗ ∆𝑀[𝑘𝑔] + 3 𝑘𝑚 Where: ∆M
is the difference in test mass [kg] between WLTP and NEDC.
0.05
[g/km·kg] expresses the sensitivity of the result to changes in test mass and is the combined effect of higher braking losses and additional rolling resistance.
3
[g/km] is the (lower range) of the effect of battery charging.
In all the testing one result remains consistent: for most vehicles the independent NEDC emission tests give results of about 20 g/km higher CO2 emissions than the 8 declared type-approval value of that vehicle . The tests are carried out with the road 7
TNO 2012 R10237 “Road load determination of passenger cars”, Gerrit Kadijk and Norbert Ligterink, 2012 8 Even though not investigated in full detail, the impression is that the difference has increased from the last time it was investigated (see footnote 1)
TNO report | TNO 2016 R11285 | 10 October 2016
28 / 29
load and test mass specified by the manufacturer for the NEDC test, and these aspects do therefore not contribute to the observed difference. If the type-approval test is a normative test, little variation is expected by the repetition of this test by an independent party. This is clearly not the case. Already from deviating in a minor sense from the NEDC test, such as running headlights and the stop-start system not engaging increases the gap by another few grams per kilometre. Also smaller than expected differences between an official NEDC test with a cold start and the same test with a hot engine suggest specific optimization for fuel consumption of the vehicles on the precise protocol of the NEDC. This suggests already a bias towards low NEDC test values in the comparison with WLTP test results. This bias must be kept in mind while comparing results. In the cases deviating results are found from the general expectation based on the underlying physical principles, they were often related to the NEDC test. Very likely the deviations find their origin in specific optimizations on the NEDC. The cold start effect is a typical example. The cold start will add in total 60-140 g CO2 to the average diesel vehicle emission, and 80-200 g to a petrol vehicle emission. If a lower result is found it is very likely the result of specific optimization on the coldstart NEDC, which makes the results of the warm and cold NEDC test of the same vehicle incomparable. The 20 g/km difference between the type-approval value and the independent tests is still for the greater part unknown flexibilities available for a new race to the bottom in CO2 type-approval testing, but then on the WLTP. The need for such a race to the bottom is likely to depend on the European CO2 targets and market development, which cannot be foreseen at present. If the inflated WLTP CO 2 values are taken into account in the translation from NEDC to WLTP, it may postpone the exploitation of flexibilities. If a manufacturer is on track to meet the European 95 g/km target in 2021, the introduction of the WLTP will mean the target can be met with reduced exploitation of test flexibilities. This available room will not be used to reach lower CO2 emissions, as this will limit the manufacturer’s negotiation room for the post-2020 CO2 targets. It will be kept as backup for the period after 2021 or can be used to shift toward different vehicle market segments with larger, heavier, and more powerful cars. The vehicles tested are all designed and optimized for NEDC type-approval. This is strongly supported by the findings that small deviations from the NEDC test protocol yield large increases in CO2 emissions. Typical NEDC optimizations might be less effective on the WLTP. With the forthcoming introduction of the WLTP, the vehicles will change. This may shift the test results towards lower WLTP values. Especially in the period 2017 to 2020 when the testing is based on the WLTP and the European CO2 targets are based on the NEDC the shifts in results may provide an indication in what sense the future CO2 type-approval values are the result of test optimization and what part will also affect the real-world performance.
TNO report | TNO 2016 R11285 | 10 October 2016
7
29 / 29
Signature Delft, 10 October 2016
TNO
Sam van Goethem Project leader
Norbert E. Ligterink Author