NeL2 : Network Drawing Tool for Handling Layered Structured Network Diagram Nagayoshi Nakazono1
Kazuo Misue2
Jiro Tanaka2
1
College of Information Sciences, 2 Department of Computer Science University of Tsukuba, 1-1-1 Tenoudai, Tsukuba, Ibaraki, 305-8573, Japan Email: 1
[email protected], 2 {misue, jiro}@cs.tsukuba.ac.jp
Abstract We propose a “layered structured network diagram,” which consists of layers of time differences. We have implemented a tool called “NeL2 ” for handling layered structured network diagrams. Layered structured network diagrams have multiple accumulated layers and are not single diagrams. Using this layered structure, time differences can be included in one diagram. In addition, various type of information, such as the overall tendency in a diagram during a specific period of time, can be visualized. We used layered structured network diagrams to show the co-authorship network of academic literature. Changes in the co-authorship network become visible using the layered structured network diagram. We can read various information such as changes of active research communities and other phenomena. In addition to co-authorship networks, the layered structured network diagram can be applied to the visualization of various data, such as idea processors, changes of Web sites, and others.
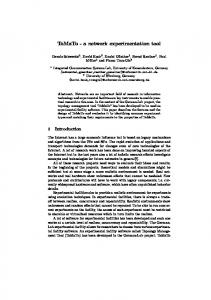
method expresses the sequence of differences as a layered structure. We developed a tool for handling such diagrams, named “NeL2 ” (Figure 1). Our expression method does not regard a network diagram as one figure, but instead as an accumulation of several layers. For example, if we want to refer to changes in networks during past year, all we have to observe is only the layer that expresses “the data of last year.” To view the transition over the last ten years, the changes piled up and the layers of the last ten years can be seen. In the same way, piling up all layers enables users to understand the present state of a network. Using a layered structure, it becomes possible to handle differences of network efficiently. In this paper, we defined layered structured networks mathematically and explained the tool NeL2 . We also used the co-authorship network of academic literature as an example for a layered structured network diagram. In addition, we hypothesized other kinds of applications.
Keywords: Visualization, Graph drawing, Time series network, Layered structure, Interactive system 1
Introduction
We propose a network diagram with a layered structure. This represents data that have the form of networks, such as organizational structures, computer networks, or co-authorships of academic literature. We often visualize such data in order to make easy to understand. Most network diagrams which visualized from these data represent the state of a network at a certain point in time (a snapshot). Therefore, several snapshots must be arranged and compared in order to determine “changes (differences)” over time, for example changed of the state of a network from last year until the present, or what is the change of the state of network in the past ten years. In addition, when using tools that show only one network diagram, users must create the difference from snapshots whenever we peruse network changes. We considered the evolution of a network that continuously changes as a sequence of differences. Our
c Copyright °2006, Australian Computer Society, Inc. This paper appeared at Asia-Pacific Symposium on Information Visualization (APVIS 2006), Tokyo, Japan, February 2006. Conferences in Research and Practice in Information Technology, Vol. 60. K. Misue, K. Sugiyama and J. Tanaka, Ed. Reproduction for academic, not-for profit purposes permitted provided this text is included.
Figure 1: Screenshot of NeL2 2
Related Work
Various approaches have been tried in research related to the visualization of evolving networks. Chen et al. proposed a technique that visualizes co-citation networks and evolutional process, targeting scientific papers (Chen & Carr 1999). Toyoda et al. developed the system WebRelievo, which visualizes the evolutionary processes of Web pages using difference views and cluster views (Toyoda & Kitsuregawa 2005). Erten et al. proposed a framework that arranges changing graphs in a line, piling it up three-dimensionally, and applied their framework to visualizing the relationship of scientific literature (Erten, Kobourov, Le & Navabi 2003).
In addition, there is a lot of research regarding the visualization style of network. Heer et al. developed a toolkit called “prefuse” in order to visualize interactively in various forms (Heer, Card & Landay 2005). Carlis et al. (Carlis & Konstan 1998) and Yee et al. (Yee, Fisher, Dhamija & Hearst 2001) expanded on former graph layouts and proposed an arrangement technique based on spirals or concentric circles. This different methods and techniques express changes in networks by keeping snapshots of networks at different points. By contrast, NeL2 pays attention to the differences between two points in time, not to states at different times. That is, we try a new approach; we keep the data as a sequence of differences and expresses the state of network at certain points by integrating the differences. 3
Expression of Network Diagram using Layered Structure
We introduce a layered structure to express network diagrams that change over time. Network data is managed separately as several layers, not as a single diagram, and each one depending on the update time. We display the data and color it in a flexible manner. This approach helps users to read large amounts of information from network diagrams. 3.1
Figure 3: Diagram before difference layer is added
Concept of Layered Structure
Our network diagrams which is handled by this research have a concept of layered structure as shown in Figure 2. The structure is similar to layers of transparencies (like OHP sheets). Updates for certain times are saved on individual sheets (layers), and subsequent updates which were done at next period are saved by piling a new layer on existing layers. Changes from each update are saved on each layer. Using the layered structure enables the following operations: • Network diagrams can be seen by stacking all layers between certain points. It is possible for us to trace the changes of a network; we can trace history in chronological order from past to future when we stack the layers, and we are able to trace history in reverse chronological order from future to past when we remove layer in sequence (Figure 3, 4, 5).
Figure 4: Difference layer
• We can see changes of the network in that point by perusing the optional layer independently. • We can see changes of the network in a certain period by stacking several layers.
Integrat e all layer and peruse
Integrate some layers
}
… Select one layer
Figure 2: Concept of layered structure
Figure 5: Diagram after difference layer is added
3.2
Advantage of Using Layered Structure
There are several advantages in using network diagrams with the layered structure. First, only a single network diagram is needed when using a layered structure. Previously, several diagrams must be arranged and compared to see the differences in a network. It is possible for layered structure to express these changes in one network diagram, because the network data is composed of “a gathering of differences” in information between layers. Existing methods of network visualization display differences made from all network data. On the other hand, NeL2 determines difference expressions at the data level and expresses all data by integrating these differences. This method is suitable for visualizing the evolution of networks. Second, layered structure makes the operation of network diagrams easy to understand and intuitive. We usually perform actions similar to those performed with a layered structure, for example “extract pp. 10–16 from stack of documents (papers).” In the same way the operation is possible even in the network diagram which uses layered structure. Third, layered structure helps users grasp the features of networks easily. Users cannot see changes over time in network diagrams that are not divided into layers, because all elements are indicated in one diagram simultaneously. By introduction of layered structure, users can change the indications of nodes and edges on every layer. 4 4.1
Definition of Layered Structure Graph
G = (N, E, ϕ), where N and E are a set of nodes and a set of edges, respectively. The function ϕ : E → N × N is the incidence function of edges. When ϕ(e) = (v, w), edge e is connected to nodes v and w. Layers
Layers express differences in the graph at different times. li is the ith layer from the bottom and is expressed as the following: li = (Ni+ , Ei+ , Ni− , Ei− , ϕ+ i ) where Ni+ and Ei+ are sets of nodes and edges added to the ith layer, and Ni− and Ei− are sets of nodes and edges removed from the ith layer. The function ϕ+ i is an incidence function of the set of added edges. The domain and range of this function are as follows: ϕ+ i
:
Ei+ → N 0 × N 0
N 0 = (Ni−1 ∪ Ni+ )\Ni− . 4.3
Gi−1 ⊕ li = Gi = (Ni , Ei , ϕi ), where Ni , Ei and ϕi are represented as below. G0 is an empty graph, which has no nodes or edges. (Ni−1 ∪ Ni+ )\Ni− (Ei−1 ∪ Ei+ )\Ei− E ½i →+ Ni × Ni ϕi (e) if e ∈ Ei+ ϕi (e) = ϕi−1 (e) if e ∈ Ei−1
Ni Ei ϕi
4.4
Accumulated Layers
The accumulation of layers is represented by ⊕. The operation of piling on top of the next layer on graph
= = :
Integrated Layers
The integration of a series of layers is also represented as ⊕ and is defined as follows. li ⊕ li+1 = (Ni+0 , Ei+0 , Ni−0 , Ei−0 , ϕ+0 i ), where Ni+0 , Ei+0 , Ni−0 , Ei−0 and ϕ+0 i are Ni+0 Ei+0 Ni−0 Ei−0 ϕ+0 i N 00
+ − (Ni+ ∪ Ni+1 )\Ni+1 + + − (Ei ∪ Ei+1 )\Ei+1 − (Ni− ∪ Ni+1 )\Ni+ − − (Ei ∪ Ei+1 )\Ei+ Ei+0 → N 00 × N 00 + − (N ∪ Ni+ ∪ Ni+1 )\(Ni− ∪ Ni+1 ) ½ i−1 + + ϕ (e) if e ∈ E i i ϕ+0 + i (e) = ϕ+ i+1 (e) if e ∈ Ei+1 .
4.5
In the layered structure which we propose, layers are accumulated in chronological order, and the network diagram represented by the layers is visible at each time. We considered a network diagram at each time as a graph, and express it as the following triplet:
4.2
Gi−1 , which is visible by piling up all layers to the (i − 1)th layer, is represented as follows:
= = = = : =
View of Layer
Changes in a network diagram can be seen by looking at only one layer. In the difference expression, the added and the deleted elements are drawn in different colors as a view of a layer. A colored graph Gc , which shows differences using colors, is expressed as following: Gc = (N, E, ϕ, γN , γE ), where N , E and ϕ are similar to the definitions for a graph G. The functions γN : N → C and γE : E → C specify the colors of nodes and edges. C is a set of colors. Here, only three colors are considered abstract colors: cn for unchanged nodes, ca for added nodes or edges, and cd for deleted nodes or edges. A colored graph Gc = (N, E, ϕ, γN , γE ), which is the view of layer li = (Ni+ , Ei+ , Ni− , Ei− , ϕ+ i ), is represented as follows: N Nu E ϕ ϕ(e)
= Ni+ ∪ Ni− ∪ N u = {v|(v, w) ∈ ϕi (E) ∨ (w, v) ∈ ϕi (E)} \(Ni+ ∪ Nii ) = Ei+ ∪ Ei− : E ½ →+N × N ϕi (e) if e ∈ Ei+ = ϕ (e) if e ∈ Ei− ( c i−1if v ∈ N u n
ca if v ∈ Ni+ − ½ cd if v ∈ N+i ca if e ∈ Ei = cd if e ∈ Ei− ,
γN (v) = γE (e)
where N u is a set of nodes that does not change in the layer and connects to edges changed in the layer. Because neither Ni+ nor Ni− include such nodes, a graph cannot be constructed with only a set of nodes Ni+ ∪Ni− . Therefore N u is used to construct a graph.
5
Implementation
We developed a tool called “NeL2 ”1 which displays and operates layered structured network diagrams in Java (JDK 5.0).
data format, there is the merit that past states are saved even if nodes or edges are deleted. 5.2
System of Data Operation
At the initial state immediately after loading, the XML document, all nodes and edges are visible re5.1 Data Format of Network gardless of the layers they belong to. We used sliders as an interface for the tool to We described the data representing a network diachange visible layers, so that users can operate netgram in the original XML document format. Data work diagrams intuitively, as shown in Figure ??. We formats used by existing network visualization techprepare three sliders; the two sliders on the right side niques have no concept of layers, unlike our technique. specify the range of visible layers, specifically the top Thus, we designed a new data format to express layer and bottom layers. User can appoint a layer which information. An example of network data with a layhe or she pays attention to (key layer) by using slider ered structure is shown in Figure 6. on left side. Then nodes and edges belonging to the ¶ ³appointed key layer are highlighted (colored red) on the network diagram. This function makes comparing the key layer and other layers easy. ..... ..... Jiro_Tanaka ..... 36 1 1983 Figure 7: Sliders ..... 6 Application to Visualize Co-authorship ..... Networks ..... Network diagrams with layered structure can be ap µ ´plied to various situations. In this section, we used this diagram to visualize co-authorship networks of scientific literature. Figure 6: Description example of the network data with layered structure in XML 6.1 Visualization of Coauthorship A layer element defines a layer. This element has Co-authorship networks of scientific research continan updated date with its ID because a network diuously change. Understanding these changes of coagram is updated each time when a layer is added. authorship networks can help explain changing cirA node element defines a node and corresponds to cumstances, trends for researchers or within research v ∈ N of the mathematical definition. The node elefields, and other things. ment has two attributes: its ID and the ID of the layer Many researchers have analyzed co-authorship the node belongs to. The element also has a label networks (Brandes & Willhalm 2002). For examelement and a position element that represent the ple, Yoshikane et al. studied global network analysis, label and the x-y coordinates of a node, respectively. which looked around the field of the whole research An edge element defines an edge that connects two area (Yoshikane, Nozawa & Tsuji 2005). nodes. It corresponds to e ∈ E of the mathematical Generally, co-authorship is analyzed quantitadefinition. The edge element has two attributes: its tively using mathematical techniques. However, in ID and the ID of the layer the node belongs to. The order to understand tendencies in network data, conelement also has from, to elements and label elejecture using visual diagrams is more convenient than ment, which represent nodes connected at both ends using mathematical formula. This kind of presumpand a label of an edge, respectively. tion suggests the result of analysis that follows afterNodes or edges can be deleted when the network wards, and helps analysis. Layered structured netdiagram is updated. In this case, node_event or work diagrams are useful in these kinds of cases. edge_event elements are added instead of modifying node or edge elements corresponding to deleted 6.2 Convert Co-authorship Network Data elements. These elements correspond to N − and E − of the mathematical definition, respectively. OperaWe used a co-authorship network for scientific pations to nodes and edges are recorded on these elepers, the Digital Bibliography and Library Project ments. When the tool draws a graph, these elements (DBLP)2 which is a scientific coauthorship database overwrite the nodes and edges themselves. Using this on the Web. We made the data for NeL2 using the 1 The name NeL2 results from the first (and second) letters of Networks, Layer, and Layout.
2
http://www.informatik.uni-trier.de/~ley/db/
Figure 8: Co-authorship network diagram
Figure 9: Change visible state of some layers
same technique as Misue (2005). On DBLP, approximately 350 thousand authors and approximately 880 thousand collaborative relationships were registered as of September 2, 2004. If a paper was written by authors A and author B, there was one relationship, and if a paper was written by three authors, there were three. With our application, authors were regarded as nodes, and co-authorship was regarded as as edge. We selected Jiro Tanaka, one of the authors of this paper, as the basis node, and searched for nodes within distance of two steps of him. Then, we extracted a sub-graph with 118 nodes and 535 edges. The layout was calculated on the basis of this data using another tool, and string manipulation of the data was performed with a script written in Ruby. As a result, the data was converted to an XML document that could be used in NeL2 . 6.3
Figure 11: Communities build up
Visualization using Layered Structure
This data was read and visualized by NeL2 , as shown in Figure 8. One layer corresponded to one year. The key layer, as indicated by the slider on the left side, was the latest year, 2004, automatically, just after the tool load the data. Also, all layers were visible, and the two right sliders indicated 1959, the oldest year, and 2004, the latest year, respectively. When looking at the network diagram with Jiro Tanaka as the basis node, relatively large clusters can be seen at the top, right side, and bottom. However, from this network view, we cannot understand which cluster was active or when it was active. Accordingly, we operated the two right sliders and limited the visible layers to only 10, between 1983, the year Jiro Tanaka was added, and 1992. The key layer was set to 1990 by operating the left slider as shown in Figure 9. Modifying indication doesn’t need complex operations, everyone can use it naturally with only simple explanations. The result of modifying indication is that the node for Jiro Tanaka connected to nodes belonging to the top cluster, but not to the bottom cluster. Thus, we can understand the following things about Jiro Tanaka: in the 10 years from 1983 to 1992 (which are visible), he worked closely with the community corresponding to the top cluster, while his connection to the cluster representing the bottom community has been relatively recent. When we set the key layer to 1990, many nodes located under the left were highlighted. This suggests that the community corresponding to this cluster under the left was very active during this period.
In addition, NeL2 can express the alteration of networks as motion by piling layers one by one in the old order by using the slider. At first, we adjusted all three sliders to 1959 (the oldest layer); only the data 1959 is indicated in the canvas. Next, we moved the central slider (indicating the topmost visible layer) upward, adding layers one by one in the old order. At early stages, world-renowned researchers appeared, and Jiro Tanaka appeared in 1983, as shown as Figure 10. As more layers were added, connections between Jiro Tanaka and world-renowned researchers formed, and communities, such as laboratories, were built up, as shown in Figure 11. These kinds of network changes can be easily perused using only the slider operation in the layered structured network diagram. As such, introduction of a concept of layered structure helps users to change the view of network diagrams easily, and it becomes possible for us to presume features of co-authorship networks. 7
Other Example Applications
Layered structured network diagram can be applied to the visualization of various kinds of data, not only the co-authorship of scientific papers. Several examples are introduced in this section. 7.1
Changes of Websites
Due to the spread of blogs and related tool, the number of people who have personal websites is increasing rapidly. Such sites are created, modified, or deleted on a day-to-day basis. Though much research has been done about visualization of the Web (Chi, Pitkow, Mackinlay, Pirolli, Gossweiler & Card 1998), NeL2 also can be applied here. By saving changes of websites on layers periodically, users can easily check the state of websites for any period, or how to strengthen or weaken relationships between sites. 7.2
Management Change Log of Visual Debugger
Zanden et al. developed a domain-specific debugger for one-way constraint solvers (Zanden, Baker & jin 2004). This debugger uses a dataflow graph and saves snapshots of each time and makes differences based on them. With NeL2 , this kind of differences indication reaches the point where it can be actualized by designating specific layers. Figure 10: Basis node Jiro Tanaka appears in 1983
7.3
Integration with Idea Processors
Idea processors are a category of software that assists in rearranging thoughts and documents, such as mind mapping3 . Some tools mark ideas as tags or nodes, rearranging and making relationships between them (connecting them with lines). Several such tools exist, which use as foundation mind mapping, KJ method, and so on. When tags are regarded as nodes and relationships are regarded as edges, we can consider that we make a network diagram. Using layered structured network diagram for some functions of idea processors, like save and play on, users can easily understand when tags (ideas) were designed or modified. Users can also see the evolution of ideas, since they are saved in chronological order using the layered structure. By the fact that this kind of past record management is introduced into the idea processor, it becomes easy to follow the arrangement and development of thought. 8
Conclusion and Future Work
In this paper, we proposed the notion of a layered structure for network diagrams and defined mathematically. We also developed a tool called “NeL2 ” which we developed to handle layered structured network diagrams. The tool uses layers as units expressing the changes of networks over time. In addition, it provides natural operations in order for obtaining intended diagrams. Using a layered structured network diagram, it has become possible to grasp various kinds of information, such as tendencies and processes of evolution, in networks. Visualization of the co-authorship of scientific papers was shown as an example application for NeL2 . A layered structure was used to visualize the changes of co-authorship networks with community formation and activity liveness shown explicitly. In the future, we intend to improve the drawing of the graph structure so that it appears to be truly in the form of a layer, as in Figure 2. We also want to replace the slider with an operation that allows users to choose a layer and make it visible by dragging it. We also plan to color differently not only the layer units, but also data related to a chosen node. We will design a usability test to see whether users like this kind of interface to clarify the properties and merits of this system. References Brandes, U. & Willhalm, T. (2002), Visualization of Bibliographic Networks with a Reshaped Landscape Metaphor, in ‘Proceedings of the 4th Joint Eurographics-IEEE TCVG Symposium on Visualization 2002’, pp. 159–164. Carlis, J. V. & Konstan, J. A. (1998), Interactive Visualization of Serial Periodic Data, in ‘Proceedings of the 11th annual ACM symposium on User interface software and technology’, ACM Press, New York, USA, pp. 29–38. Chen, C. & Carr, L. (1999), Visualizing the Evolution of a Subject Domain: A Case Study, in ‘Proceedings of the conference on Visualization ’99’, IEEE Computer Society Press, Los Alamitos, USA, pp. 449–452. Chi, H., Pitkom, J., Mackinlay, J., Pirolli, P., Gossweiler, R. & Card, S. K. (1998), Visualizing 3 A representative example is FreeMind (http://freemind.sourceforge.net/).
the Evolution of Web Ecologies, in ‘Proceedings of the SIGCHI conference on Human factors in computing systems 1998’, pp. 400–407. Erten, C., Kobourov, S. G., Le, V. & Navabi, A. (2003), Simultaneous Graph Drawing: Layout Algorithms and Visualization Schemes, in ‘The 11th Symposium on Graph Drawing’, pp. 437– 449. Heer, J., Card, S. K. & Landay, J. A. (2005), prefuse: a toolkit for interactive information visualization, in ‘Proceedings of the SIGCHI Conference on Human Factors in Computing Systems 2005’, ACM Press, New York, USA, pp. 421–430. Misue, K. (2005), Visual Destruction for Understanding Small-world Networks, in ‘Proceedings of HCI International 2005’ CD-ROM. Toyoda, M. & Kitsuregawa, Y. (2005), A System for Visualizing and Analyzing the Evolution of the Web with a Time Series of Graphs, in ‘Proceedings of the 16th ACM conference on Hypertext and hypermedia’, ACM Press, New York, USA, pp. 151–160. Yee, K. -P., Fisher, D., Dhamija, R. & Hearst, M. A. (2001), Animated Exploration of Dynamic Graphs with Radial Layout, in ‘INFOVIS’, pp. 43–50. Yoshikane, F., Nozawa, T. & Tsuji, K. (2005), Comparative Analysis of Co-authorship Networks Considering Authors’ Roles in Collaboration: Differences between the Theoretical and Application Areas, in ‘Proceedings of 10th International Conference of the International Society for Scientometrics and Informetrics. Vol.2’, pp. 509– 516. Zanden, B. T. V., Baker, D. & Jin, J. (2004), An Explanation-Based, Visual Debugger for Oneway Constraints, in ‘Proceedings of the 17th annual ACM symposium on User interface software and technology’, ACM Press, New York, USA, pp. 207–216.