Policies for Industrial Learning in China and Mexico: Neo-developmental vs. Neo-liberal approaches
K. P. Gallagher and M. Shafaeddin1
Abstract Previous work has shown that the results of both China and Mexico‘s export-led market reforms over the past quarter century have been strikingly different. In contrast to China, Mexico has not managed to increase the value added of its exports of manufactured goods and has subsequently had a difficult time competing with China in world markets. Building on this previous work, in this paper we conduct a comparative analysis of the role of government policies in industrial learning and the development of capabilities of indigenous firms in Mexico and China in order to shed light on why China is so outperforming Mexico. We find that Mexico and China have had starkly different approaches to economic reform in this area. Mexico‘s approach to reform has been a ―neo-liberal‖ one, whereas China‘s could be described as ―neo-developmental.‖ Mexico‘s hands-off approach to learning has resulted in a lack of development of endogenous capacity of domestic firms, little transfer of technology, negligible progress in the upgrading of industrial production, and little increase in value added of exports. By contrast, China has deployed a hands-on approach of targeting and nurturing domestic firms through a gradual and trial and error led set of government policies.
1
Kevin P. Gallagher is an assistant professor in the Department of International Relations at Boston University and Research Associate at the Global Development and Environment Institute, Tufts University, USA (
[email protected] ). Mehdi Shafaeddin is a development economist affiliated with the Institute of Economic Research, University of Neuchatel, Switzerland and former head Macroeconomics and Development Policies Branch, UNCTAD. He can be contacted at M.
[email protected] .
1
Introduction There are striking similarities between China and Mexico‘s economic development over the last quarter century. There are also significant differences. Like Mexico, China‘s economic model was not performing and there was a need for economic reform and export promotion. Like Mexico, China was a one-party state during the period of reform (Mexico democratized in 2000, however). Like Mexico, China has sought to attract foreign direct investment (FDI) into manufacturing and high technology sectors to gain access to technology. Both countries have expanded export of manufactured goods, particularly in high or information technology industries (IT hereinafter).
As we will see, this is where the similarities end. China‘s annual average per capita growth rate has topped 8 percent over this period, where Mexico‘s has been barely over one percent. China‘s annual average growth rate in manufacturing value added has been well over ten percent since 1980, whereas Mexico has been closer to 3 percent. China is becoming the manufacturing powerhouse of the world economy and an increasing source of innovation, moving up the technology ladder from assembly-based manufacturing activity.
In Mexico manufacturing remains at the low end of the
technology ladder and is losing its competitiveness relative to China (Gallagher and Porzecanski 2008; Gallagher, Moreno-Brid, and Porzecanski 2008; Pizarro and Shafaeddin 2007; Dussel Peters 2005, 2007) . We show that Mexico‘s performance is in part a function of a neo-liberal mindset that sees a very limited role for the state while integrating into the world economy. China on the other hand, followed a pro-active strategy for its globalization pursuits. Mexico‘s route to international integration has
2
come at the expense of industrialization and learning, China‘s pro-active approach has made it the manufacturing powerhouse of the world economy.
The purpose of this paper is to examine the extent to which government policies toward industrial learning for enhancing value added in exports and subsequent development have differed in the two countries over the past quarter century. The paper is divided into four parts in addition to the introduction. Following this brief introduction Part I is a short literature review on industrial learning. Part II examines the cases of Mexico, Part III analyzes China. Part IV summarizes our main findings and draws lessons for research and policy.
I. The role of learning in industrialization
Regardless of the theoretical framework deployed, the role of learning in capacity building is seen as paramount for industrial development. Yet, the literature has two poles. On one end, the proponents of governments playing a strong role in industrialization stress ―learning-by-doing". By contrast, those in favor of market-led industrialization believe in the contribution of ―learning through trading‖.
A neo-developmentalist approach argues that it contributes to industrialization through ―learning-by-doing" and experience. By contrast, neo-classical or neo-liberal approaches argue that industrialization come from ―learning through trading‖. The basic difference between the two is that the first group favors government intervention, while
3
the second one argues for the operation of market forces without government interference.
In the neo-classical theory of international trade, technological knowledge and information is freely available, diffusion knowledge is costless, instantaneous and automatic; there is no significant learning process and its development of technology is riskless. All markets are competitive, comparative advantage is determines by factor cost. As the existence of increasing return and barriers to entry are assumed away, there is no need, for the late-comers, to invest in human capital and to intervene in the market to promote knowledge intensive products which are produced by established firms. Further, there are no static or dynamic externalities. Production costs in different products are not interdependent; there are no spill-over effects. Similarly, there are no inter-temporal relations between present income/costs and future income/costs as experience has no place in cost/income determination. In nutshell, as there is no market and institutional failure, there is no need for any policy intervention.
The importance of learning and knowledge accumulation has been emphasized in the post-war and modern theoretical and empirical literature since the publication of the pioneering article on learning-by-doing by Arrow (1962). To him, the acquisition of knowledge is products of experience which grows in time. The need for government intervention in learning by doing is articulated in "capability building theory". The theory of capability building (TCB) is built on the infant industry argument of Frederick List according to which ―mental capital‖, or the accumulation of knowledge and experience,
4
is regarded as the main element of ―productive power‖ [development] and industrialization. Industrialization in newcomer countries would not take place according ―to the natural course of things‖ (through the operation of market forces alone) and government policies should aim, inter alia, at learning at both the industry and country levels (see Shafaeddin 2005: 50 for details)1. The importance of learning and experience in industrialization has been also emphasized by (Linder 1961; Krugman 1984; Nelson and Winter 1982) and others.
The theoretical and empirical literature on TCB theory is vast2. One strand, the evolutionary theory of TCB, is most relevant for developing countries. The evolutionary version of TCB draws not only on the infant industry argument but also on the evolutionary theory of change (Nelson and Winter 1982) and new growth theory (see: Lucas 1988; Romer 1986, 1987). Scholars3 of this version of TCB regard technological capabilities (learning) and technology absorption and diffusion, as the backbone of industrialization and international competitiveness (e.g. Teubal 1987). They define technological capabilities (TCs) in a very broad sense at all levels of activities of firms (i.e. beyond the technique of production) "as the information and skills - technical, organizational and institutional-that allow productive enterprises to utilize equipment and information efficiently" [italics added] throughout the value chain (Lall 1993: 7). Evolutionary theory also considers the interaction of a firm with other firms and the external environment in obtaining inputs, in the sale and marketing of its products, and particularly in the innovation of new products and processes.
5
In contrast to neoclassical theory, under TCB technology is not freely available; the market fails to develop technological capabilities automatically due to reasons of dynamic externalities and linkages, lack of information, uncertainties, risks and missing and malfunctioning markets. Technological learning involves costs and takes time. It does not take place instantaneously because the required learning is a long, costly and evolutionary process. It requires purposeful efforts by enterprises as well as government to pursue policies for capability building through R&D, development of knowledge and organizational change, particularly at early stages of industrialization (Schmitz and Hewitt 1991: 190; Teubal 1996: 449; Moore 1997: 516). Government policies should be both functional and selective. Selective and targeted intervention is, in particular necessary because learning is technology specific, firm specific and activity specific, and technologies differ in their tacit features and externalities (Lall 2005). Further, all activities and industries can not be developed at the same time because of the scarcity of skills and other resources (Shafaeddin 2005).
R&D for development of domestic technological capabilities and upgrading is the backbone of the TCB. R&D is seen as being so important that even some neoclassical economists advocate direct subsidization of knowledge acquisition and R&D (Baldwin 1969). The experience of many developing countries with traditional import substitution indicate that learning from experience alone is not sufficient for building-up necessary technological capabilities; appropriate policies are required to overcome market failures constraining development of technological capabilities 4 (Bell, Ross-Larson, and Westphal 1984). In fact, in the case of Asian NICs, government policies and close cooperation
6
between the government and the private sector were crucial in promoting technological capabilities for industrialization and upgrading and for remedying the related obstacles (see e.g. Lall 2005).
In the age of globalization government action to enhance firm‘s capabilities to achieve competitive advantage becomes more important than before because the minimum entry barriers and skill requirement have become higher and risks involved in entry of firms of developing countries into new activities has increased (Archibugi and Michi 1997: 121; Shafaeddin 2005; Lall 2005). FDI may provide certain skill and marketing channels for exports. Further, it is argued that when an economy opens up to trade and FDI, an initial period of imitation will lead to a large catch-up opportunity followed by a shift towards innovation ―as the knowledge gap is reduced and the economy‘s technical maturity rises‖ (Elkan 1996). However, a test of the impact of FDI on the industrialization of a developing country is its impact on development of local capabilities through spillover channels of demonstration effects, training effects and linkages effects (Paus 2005). Such capabilities can be influenced, inter alia, by learning, experience, skill development and the accumulation of knowledge by the labour force of the host country. Generally speaking the findings of literature on the spillover effects of the FDI on the host country is mixed (for a comprehensive review of this literature see: Görg and Greenaway 2004).
While learning and technological development are firm specific, they are also activity specific. For example, ―the learning curve differs across quite similar products
7
such as distinct types of memory chips‖ (Gruber 1992: 885). IT industries which started through assembly operation in both Mexico and China are both supply dynamic and demand dynamic. They are supply dynamic because they can provide important linkages with other industries and their learning effects in the economy. They are demand dynamic because international trade in these products has been expanding rapidly during recent decades. Therefore, while looking at the general process of processing industries in Mexico and China, we will, in particular, look into development of these industries. Our aim in this paper is to investigate what policies have contributed to the success of China in knowledge accumulation necessary for enhancing local value added in exports which have been absent in the case of Mexico. R&D will be of our main focus although some other contributing factors to development of capability of local firms will be discussed as well.
II. From Learning to Hoping: Mexican Industrial Strategy under NAFTA
Mexico‘s industrial strategy has been radically transformed over the past quarter century. The goal has remained the same: ―catch-up‖ with the industrialized world in industrial technologies and capabilities. However, the means have changed. Up until 1984 the core of meeting the nation‘s objectives centered around a government-led model of learning, since that time the core means to industrialization has been market-led. This section of the paper shows that whereas in the first period Mexico actively pursued the development of technological capabilities through government policy (though not very successfully), in recent decades government policy has been restricted to creating an
8
environment for foreign investment and hoping that FDI would bring technological know-how that would automatically spill over into the broader economy. Mexico had an advantage over China in having privileged market access to the USA through NAFTA since 1995.
Over both periods Mexico has certainly aimed at becoming an industrialized country. Mexico has diversified away from an economy primarily based on primary products, has received unprecedented amounts of FDI, and has significantly boosted exports. However, these inroads have come at considerable cost. Mexico has become plagued by a lack of linkages between foreign firms and the domestic economy, painfully low levels of technological capacity building, low valued added in exports of maquilladora sector, an overdependence on the United States as a chief export market, and a lack of competitiveness vis- a- vis China.
ISI and Industrial Learning
In Mexico and elsewhere, the tools of ISI focused on a number of key policies, including major public investment in infrastructure; import tariffs, licenses, and quotas to buffer domestic firms and enhance their technological capabilities; exchange rate controls, and direct government investment in key sectors (Fernández 2000). Through this process, Mexico attempted to create ―national leaders‖ in the form of key state owned enterprises (SOEs) in the petroleum, steel and other industries. These sectors were linked to chemical, machinery, transport and textiles industries that also received
9
government patronage (Baer 1971; Amsden 2000). Indeed, in the first decades after World War II, these sectors received over sixty percent of all investment, public and private (Aguayo Ayala 2000).
In addition to SOEs and state patronized private industries, Mexico established export-processing zones called maquiladoras in the mid-1960s. Maquiladoras are ―inbond‖ assembly factories where imports of unfinished goods enter Mexico duty-free provided that the importer posts a bond guaranteeing the export of the finished good. Many maquiladoras are located in the U.S.-Mexico border region and include electronics and non-electrical machinery, much of the automotive industry, and apparel. The SOEs, state patronized private enterprises, and maquiladoras supplied growing internal and external markets for their production.
From the beginning of World War II until the early 1980s, this strategy had mixed results well in Mexico. In terms of income growth, this period is often referred to as Mexico's "Golden Age." During this time the economy grew at an annual rate of over 6 percent, or over 3 percent in per capita terms (Cypher 1990). What‘s more, public investment appeared to crowd-in private investment. According to one study examining the period 1950 to 1990, for every ten percent increase in public investment there was a corresponding bump in gross private capital formation of 2-3 percent (Ramírez 1994).
To some extent, policies geared toward buttressing domestic firms from foreign competition resulted in the learning of complex manufacturing capabilities and the
10
creation of some industries and firms that still exist today. However, the policies were not geared toward the penetration of foreign markets and therefore the learning that was occurring in the country was not at the technological frontier and could not benefit from a process of learning by competing. Finally, the protective support for industrial learning was not given a well-defined end date and therefore did not provide the incentive for firms to get ready to compete in global markets (Fernández 2000). The results were therefore uneven, as we will see in Figure 1.
Market-led Industrialization During late 1970s-early 1980s, much of the industrial development strategy was financed through oil revenue (or borrowing against expectations of future oil revenue), the Mexican government and private sector embarked upon a period of virtually gluttonous borrowing and public spending. The borrowing binge, coupled with a fixed nominal exchange rate, generated a large external debt, as well as rising inflation, growing real exchange rate appreciation, and renewed current account deficits (Kehoe 1995). From 1970 to the early 1980s, Mexico‘s foreign debt rose from $3.2 billion to more than $100 billion (Otero 1996). When oil prices suddenly dropped in 1982, a time of high world interest rates, Mexico announced that it was unable to meet its debt obligations—a ―watershed event‖ for most developing countries (Rodrik 1999). A major devaluation plunged Mexico into economic crisis.
In response to the crisis, Mexico abandoned its state-led industrialization strategy for a market-led one.
Influenced by international institutions and a rising level of
11
domestic constituents frustrated with past policy, in response to this crisis Mexico completely re-oriented its development strategy after 1982 crisis. The most decisive changes came under President Carlos Salinas de Gortari (1988 to 1994).
Salinas
articulated three over-arching goals: 1) achieve macroeconomic stability, 2) increase foreign investment, and 3) modernize the economy (Lustig 1998). As in the past, the heart of the plan lay in the manufacturing sector. By opening the economy and reducing the role of the state in economic affairs, Mexico hoped to build a strong and internationally competitive manufacturing sector.
Meeting these goals required a top-to-bottom revamping of Mexico‘s foreign and domestic economic policies. From 1985 to the present Mexico has signed over 25 trade or investment deals, with the NAFTA as the capstone (Wise 1998). To make investments less cumbersome for foreign firms, Mexico also reformed its technology transfer requirements. During the ISI period, Mexico‘s ―Technology Transfer Law,‖ was geared toward strengthening the bargaining positions of the recipients of foreign technology. All technology transfers had to be approved by the Ministry of Trade and Industrial Promotion, which monitored the extent to which technology transfer could be assimilated, generated employment, promoted research and development, increased energy efficiency, controlled pollution, and enhanced local spillovers. In 1990, this was dismantled with a new technology transfer law relinquishing all government interference in the technology process to the parties involved in FDI. Government-enforced conditions on technology transfer were phased out, and technology agreements no longer needed
12
government approval (but must be registered). Moreover, the law now contains strict confidentiality clauses (UNCTC 1992).
These trade and investment policies set the stage for FDI in the manufacturing sector to be the engine of Mexican development. There were also changes in domestic policies in order to align the manufacturing sector with the new, neo-liberal macroeconomic, trade, and investment policies. In a marked split from the past, Mexico‘s overarching approach to industrial policy took a ―horizontal‖ approach. Rather than targeting a handful of firms and industries as it had done under ISI, the state was to treat all firms and sectors equally without preference or subsidy. In a horizontal fashion, the state liberalized imports along with exports, phased out subsidies and price controls, and privatized all but a handful of SOEs (Dussel Peters 1999, 2003).
Performance of the new strategy The performance of industrial development in Mexico has been uneven, at best. On the positive side Mexico has diversified away from primary products, upgraded the sophistication of some of its manufacturing export sectors, and increased the level of exports and investment. On the other hand there has been very little technological learning for the majority of domestic firms, nor has there been linkage between the maquiladora manufacturing enclaves and the rest of the economy. What‘s more, Mexican manufacturing has become dangerously linked the US economy where it is losing competitiveness to China.
13
Indeed, Mexico has transformed itself from a primary products-based to a more diversified economy. In 1940, agriculture was 22 percent of total output. By the early 1970s, agriculture had shrunk to less than 10 and in 2005 was just 4 percent of GDP. In 1940 manufacturing was 17 percent of GDP then reached a peak of 26 percent in 1987 and was 18 percent in 2005. The services industry was 50 percent of GDP in the 1960s and close to 70 percent in 2005 (Reynolds 1970; World Bank 2008).
There has also been significant diversity within manufacturing and industrial upgrading within many sectors. Table 1 exhibits the top 10 Mexican Exports in 1980, 1990 and 2005. Although petroleum is the lead export in each period the composition of the rest of the top 10 is quite different in 2005 than in 1980. By 2005 all of the top 10 exports (which comprise approximately 75 percent of total exports) except petroleum are manufactures. Table 1 Mexico's Top 10 Exports to the World 1980
1990 Product
Rank 1 2 3 4 5 6 7 8 9 10
Petroleum Natural Gas Fruit and Vegetables Nonferrous metals Coffee, tea Fish Motor vehicles textile fibers Inorganic chemicals Matalliferrous ores
Petroleum Motor vehicles Power generating machinery Fruit and Vegetables Nonferrous metals Iron and steel Electrical machinery Organic chemicals Office machines Miscellaneous manafuctures
Source: United Nations
14
2005
Petroleum Motor vehicles Telecommunications equipment Television receivers Motor vehicle parts Office machines Electricity distribution equipment Lorries Electrical machinery Electrical circuits
The volume of trade and investment has been significant as well. Real exports between 1980 and 2007 increased by a factor of ten and FDI as a percent of GDP has increased by a factor of 3 and is close to $20 billion each year (third only to China and Brazil in term of FDI inflows to developing countries) (World Bank 2008; UNCTAD 2008). The majority of exports and FDI has been in the manufacturing sector, with electronics and the auto sectors as the leading sectors.
Finally, there has been some scattered use of advanced technology and processes within the manufacturing sector, chiefly in the maquiladoras. Researchers drawing on the experiences of Delphi and General Motors, depict two other ―generations‖ of maquiladoras in these firms that followed the first generation described above. From 1982 until NAFTA, MNCs in the maquila industry developed a higher level of technological sophistication and automation, a somewhat more autonomous level of decision-making relative corporate headquarters, and a relative increase in the number of Mexicans in MNC management tiers. In terms of work organization, the gender mix became a bit more balanced and work was performed in a team atmosphere rather than in traditional assembly. These firms experienced a ―third generation‖ of innovation in the post-NAFTA period and are characterized where clusters are formed around technical centers, assembly plants, suppliers of components, and suppliers of services. There was also a greater level of technological development, with an increasing amount of higher skilled work, and engineering capabilities (Carrillo and Hualde 2002).
Despite improvements in diversification, sheer volume of exports and FDI, such benefits have come at considerable cost. Rather than spurring technological transfer and
15
R&D activities, such transfers have shrunk considerably.
FDI has been heavily
concentrated by industry and region, is characterized by a growing gap between productivity and wage growth, has limited linkages with the rest of the Mexican economy (Shafaeddin and Pizarro 2007; Puyana and Romero 2006; Dussel Peters 2008).
In a
large study covering 52 Mexican industries, Romo Murillo (2002) finds that foreign presence is negatively correlated with backward linkages. Other econometric analyses that looked broadly at the effects of FDI on the Mexican economy between 1970 and 2000 found that investment liberalization was significantly correlated with increases in FDI and subsequent exports, but also led to a higher incidence of imports and the displacement of local firms (Dussel Peters, Lara, and Gomez 2003), and crowding-out of domestic investment (Agosin and Machado 2005).
Rather than increasing the amount of R&D, FDI has been negatively correlated with R&D. R&D expenditures fell by the top twenty foreign firms—from 0.39 percent of output in 1994 to 0.07 percent in 2002 (Dussel Peters 2008). Technological decisions for MNCs operating in Mexico are largely made in company headquarters far from Mexico, where technological developments occur and largely stay (Unger and Oloriz 2000). A major assessment of FDI and R&D and innovation systems in Mexico concluded that
―technological developments occur mainly in the home bases of MNCs and only a small portion is transferred to Mexico. This process ensures, on the one hand, that Mexico participates actively in the globalization of production, and on the other hand, that its participation in the globalization of scientific and
16
technological activities is very poor. As companies transfer only some of their R&D to Mexico…..the present concentration of corporate R&D will by and large lead to an even stronger international divergence of technological development.‖ (Cimoli 2000: 280).
The assessment attributes the poor performance of Mexico‘s FDI and trade-led learning strategy as due to: a very weak institution response by Mexico‘s fledgling innovation system; low levels of interaction between manufacturing sectors and local institutions (finding that public sector or universities were not collaborating with firms); low levels of technological capacity and coordination among universities.
The assessment characterizes Mexico as having a ―maquila innovation system.‖ This is a system that imports technology and equipment and hosts networking activities by MNCs in a manner divorced from the broader economy. The result has been that knowledge and technological advances are kept in developed economies. Imported inputs led to replacement of the learning capabilities that could be built in domestic suppliers of equipment and a virtual wipe out of many of the firms that had capabilities before reforms. And, for the personnel working on the limited amounts of R&D, they are doing so solely within a global MNC network largely divorced from interaction with domestic universities and research centers (Cimoli 2000).
17
Figure 1: Mexican Technological Capabilities Production capacity, competitiveness and sectoral linkages
International competitiveness (market shares of larger exporting items) Production capacity of large exporter firms
Firms and sectoral domestic linkages
Technological capabilities
Modernization and improvement of production processes
Product quality of exporting firms (standards, certifications)
Domestic imitation capabilities of new products
ISI period A model of intensive protection Local technological capabilities Industrialization and increasing manufacturing production Production addressed to domestic market
Transition period The abandonment of the ISI pattern Economic crisis; demand contraction, large devaluation, trade balance deficit Opening process of the Mexican economy First stage of liberalization
New regulatory framework and NAFTA Exchange-based stabilization programme; trade and financial reform and public deficit control are implemented Export increasing, flat competitiveness in large firms
Source: (Cimoli 2000: 286)
These findings are depicted in the two graphs in Figure 1. The top graph exhibits production capacity, competitiveness, and sectoral linkages. During the ISI period there was considerable growth in firms sectoral domestic linkages and an upward trend in the 18
international competitiveness and production capacities of larger exporting firms. During the transition period out of ISI the international competitiveness and production capacities of large firms skyrocketed while the linkages between these exporters and local firms began to diminish in favor of imported inputs. In the post-NAFTA period the level of competitiveness and capacity reach a plateau and flatten (albeit at a high level).
Cimoli‘s assessment reaches a similar conclusion in terms of technological capabilities, as seen in the second graph. Here, during the ISI period there was a great deal of domestic firm imitation and innovation of technologies, but these capabilities diminished throughout the reform period as larger foreign export firms (namely maquiladoras) increasingly imported technology. The imported technology did lead to an improvement of production processes and the product quality of exporting firms, which is now at the world technological frontier—albeit due to MNC decisions outside of Mexico.
More recently, the gains in trade and investment flows have become jeopardized. Throughout this transition Mexico has become increasingly reliant on the US economy. By 2005, 86 percent of all Mexican exports were destined to the US and 54 percent of all Mexican imports were originated in the US. Thus, when the US economy slows down the Mexican economy follows.
Perhaps of greater concern is the fact that Mexico is losing its competitive foothold in the US economy despite its close proximity and favorable tariff access. Two separate studies examined the extent to which Mexican exports were under ―threat‖ in the
19
US economy. Threat was defined as whether a sector was losing market share in the US while China was gaining or gaining market share in the US while China gains faster. In 2005, more than 53 percent of all Mexican exports are under some kind of threat and 97 percent of all Mexico‘s high technology exports (representing 24 percent of all Mexican exports) were under threat (Gallagher, Moreno-Brid, and Porzecanski 2008; Gallagher and Porzecanski 2008). Indeed, many MNCs are now moving from Mexico to China. A recent study shows that Mexico has now become ―proximity dependent.‖ In other words, Mexico is not attracting any new foreign investment in sectors or regions that are not strategic for re-export to the United States (Sargent and Matthews 2007, 2008).
Case in Point: High Tech Exports Mexico‘s FDI-led industrial development strategy is epitomized in the high technology electronics sector. Built-up during the ISI period, Mexican electronic firms were virtually eliminated after trade liberalization and replaced by a foreign enclave economy with little linkages, R&D, or partnerships with universities beyond process innovation. Now, those foreign firms are struggling to compete with China‘s capabilities, even in the US market.
Mexican endogenous capacities for high tech manufacturing were seeded and cultivated by ISI policies from the 1940s to the 1980s. Mexico‘s larger size allowed it to promote the development of domestic IT sector during the ISI period, a sector that became relatively vibrant by the 1980s. Mexico‘s high-tech antecedents date as far back as the 1940s, when – under ISI protection - national companies began to manufacture
20
radios and radio components. From the 1950s until 1980 Mexican firms manufactured televisions and related parts as well. The government targeted the computer industry in the late 1970s as part of the strategy of the National Council on Science and Technology (CONACYT) to increase Mexico‘s national self-sufficiency in technology. CONACYT established the PC Programme (Programa de Computadoras) to develop a domestic computer industry (supported by the surrounding electronics industry) that could not only serve the domestic market but also emerge as a key exporter for Mexico.
MNCs were limited to 49 percent foreign ownership of firms in the sector. They had to invest between three and six percent of gross sales into R&D and create research centres and training programmes. And domestic parts and components had to account for at least 45 percent of value added for personal computers and 35 percent for minicomputers. New Mexican-owned firms could receive fiscal credits and low interest loans from government development banks. In search of domestic markets and export platforms, the foreign firms that came were IBM, Hewlett Packard, Digital, NCR, Tandem and Wang. IBM and Hewlett Packard were the leaders and accounted for 63 percent of all computer production. The other foreign firms were responsible for approximately 18 percent, and wholly-owned Mexican firms made up another 18 percent.
The hub of high technology exports became the western state of Jalisco (specifically the Guadalajara city region) and other regions of the country where these firms became concentrated were on the US-Mexico border region (TV monitors), and surrounding Mexico City (electronic appliances). Guadalajara was the ideal region for
21
high-tech FDI, as it had lower wages and weak unions, proximity to the US, low tariffs, and five major universities and numerous technical schools and industrial parks that can host research activity and graduate an adequately skilled workforce (Gallagher and Zarsky 2007).
What‘s more, the government adopted a number of policies to attract MNCs to Mexico. At the national level, one program (called PITEX) allows firms to import their inputs duty-free as long as more than 65 percent of their output is exported (Dussel Peters 2003).
The Jalisco state government supplemented these federal programs with a
regional plan to attract firms and suppliers.
The state‘s Economic Promotion Law
reduced or eliminated state and municipal taxes for firms that located to the region. In addition, the Guadalajara branch of the national chamber of commerce for the IT industry,
CANIETI
(Camara
Nacional
de
la
Industria,
Electronica,
de
Telecomunicaciones e Informatica) works to attract large MNCs to the region and puts on numerous trade shows and workshops on the industry. A more regional organization named CADELEC (Cadena Productiva de la Electronica) was founded in 1998 with funding from CANIETI, the United Nations Development Programme, and two other federal agencies. CADELEC‘s mission is to match suppliers with the large MNCs (CADELEC 2004; Palacios 2001).
The laissez-faire strategy was a success—at least in terms of attracting investment and increasing exports. Between 1994 and 2000, foreign direct investment in the electronics sector grew by five times and the value of exports quadrupled.
22
At their
peaks, exports from Mexico‘s electronics sector totaled $46 billion in 2000, and FDI inflows totaled $1.5 billion in 1999.
By 2000, IT was a key component of the Mexican manufacturing economy, accounting for nearly 6 percent of manufacturing output, 27 percent of all exports, 9 percent of employment, and 10 percent of FDI.
Electronics are Mexico‘s largest
manufactures export, and are second only to autos in terms of manufacturing GDP and employment (Dussel Peters, Lara, and Gomez 2003).
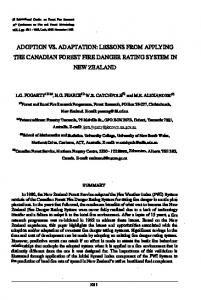
Fuelled by large FDI inflows, Mexico‘s IT industry became increasingly competitive during the second half of the 1990s. Mexico‘s share of world IT exports ballooned from eight-tenths of one percent in 1985 to three percent in 2000 (Dussel Peters, Lara, and Gomez 2003). By 2001, Mexico was the 11th largest exporter of IT products in the world economy. However, as shown in Figure 2, Mexico‘s competitiveness and concentration in high tech exports began to flatten then decline, particularly when compared to China‘s.
23
Figure 2. Hi-Technology Exports/Manufactures Exports 35
30
China 25
20
Mexico 15
10
5
0 YR1992
YR1995
YR1998
YR2001
YR2004
Source: (World Bank 2008)
Evolution of domestic firms Unlike China, rapid MNC-led growth came at the expense of Mexico‘s domestic IT firms, which were virtually wiped out. The domestic high tech industry is nearly extinct, and few domestic input producers have become integrated into the global production chains of the IT MNCs operating in Mexico. Between 1985 and 1997, the number of indigenous electronics firms in Guadalajara declined by 71 percent (Rivera Vargas, 2002). As shown in Table 2., 13 of the 25 indigenous electronics firms that were still in existence at the end of 1997 had been closed by 2005 (Gallagher and Zarsky 2007; Sargent and Matthews 2007, 2008) Indeed, signs were already evident as early as 1998,
24
when the Economic Commission for Latin America and the Caribbean concluded that industrialization in the electronics industry had become almost completely ―internationalized‖ and was beginning to resemble a ―parallel economy‖ that had very few linkages in Mexico (ECLAC 1999). Since then, the literature has been quite extensive and too large to cover in this paper, but key contributions are two large edited books by Enrique Dussel Peters (Dussel Peters 2003, 2004), and a volume by Rivera Vargas (2002).
Table 2
IT Plant Closings--Whole or Partly Owned Mexican Firms Firm Cumex Electronics Mitel Phoenix International Encitel Info Spacio Logix Computers Mexel Unisys Electron Scale Computers Advanced Electronics Compuworld Microtron
Ownership (percent)
Activity
50/50 Mex-US 51/49 Mex-Canada 50/50 Mex-US 100 Mex 100 Mex 100 Mex 100 Mex 100 Mex 100 Mex 100 Mex 100 Mex 100 Mex 100 Mex
CM of PCBs Telephone Components Plastic Injection CM of PCBs CM of printers Design and manufacturer of PCs CM of PCBs CM of computers and peripherals Design and manufacturer of PCs Design and manufacturer of PCs Design and Manufacturer of PCBs CM of hard drives Buffers and Carton Packages
Source: Woo (2001); Rivera Vargas (2002); author interviews
(Rivera Vargas 2002; Woo 2001)
The linkages between foreign high tech firms and national firms is even more dismal than the national average. Most of the MNCs are working with local firms that
25
supply cardboard boxes, shipping labels, cables, wires, and disposal services.
This
finding suggests that although the share of national inputs has increased - though it still remains very small (at less than 2 percent of all inputs) and the composition of those inputs has changed from national high-tech firms to national shipping and disposal firms (Gallagher and Zarsky 2007).
Table 3 China vs. Mexico in World IT Markets Computers
Peripherals
Telecom
(country exports as a percent of world exports)
China 2000 Market Share 2005 Market Share Percentage Point Change
6.0 28.8 22.8
4.0 15.7 11.7
5.7 18.3 12.6
4.5 3.5 -1.0
2.2 1.2 -1.0
5.2 3.5 -1.7
Mexico 2000 Market Share 2005 Market Share Percentage Point Change
Table 3 compares Mexico and China in world high technology markets. In 2000—the year before China entered into the WTO—Mexico and China enjoyed global market penetration in computers, peripherals, and telecommications at similar orders of magnitude. In just five y ears China captured 15-29 percent of global high tech markets whereas Mexico lost competiveness in each case (Gallagher and Zarsky 2007).
26
In response to competitive pressure MNCs in Mexico have been upgrading their product mix. For the most part, they have been able to redirect their generic manufacturing capacities to other products and clients. Jabil Circuit, for instance, shifted production to communications switches, specialized hand-held credit card processing machines, Internet firewalls, and electronic controls for washing machines. Solectron is assembling components for mainframes and AX-400 conductivity transmitters. SCISanmina now assembles MRI scanners for Phillips and electronics auto components for Ford and GM. Not all of the MNCs were able to upgrade with this agility, and even in such a ramp up national firms continued to be out in the cold. Indeed, most of the CMs have resorted to internet based open supplier bidding and the winners are other foreign firms (Gallagher and Zarsky 2007; Sargent and Matthews 2007, 2008). Mexico is also loosing grounds to China in ―non-proximity [to USA market] dependent ,technology intensive EPZ manufactures‖ (Sargent and Matthews 2008).
In short, during in the 1990s Mexico was a poster child for neo-liberalism, throwing open its borders to trade and foreign investment, embracing NAFTA, and ending the government‘s role in fostering industrial learning. The evidence shows that although Mexico was initially successful in attracting multinational corporations, foreign investments waned in the absence of active government support and as China became increasingly competitive. Moreover, the FDI-led innovation and growth strategy created an "enclave economy" the benefits of which were confined to an international sector not connected to the wider Mexican economy. In fact, MNCs put many domestic firms out of business and transferred only limited amounts of technology. The prevailing consensus
27
that Mexico‘s development model has not performed well should not be interpreted as an argument for returning to the ISI policies of the past. As shown in Figure 1, even during the ISI period Mexico‘s level of competitiveness, product sophistication, and production capacities we relatively weak. By the end of the ISI period even the domestic imitation capabilities and the domestic linkages started to cascade as well. Indeed, it is clear that the goal of integrating with the world economy was a good one. The problem has been that Mexico‘s hands off approach centered on thinking the market would automatically allocate such capabilities. As we will now see, China has similar goals but followed a different path to achieve them.
III. Crossing the River by Touching Each Stone: Technological Learning in China
Like Mexico, China embarked on a process of economic reform over a quarter of century ago. Like Mexico, it has sought to attract FDI into manufacturing and high technology sectors in order to gain access to technology and marketing channels for exports. Nevertheless, China‘s industrial development is very different from Mexico‘s in two important ways. First, in contrast to Mexico‘s rapid opening of markets and integration into the world economy, China has taken a more gradual and experimental approach to integration, upgrading, and industrial development. Secondly, alongside reforms China continued a parallel set of targeted government policies to support and nurture industrial development. Its nurturing of industrial development has been geared toward learning through R&D and training for development of capabilities of domestic firms for increasing value added in exports.
28
From Mao to the Market: economic reform in context
In a somewhat similar fashion to Mexico, China underwent a period of state-led industrialization from late 1940s until 1978. This period has been referred to as the period of ―Big Push Industrialization‖. As in Mexico, during the Big Push the goal of the Government was toward rapid industrialization through import substitution. The basic strategy was to invest in the strategic industries identified by government decisionmakers. The industries selected included those with the largest potential for backward linkages. Integration with the global economy was extraordinarily low (Naugthon 2007).
Eighty percent of the targeted industries were ―heavy‖ industries, such as steel, which were linked with coal, iron ore, machinery and other sectors. A number of other industries such as chemical fertilizers, motor vehicles, and electric generating equipment were also among those created by the government. Almost all of these industries became dominated by State Owned Enterprise (SOEs) and the planners assigned them production targets and prices. The government also allocated labor force to industrial firms. Through one lens this effort was successful as the industrial base of the country was created. From 1952 to 1978 industrial output grew at an annual rate of 11.5 percent and the share of industrial sector in GDP increased from 14 to 44 percent and the share of agriculture fell from 51 to 28 percent (Naugthon 2007). In order to learn technology, reverse engineering was an important ingredient of technological development.
29
On the other hand, these policies involved some shortcomings. First and foremost the focus on industrialization neglected growth of household consumption and the development of the countryside. Whereas capital formation grew at more than 10 percent per year from 1952 to 1978, private consumption grew only 4.3 annually. Employment generation was also low given the capital intensive nature of the main targeted industries. Perhaps the most grave was the technological capabilities of the targeted firms. Further, the human capital formation did not expand enough for these sectors to become efficient and competitive internationally (Naugthon 2007).
Chinese economic reforms started in 1978, two years after the death of Mao Zedong. In this year, China embarked on a programme of economic reform aiming at strategic integration into the world economy by following a ―dual track‖ policy of liberalizing FDI and inflow of imported inputs to selected industries while buttressing those sectors to the point of maturity and nurturing other sectors until they were ready to face competition with imports. Since then, according to the literature, the China‘s industrial strategy has been three-pronged. First, government policy aimed at creating endogenous productive capacity, in the form of targeting specific industries through state ownership (SOEs) or government support, paying increasing attention to science and technology policy, and linking the SOEs with the private sector and research institutes. Secondly and very importantly, Chinese support for domestic industry has always had an eye on outside of China. In order to gain technology, finance, and access to world markets China has also gradually and strategically integrated into world markets.
30
Thirdly, in undertaking economic reform, China‘s new leaders followed an experimental approach. Unlike Mexico, there was a much more experimental (trial and error) and less certain attitude toward reform. The Mexican Government was ideologically committed to reform towards a market economy and free trade. In a sense, free trade and a market based economy was an end by itself in the case of Mexico, and it was taken for granted that such a transition by itself would enhance learning through trade and lead to deepening of industrialization and promoting growth. By contrast, Chinese policy was based on the use of market and trade as a means to development. Hence, in the eyes of Chinese policy makers, market and government policies were to supplement each other while the weight of each would change as the economy would develop.
―It was never conceivable to Chinese policy-makers that their economy would postpone economic development until after an interlude of system transformation. It was always assumed that system transformation would have to take place concurrently with economic development, and indeed that the process of economic development would drive market transition forward and guarantee its eventual success. Individual reform policies were frequently judged on the basis of their contribution to economic growth (rather than to transition as such). In the beginning the approach was followed because reformers literally did not know where they were going: they were reforming ―without a blueprint‖ and merely seeking ways to ameliorate the obvious serious problems of the planned economy. But even after the goal of a market economy gradually gained ascendance in the
31
minds of reformers, it was not anticipated that market transition would be completed until the economy reached at least middle-income status. And in fact, that is exactly what eventually happened.‖ (Naugthon 2007: 86).
Deng Xiaoping referred to this strategy as ―crossing the river by feeling each stone,‖ (Naugthon 2007). This approach stands in stark contrast to the Washington Consensus approach adopted in Latin America and Mexico and that advocated for swift ―shock‖ transitions to a market economy (Williamson 1990).
China‘s gradual and experimental approach to reform allowed for the development of domestic firms and industries before liberalizing fully. More importantly,it also allowed the potential ―losers‖ from liberalization to be less numerous (Naugthon 2007). The dual track had the coexistence of market and planned economies at the same time, referred to socialist market economy in the literature (see, for example, Singh 1993).
The role of R&D Unlike Mexico, where it was assumed that technology would be transferred through trade and FDI, conscious attention to science and technology (S&T) policy and research and development (R&D) has been a cornerstone of China‘s industrial development and integration to the world economy. The Chinese government learned in practice that technology acquisition from abroad through MNCs alone will not necessarily lead to transfer and development of technology; there was a need for
32
increasing the absorptive capacity of domestic firms and the development of indigenous technological capacity building. The ingredients of the government strategy included government support, indigenous R&D and innovation investment within individual firms, and creation of R&D institutions. It also included alliance among firms in an industry and their cooperation with research institutes, universities as well as foreign firms, targeting, in particular, the strategic industries .
Government policy ranged from direct investment, provision of guidance, institutional and financial support, creating favourable environment for innovation as well as introduction of competition into the domestic market for the strategic industries (e.g. telecommunication) (Fan, Gao, and Watanabe 2007: 359) and development of national standards and patents for main IT products (Wang and Wang 2007). The S&T strategy of the Government also aimed at a long-term goal of upgrading the industrial base of the country and it was selective, targeted and responsive to the market dynamic with growing emphasize on the private sector (including MNCs). Beginning in the early 1980s China put in place a number of policies that not only aimed at conducting basic research but that also put equal emphasis on the deployment and diffusion of technology as well. Table 4 provides a snapshot of China‘s key S&T policies between 1982 and 2000 (see also the case of Mobile communication industry and high-definition disc player industry below).
33
Table 4 Development of China's National Innovation System Policy
Dominant Feature
Year
Key technology R&D program Resolution on the reform of S&T system (CCCP) Sparkle system 5 863 program Torch program National S&T achievements spreading program National engineering technology research centre program Climbing program Endorsement of UAEs by SSTCC S&T progress law Decision on accelerating S&T progress (CCCP) Law for promoting commercialisation of S&T achievement Super 863 program Decision on developing high-tech industrialization Guidelines for developing national university science parks
Encouraging efforts in key technologies Adopting flexible system on R&D management Promoting basic research in agriculture 1 High-tech promotion High-tech commercialisation, high-tech zones Promoting product commercialisation Technology transfer and commercialisation of research Promoting basic research Promoting university and industry linkage Technology transfer, S&T system reform Promoting URI-industry linkage Regulating the commercialisation of S&T achievement Commercialisation, break-through in key areas Encouraging technology innovation and commercialisation Accelerating the development of university science parks
1982 1985 1985 1986 1988 1990 1991 1992 1992 1993 1995 1996 1996 1999 2000
Source: (Xiwei and Xiandong, 2007)
(Xiwei and Xiangdong 2007)
The government apparatus for guiding the S&T consisted of six different entities, Chinese academy of Science together with 5 relevant Ministries, including the Ministry of Information Technology which was specifically created for supporting IT industries (Xiwei and Xiangdong 2007: 318). The national system of innovation was geared to basic research as well as R&D in selective activities. The 863 Programme (1986) aimed at high basic and applied research in seven areas and 15 topics with the cooperation of private enterprises. The seven areas included, in order of priority given by the planners, information technology, laser, automation, biotechnology, new material technology, astro-technology and energy technology (Fan and Watanabe 2006: 311). The ―climbing programme‖ of 1992 was oriented towards acceleration of basic research. By contrast, the Torch programme was market-oriented right from its inception in 1988 and was geared mainly to commercialization of results of R&D. Its objectives ranged from providing enabling environment for high-tech industries, to creation of high-tech zones, executing
34
projects in aforementioned selected (7) areas, training and facilitating international cooperation (Fan and Watanabe 2006: 312). In 1995 the government passed the ―Decision on Accelerating Scientific and Technological Progress‖ in order to intensify the technological development (Walsh 2003: 105).
The ninth 5 year plan (1996-2000), specifically emphasized the the development of capabilities to increase domestic value added in assembly operations in computer industry and its peripherals. This was followed by the emphasize on innovation in integrated circuits and software technology in the tenth 5 year plan (2001-5) under socalled ―Golden Projects‖ (Xiwei and Xiangdong 2007: 321).
The national system of innovation (NIS) was dynamic in terms of both institutional development and the change in the relative role of Government and private enterprises. The S&T system of China consisted of universities, research institutes and public and private enterprises-including foreign firms. The interrelationship between universities/research institutes and industry is regarded unique (Chen and Kenney 2008) Furthermore, the system went through continuous reforms in terms of policies and the involvement of actors in R&D. To benefit from ―collective efficiency‖ through clustering, a number of high-tech zones (technology parks) were established (by 1992, 52 high-tech zones had been established (Xiwei and Xiangdong 2007: 319)5.
Close links were also developed among enterprises, universities, and research institutes. Further, commercialization of R&D was encouraged. In particular, over time
35
the role of private enterprises in R&D increased significantly. Table 5 shows the evolution of R&D in China from 1987 to 2003 where the number of R&D institutes increased by 67 percent. By 2003, however, the number of public institutes decreased while the private sector (enterprise) led institutes more than doubled. This trend is mimicked in terms of spending.
In 1987, 60.7 percent of R&D expenditure was
undertaken by public institutes, by 2003, the share of private sector was 62.4 percent and that of research institutes and universities was 36 per cent (table 5). The distinction between private and public entities involved in R&D is however blurred; some universities and research institutes own enterprises engaged in research (Chen and Kenney 2008).
Expenditure and policy has not been horizontal, but has been targeted to specific sectors and industries outlined above.
In allocating R&D expenditures China has
targeted a handful of sectors in electronics, semiconductor, and automotive to eventually serve as ―national champions‖ (Xiwei and Xiangdong 2007).
36
Table 5 Evolution of R&D in China, 1987 to 2003 Number of R&D Institutes
R&D Expenditure (in 100 million yuan, %)
Public Research Institutes University R&D Units Enterprise R&D Units Total
1987
2003
1987
2003
5,222 934 5,021
4,169 3,200 11,300
106.8 (60.7) 7(4) 62.1(35.3)
11,177
18,669
175.9(100)
399 (25.9) 162.3(10.5) 960.2(62.4) 1521.5 1521.5(100)
Source: (Xiwei and Xiandong, 2007)
(Xiwei and Xiangdong 2007)
The comparison of China and Mexico is striking both in terms of input to and the results of the S&T policies. Table 6 compares China with Mexico and a number of developing and developed countries in terms of expenditures on R&D. China‘s expenditure on R&D (as a percentage of GDP and in per capita) far exceed that of Mexico in term of both level and change over time. In fact, the difference in the performance of the two countries becomes more revealing when one compares the growth rates of expenditures in absolute terms. Over 1996-2004 Mexico‘s expenditure (in terms of US$ and PPP) doubled and China‘s increased by a factor of five. China‘s indicators for R&D are the highest in Asia after Singapore, Rep. of Korea and Taiwan; it is also higher than Spain and Italy. The number of people working on R&D in China were over 1.15 million (table 7), or 13.4.per 1000 of population, in China in 2004 as compared with 60039 (0.59 per 1000 of population) in the case of Mexico in 2003 (as table 6 and UNCTAD, 2007). In 2003 there were 17.1 research institutes per million of
37
population in China. Research was also geared to applied and experimental issues (Table 8) in order to be able to concentrate on practical issues for development of domestic value added in export products.
Another difference between the two countries is the change in the role played by private enterprises in R&D. The relatively hands-off approach deployed by Mexican government on activities of the private firms did not motivate them to increase their involvement in R&D as much as China, where the government provided guidance and support. According to data provided by UNESCO, the share of business enterprises in gross domestic expenditure on R&D increase from 22.4% in 1996 to 31.7% in 2004 in the case of Mexico.
38
Table 6: Expenditure on Research and development in a selected developing and developed countries* Countries Year Share in GDP Per capita Asian developing countries and Mexico Rep. of Korea 2005 2.99 666.3 Taiwan province of China n.a n.a Singapore 2005 2.36 702.2 China: 1996 0.57 15.7 2005 1.34 89.6 Hong Kong SAR 2004 0.74 231.3 Malaysia 2004 0.63 64.6 India 2005 0.61 20.8 Pakistan 2005 0.43 10.1 Mexico: 1996 0.31 22.4 2004 0.41 40.4 Thailand 2004 0.25 29.7 Vietnam 2002 0.19 4.5 Sri Lanka 2004 0.19 7.4 Philippines 2003 0.14 6.2 Indonesia** 2005 0.05 1.4 Developed countries: Israel Japan Switzerland United State Germany France Australia United Kingdom Belgium Spain Italy ----Sources : UNESCO: Online database on Expenditures on R&D *. GDP and per capita GDP are in PPP **. Partial data
39
2005 2004 2004 2004 2005 2005 2004 2004 2005 2005 2005
4.95 3.18 2.94 2.68 2.51 2.13 1.77 1.75 1.82 1.12 1.1
1317.4 440.1 1024.4 1058 736 650.8 541.5 560 588 305.8 307.3
Table 7: Number of personnel engaged R&D in China (1996-2004) 1996 2004 No. % No. % Government 232 000 29 243702 21 Business 376 700 46 696 840 60 Higher education 148100 18 212075 18 Others 47200 7 Total 804 000 100 1152617 100 Source: Based on UNESCO, Statistics of Science and Technology online
Table 8: Expenditure on R&D (10 million Yuan) 2001 2005 No. (1000) % No (1000) % Basic research 522 5 1310 5.3 Applied research 1759 16.8 4330 17.7 Experimental 8143 78.1 18850 76.9 Total 10425 100 24500 100
Source: (People's Republic of China 2006: Table 21-38)
By contrast, the corresponding figures for China increased from 43.3% to 68.3% (Xiwei and Xiangdong 2007)6. Similarly, their contribution to the sources of R&D funding of China increased from 18% in 1985 to 32.4% in 1994 and 60.2% in 2003 (Xiwei and Xiangdong 2007). In other words, unlike the case of Mexico, private enterprises have become the driving forces in R&D activities where 7 firms were main actors involved in targeted technology areas7.
The results of the implementation of S&T policy are striking for China as compared with Mexico. Table 9 shows that on average, more patents are filed in China each year than all the LA countries combined, let alone Mexico. What‘s more, whereas in LAC only 13 percent of all patents are by residents, in China that figure is over 75
40
percent. Similar results are also evident in terms of the number of articles published by Chinese scholars as compared with those of Latin American.
Moreover, the relative importance of inventions in granted patent has increased sharply over time (table 10). It is true that the share of domestic firms in total patents and in patents granted for invention has decreased since the accession to WTO in 2000 (Table A.1 and 10) because of the increasing involvement of increased involvement of foreign companies. Nevertheless, the number of invention patents granted to domestic firms has accelerated sharply during 2000-2005. The annual average growth rate of invention patents granted to domestic firms was 27.3 per cent during 2005 as compared with 18.3 per cent during 1990-2000 (based on table A.1). As a result, the share of invention in total patents granted to domestic firms has almost doubled in 2005 as compared with 2000 (Table 9.a).
41
Table 9 Selected Science and Technology Indicators 1980 - 2005
2000 - 2005
27,119 17,387 64.12% 0.89 11,505
64,235 44,106 68.66% 1.09 24,804
Patent applications, nonresidents Patent applications, residents Patent applications, resident share Research and development expenditure (% of GDP) Scientific and technical journal articles
24,236 18,785 77.51% 0.98 10,386
58,876 43,509 73.90% 1.21 22,979
Latin America and the Caribbean Patent applications, nonresidents Patent applications, residents Patent applications, resident share Research and development expenditure (% of GDP) Scientific and technical journal articles
19,044 3,792 19.91% 0.57 9,666
29,850 4,056 13.59% 0.57 16,472
7,051 540 7.65% 0.39 2,026
12,745 498 3.91% 0.41 3,488
East Asia and Pacific Patent applications, nonresidents Patent applications, residents Patent applications, resident share Research and development expenditure (% of GDP) Scientific and technical journal articles China
Mexico Patent applications, nonresidents Patent applications, residents Patent applications, resident share Research and development expenditure (% of GDP) Scientific and technical journal articles
Source: (World Bank 2008)
Table 10: The share of invention in grated patents (1990-2005)
Share of invention in total granted patent Share of domestic invention in total invention Share of invention in total domestic patent Source: Based on table A.1
42
1990 16.9 29.9 5.9
2000 12 48.7 6.5
2005 24.9 38.8 12.1
Training In tandem with R&D, China has a high level of support for tertiary education and training. Over 20,000 scientists and engineers graduate from Chinese universities per year (MOST 2006). The high level of education in science and technology as well as the facilities for vocational education facilitate training of skilled manpower for technological development. In 2005, the number of graduates in the fields of science and technology from universities and junior colleges was 1,256,000, or over 1000 per million of the population. In the same year the corresponding number of graduates from postgraduate courses was 95000, or over 90 per million.8
Continuous attention to
education was a characteristic of Chinese overall development strategy before as well as following the reform period. According to the World Bank, government expenditure on tertiary education per student was 90 percent of GDP per capita in 1999 (in Mexico that figure was 48 percent) (World Bank 2008).
Comprehensive information on the training programme of the Government is lacking. Nevertheless, there are indications that the Government focussed on enhancing the high-tech skills and education by establishing state funding training centres (Walsh 2003: 71). Some universities were also involved in training and a number of them befitted from partnership with MNCs for training in addition to R&D (Walsh 2003: 83). The Beijing University of Post and Communication is one example of cooperation with MNCs in training. Foreign investors also provide some training of local staff independently (Walsh 2003: 96).
43
Table 11: The number of graduates in vocational secondary schools and the number of students studying abroad (19782005) Vocational schools (1000) Students abroad 1978 79 9 1990 893 35440 2000 1763 56767 2005 1700 189728
Sources: (People's Republic of China 2006: Table 2-10)
The government created a large number of vocational schools. In 2005 there were 198 566 vocational school in China out of which 11 611 were secondary schools and 4230 were technical training. The number of graduates for vocational secondary schools jumped over 21 times between 1978 and 2005 (table 11). Further, the government policy to send students abroad helped the development of domestic skills in research and development even though some of them never returned to China. The combination of these factors allowed rapid expansion of persons engaged in scientific and technical activities in more recent years; it increase by over 21 per cent during 2001-05 reaching 3 810 000 (Ibid. Table 21-36). One shortcoming is the lack of upper management staff despite the fact that some Chinese who have studied and have experience abroad have returned.
Other measures to build-up capabilities of national enterprises
In contrast to Mexico, the main motive behind development of capabilities of domestic firms was the realization by the government and national enterprises that the transfer of technology from MNCs was not easily possible (Fan, Gao, and Watanabe 2007: 360). 44
Under the joint ventures there was a limit to transfer of technology to Chinese partners (Walsh 2003: 113). The effort to develop capabilities of domestic firms in turn simulated the rivalry among MNCs to be involved in R&D programmes of domestic firms in order not to miss the large Chinese market.
The Chinese Government has followed a gradual and dual policy in developing the capabilities of domestic enterprises. It has gradually increased the role of private forms in the process of industrialization and export expansion. For example, the share of private enterprises in exports has increased 18 percent in 1985 and 60 percent in 2005 (Naugthon 2007). At the same time it has implicitly, or explicitly, established a division of labour between SOEs and private enterprises. The private enterprises have emphasized, as expected, short-term opportunities and low-cost production and sale to achieve high profitability. By contrast, SOEs' concentrated on long-term goals through investment for development of new products9 rather than profitability per se Li and (Xia,2008). In their efforts, SOEs benefited little from spill -over effects of MNCs (Girma and Gong, 2008). SOEs were privileged to have better access to government funds and loans from the banking system (Li and Xia,I Ibid)
In their applied R&D, SOEs benefited from a programme called ―National Science and Technology Diffusion‖ which was specifically designed for, and devoted to them. This strategy is criticized not to have market oriented goals in the case of SOEs. It has been, however, plausible, in our view, to reform SOEs gradually in order not to let
45
the long-term objectives of the Government be undermined, particularly that they had had social objectives and responsibilities in addition to their long-term technological goals.
To provide sources of investment for domestic firms, China established two funds: the Export Development Fund for the larger firms and the Fund for Small and Medium Enterprise Incursions into International Markets for suppliers. The Government also offered value-added tax refunds to exporting firms, and the Chinese Export-Import Bank also provided loans at preferential interest rates.
Chinese domestic firms enjoyed the advantage of familiarity with the domestic market as well as allocation of significant part of the domestic market to them by the government (e.g. in the telecom equipment industries) (Fan, Gao, and Watanabe 2007: 358). Yet, the new comer local firms of China, like enterprises in other developing countries, suffered from two main disadvantages, as compared with MNCs, in development of capabilities for and commercialization of new technology: resource disadvantages and reputation disadvantages particularly in the IT sector where the technology is complicated and changes rapidly (Gao et al. 2007). Provided with incentives as well as support by the Government together with some capabilities developed during the import substitution period, however, a number of firms have managed to break into the market by developing frontier technologies (see below). In addition to the support from the Government, the leading domestic firms south collaboration with customers and cooperation with MNCs (Gao et al. 2007).
46
The role of FDI The contribution of MNCs to financial resources needed for R&D has been small. Nevertheless, they have become increasingly involved in R&D in China. Foreign hightech R&D in China has gone through three phases: explanatory and strategic partnership (early-mid1990s), expansion (mid-late1990s) and consolidation (late 1990s.cuurent) (Walsh 2003: 86-91). During 1990s, foreign investment in R&D was more of a "show" rather than genuine activities as establishing R&D was a pre-condition for obtaining approval to establish joint ventures. During the second phase the MNCs also started to expand training centres. It was during the third phase when the MNCs became interested in moving up the value-added production chain to upgrade their products ;thus needed local R&D (Walsh 2003: 86-91) Meanwhile, the Chinese government also provided the MNCs ―a range of preferential policies, including tax rebates, construction loans, access to modern facilities and other incentives‖ particularly in the case of IT industries (Walsh 2003: xiii and 56). While encouraging foreign forms to undertake R&D in China, the authorities initially entered into partnership with a number of foreign firms to create inter-firm rivalry and accelerated technological development (Walsh 2003: 77-78 and 80-82). Subsequently, wholly foreign -owned firms established R&D facilities in the country (Walsh 2003: 79). Attracting multiple foreign partners was successful particularly in the IT industry. It is estimated that around 120 to 400 foreign R&D centres were operational in 2003 (Walsh 2003: xiv). In the case of IT industries, since early 1990s, almost all main MNCs involved in this industry have established R&D centres in China. In Beijing alone they established 18 main centres between 1993 and 200310. Domestic firms also benefited
47
from the partnership with MNCs, to some extent. For example, Legend, Stone, founder and Great Wall, learned a great deal about modern manufacturing in addition to technology development (Walsh 2003: 79). Nevertheless, the Chinese authorities realized that joint ventures with MNCs alone would not be sufficient for technology transfer.
Generally speaking, in China, unlike Mexico, FDI has crowded in domestic investment as Government efforts aimed at building capabilities of domestic firms. As predicted by TCB, such capabilities in turn motivated MNCs to invest in R&D. As domestic firms were involved in development of their technological capabilities, many MNCs were motivated to join them in their R&D in order to share the domestic market, particularly that the government also provided them with other incentives as already mentioned. In China efforts to indigenously develop technological capabilities and to bring such technologies to market have been coupled with a targeted but aggressive acquisition of foreign technologies through foreign direct investment. The strategy has been to either develop a sector or technology nationally, or to ―import‖ the technology through FDI. Initially, licensing FDI was conditioned to arrangements for transfer of technology and provision of linkages to local firms, joint ventures and partnership. In 2001, such condition is dropped, but MNCs are encouraged to invest in R&D, particularly in information technology, ―by offering a range of preferential policies‖ that includes tax rebates, construction loans, access to modern facilities, and other incentives‖ (Walsh 2003: xiii and 56). Whereas national Mexican firms only capture approximately 5 percent
48
of the inputs of foreign firms, in China that number is well over 20 percent (Gallagher and Zarsky 2007).
Case in Point: High Tech Industries
China is the most impressive contemporary case of latecomer high technology development11. For twenty-five years, the country gradually and quietly built manufacturing capacities and integrated into world markets. China has been at the core of MNC location strategies because of its multiple location specific assets: a large and growing internal market and a low-cost export platform for manufactured goods. What‘s more, China provides a match between national linkage capability between MNCs and domestic suppliers. Now the country is on the verge of having formidable flagship firms of its own in the IT industry.
FDI in high tech of China has gone through four phases: sale, marketing, licensing and technical services; manufacturing and production; product design, localization and redevelopment and finally R&D (Walsh 2003: 75-76). Much is made of China‘s low wages as a major factor driving MNC outsourcing to China and IT development more generally. There is little doubt that wages are low: the average manufacturing wage in China was estimated to be 61 cents an hour in 2001, compared to $16.14 in the US, and $2.08 in Mexico (Federal Reserve Bank of Dallas 2003). But the story of China‘s success and likely emergence as the center for global IT production goes beyond low wages and generic product manufacturing capabilities.
49
The development of the IT industry is in some part the result of government push and nurturing. In 1986, four Chinese scientists recommended to the Government that IT be designated a strategic sector. The request was approved and in 1988, China‘s National Development and Reform Commission (formerly the State Planning Commission) designated high tech as a ―pillar‖ industry worthy of strategic industrial policy (MOST 2006). It was coupled with the MOST‘s National High Tech R&D (or 863) Program that supported R&D efforts of local governments, national firms, and regions. The goal was to foster a vibrant high tech sector with national firms that could eventually compete as global flagships. The strategy was to establish domestic firms and bring foreign firms to China to build their capacity to produce components and peripherals for PCs. To this end, IBM, HP, Toshiba, and Compaq were all invited to come to China and form joint ventures with such Chinese firms as Legend, Great Wall, Trontru, and Star. China required the foreign firms to transfer specific technologies to the joint venture, establish R&D centers, source to local firms, and train Chinese employees as mentioned (USDOC 2006). By the 1990s, all of the major contract equipment manufacturers also came to China under similar arrangements. According to the Tenth five Year Plan ending in 2005, the Government planned to invest more than $ 120 billion in the IT industries in order to raise the share of the sector to 7% of GDP (Walsh 2003: 71)
The strategy has paid off. ―By carefully nurturing its domestic computing industry through tightly controlled partnerships with foreign manufacturers,‖ concludes Dedrick, ―China has become the fourth-largest computer maker in the world‖ (Dedrick and
50
Kraemer 2002: 28). Table 12 shows that the majority of foreign electronics firms in China are either joint ventures or domestic/state-owned enterprises (SOEs).
Given the large nature of the economy and the fact that China serves as an export platform, China has had a great deal of bargaining power vis-à-vis MNCs. First, China had location specific assets that could not be ignored. Not only did China offer an export platform like Taiwan and South Korea did, but it also had a large and growing market at home which is a major bargaining chip. In essence, foreign firms traded market access for technology transfer. China‘s domestic market is growing rapidly, propelled not only by a rise in personal income but also by active government promotion strategies as mentioned before.
51
Table 12
China: Major Consumer Electronics Firms by Ownership Type Sector
Foreign-Owned
Joint-Ventures
Domestic Firms and SOEs
Mobile Phones
Motorola
Motorola/Eastcom Nokia/Capitel, Southern Siemens/Mil Subsidiaries Samsung/Kejian Sagem/Bird
TLC
PCs
HP Dell
IBM/Great Wall Toshiba/Toshiba Shanghai Epson/Start Taiwan GVC/TCL
Lenovo Founder Tongfang
Sony/SVA Philips/Suzhou CTV Toshiba/Dalian Daxian Great Wall Electronics/TCL
Changhong Konka Hisense Skyworth Haier Panda Xoceco
Samsung/Suzhou Xianxuehai Electrolux/Changsha LG/Chunlan Mitsubishi/Haier Sanyo/Kelon Sigma/Meiling Hong Leong/Xinfei Toshiba Carrier/Midea
Changling Gree
"Brown Goods"
"White Goods"
Siemens
Source: Rodrik, 2006 .
(Rodrik 2006)
In addition to domestic market access, global MNCs have been willing to work in the confines of Chinese policy because of China‘s active support for and subsidies to the high tech industry. According to a comprehensive study by Dussel Peters (2005), a key
52
program has been the establishment of high tech industrial parks. Much of the FDI flows to these parks where it is matched with national firms who are the recipients of numerous incentives and assistance programs. Despite the potential market pay-offs, foreign firms are now starting to get nervous about technology transfer arrangements, especially as Chinese IT firms begin to emerge as flagships. Indeed, OECD governments have begun to dub China‘s policies as ―forced transfers‖ and have undertaken investigations and task forces in order to eliminate or reduce them (USDOC 2006).
Another key element of the strategy is a high level of support for high tech R&D and education. According to MOST, the bulk of R&D expenditure have been allocated to IT industry. R&D funds are distributed to SOEs, local governments, and Chinese owned firms. The 2004-2008 five year plan calls for increased subsidies to SOEs (MOST 2006: Table 5.2). Support for local government is targeted at the cities which house R&D centers within industrial parks. Local governments often match national government funding for R&D programs.
In short, China‘s high tech promotion strategy, had two prongs: build up capabilities of domestic firms and stimulate investment and technology transfer by MNCs. And the results of China‘s high tech program have been impressive. By 1989, the Legend group had evolved into Legend Computer and formed a joint venture with Hewlett Packard. By 2000, Legend had emerged as the number one seller of personal computers in Asia Pacific and held more than 20 percent of the Chinese PC market. In early 2005, Legend—morphed into Lenovo—acquired IBM‘s global desktop and
53
notebook computer divisions. With the IBM deal, Lenovo became, after Dell and HP, the world third largest PC maker (Spooner 2005). Hassee Computer is another fast growing domestic computer firm. Domestic manufacturers together have dominated 70% of the market for PC sales (Walsh 2003: 108). Founder, became a leading firm in developing laser typesetting technologies and electronic publishing. Datang, is the leading company in development of 3G (TD-SCDMA) technology. Huawei is a giant maker of telecommunication equipment. A collection of several domestic firms developed their own brand in Mobile telephone and high definition disc player (see below). Table 13 exhibits a few other Chinese firms including lesser known ones that have made significant innovations. Despite numerous problems at the beginning, particularly the lack of recognition of their capabilities, and relative merits of their product, by Chinese customer, they succeeded to penetrate into the internal and international market. They were highly motivated to develop ―leading technologies and leading products‖; focused on a single product, collaborated with leading local firms provider of equipment and components, sought cooperation of MNCs and collaborated with their customers. Throughout the process government support was important (Gao et al. 2007).
54
Table 13 Leading Innovative Domestic High Technology Companies in China Company Name
Founding
Major technical acheivements
Huawei Technology
1988
large-scale switch systems next generation network optimal network data communication
Shenzhen Zhongxin Technology Co.
1985
large-scale switch systems next generation network TD-SCDMA
Datang Telecom Technology
1998
TD-SCDMA SCDMA
Dawning Information Industry Co.
1995
Wormhole routing chip parallel optimising compiler scalability, usability, manageability, and availability (SUMA) tech
Beijing Genome Institute
2002
large-scale genome sequencing
Sibiono Gene Technology
1998
Gene therapy medication for head and neck squamos cell carcinoma
China National Petroleum Co.
1955 (1988)
Integrated seismic data processing software ABS technology Top drive drilling equipment Multi-branch horizontal and large displacement well drilling tech Two-state catalytic cracking technology
Source: Fan et al (2007)
(Fan, Gao, and Watanabe 2007)
Overall, by 2003, China‘s electronics sector generated $142 billion in exports and employing four million workers. Between 1993 and 2003, the growth rate of high tech exports was 50.2 percent for computers and peripherals, and 21.9 percent for telecommunications and related equipment (Table 13). Like Lenovo, many Chinese firms started as State Owned Enterprises (SOEs) and were gradually privatized as they gained capacity and competitiveness. In 1993, 26 percent of computer and peripheral firms and 54 percent of telecommunications firms were SOEs. By 2003, only 6 percent of computer and 18 percent of telecom firms were SOEs.
55
Although national firms, including SOEs, are in the minority, they are filing and being granted more patent applications than foreign firms. According to MOST, Chinese firms were granted 112, 103 patents in 2002, whereas foreign firms were granted only 20,296. Close to half of these patents were in the form of utility models--patents for incremental innovations where local firms create variations on project and process execution. This reveals that a significant amount of learning is going on in Chinese firms. Another half however, is in the form of design patents, which were 49,143 in 2002 (MOST 2006).
IV. Summary and Implications for Development Policy It is clear from this analysis that Mexico and China have followed very different policies for acquiring technological capabilities.
Mexico was the ―champion of
liberalization‖ but China‘s may be described as neo-developmental—evocative but not a clean replication of the NIC developmental states (see: ECLAC 2001). Alongside reform, China put in place functional and targeted government policies.
Perhaps more importantly, we have shown how Mexico‘s was a policy of dismantling a past set of policies, China‘s was a strategy of building new policies for the future. Mexico knew where it wanted to be and thought it had an easy way to get there: dismantle the old policies and then learning and growth would follow. China also had the same goal but was more modest about how to get there. China has embarked on a two pronged policies. While reforming the economy, it has taken a more gradual and experimental approach to liberalization and integration into the world economy.
56
Meanwhile, it has continued a parallel set of targeted policies in support of development of indigenous capabilities for technological learning.
As early as 1990, the Mexican Government relinquished all interference in the technology process leaving it entirely to the parties involved in FDI; and MNCs were provided various incentive, particularly in export processing zones, without commitment for performance. Economic liberalism also led to reduction in government investment in R&D, education and training. The assumption was that the market forces would take care of these issues.
Through trial and error China has learned that reliance on market forces and FDI alone will not automatically lead to the transfer of technology and increase value added in exports. There was a need for developing the capabilities of domestic firms. While formulating and implementing a comprehensive, but selective and targeted strategy, aiming in particular at IT industries, the Government developed an institutional framework for S&T development and a dynamic national system of innovation. It consisted of the Chinese Academy of Science, relevant ministries, the private enterprises, universities and research institutes. Close links were established among these entities in the public and private sectors. Both basic research, and application and diffusion of technology have been emphasized right from early 1980s.
A shortcoming of this paper is the lack of ability to examine in full the independent effect government these policies on learning and industrialization relative to
57
other facts—such an undertaking is an impossible one given the limits of current data and methods. Nevertheless, the results of our study are consistent with those of a number of other empirical studies in the TCB literature of capability building theory and other Neodevelopmentalists (Wade 1990; Paus 2005; Puyana and Romero 2006; Amsden 2000; Paus and Gallagher 2008; Singh 1993; Chang 2005; Shafaeddin 2005; Lall 2005). This body of literature makes a strong case for the need for nurturing of domestic firms in a globalizing world.
The contrast in philosophy and policy for Mexico and China
decisively confirms that general finding.
58
Bibliography
Agosin, Manuel, and Roberto Machado. 2005. Foreign Investment in Developing Countries: Does it Crowd in Domestic Investment? Oxford Development Studies 33 (2):149-162. Aguayo Ayala, Francisco. 2000. La estructura industrial en el modelo de economia abierta en Mexico. Mexico: John D. and Catherine T. MacArthur Foundations. Amsden, Alice. 2000. The Rise of the "Rest": Challenges to the West From LateIndustrializing Economies. Oxford: Oxford University Press. Archibugi, D., and M. Michi. 1997. Technological Globalization or National System of Innovation? Futures 29 (2):121-137. Arrow, K.J. 1962. The Economic Implications of Learning by Doing. Review of Economic Studies XXIX, 3 (80):155-173. Baer, Werner. 1971. The Role of Government Enterprises in Latin America's Industrialization. In Fiscal Policy for Industrialization and Development in Latin America. Gainsville: University of Florida. Baldwin, R.E. 1969. The Case against Infant-Industry Tariff Protection. Journal of Political Economy 77 (3):295-305. Bell, M., B. Ross-Larson, and L.E. Westphal. 1984. Assessing the Performance of Infant Industries. Journal of Development Economics 16:101-128. Bruton, H. 1998. A Reconsideration of Import Substitution. Journal of Economic Literature XXXVI:903-936. CADELEC. 2004. Home Page (www.cadalec.com.mx). Cadena Productiva de la Electronica 2004 [cited April 2004]. Carrillo, J., and A. Hualde. 2002. La maquiladora electronica en Tijuana: hacia un cluster fronterizo. Revista Mexicana de Sociologia LXIV (3):125-171. Chang, H.J. 2005. Why developing countries Need Tariffs: How WTO NAMA Negotiations Could Deny Developing Countries‘ Right to a Future. Geneva: South Centre. Chen, Kun, and Martin Kenney. 2008. Universities/Research Institutes and Regional Innovation Systems: The Cases of Beijing and Shenzhen. World Development 35 (6):1056-1074. Chen, Y. 2008. Why do Multinational corporations locate their Advanced R&D Centres in Beijing. Journal of Development Studies 44 (5):622-644. Cimoli, Mario. 2000. Developing Innovation Systems: Mexico in Global Perspective. New York and London: Continuum Books. Cypher, James Martin. 1990. State and Capital in Mexico: Development Policy Since 1940. Boulder, CO: Westview Press. Dedrick, Jason, and Kenneth L. Kraemer. 2002. Enter the dragon: China‘s computer industry. Perspectives:28-36. Dussel Peters, Enrique. 1999. Reflexiones sobre conceptos y experiencias internacionales de industrializacion regional. In Dinamica Regional y Competitividad Industrial, edited by C. R. D. a. E. D. Peters. Mexico City: Editorial JUS. ———. 2003. Industrial Policy, Regional Trends, and Structural Change in Mexico's Manufacturing Sector. In Confronting Development, Assessing Mexico's
59
Economic and Social Policy Challenges, edited by K. J. Middlebrook, and Eduardo Zepeda. Stanford: Stanford University Press. ———. 2004. Gastos en Investigacion y Desarrollo e Inversion Extranjera Directa: Un Estudio a Nivel de Clases Economicas del Sector Manufacturero Mexicoano (1994 to 2000). In Nuevos Caminos Para el Desarollo Sustentable en Mexico, edited by A. Nadal. Mexico City. ———. 2005. Economic Opportunities and Challenges posed by China for Mexico and Central America: DIE (German Development Institute). ———. 2008. Invesion extranjera directa en Mexico: desempeño y potencial. Mexico City: Siglo XXI. ———, ed. 2007. Opportunidades en la relacion economica y commercial entre China y Mexico: CEPAL-UNAM. Dussel Peters, Enrique, Juan Jose Palacios Lara, and Guillermo Woo Gomez. 2003. La industria Electronica en Mexico: Problematica, Perspectivas y Propuestas: D.R. Universidad de Guadalajara. ECLAC. 1999. Foreign Direct Investment in Latin America, 1999. Santiago: United Nations. ———. 2001. Economic survey of Latin America and the Caribbean. Santiago: United Nations. ———. 2008. Economic survey of Latin America and the Caribbean. Santiago: United Nations. Elkan, V. 1996. Catching up and slowing Down: Learning and Growth Pattern in an Open Economy. Journal of International Economy (41):95-111. Ernest, D. 2007. Beyond the ‗Global Factory‘ Model: Innovative capabilities for Upgrading China‘s IT Industry. International Journal of Globalisation 3 (4):437459. Fan, P., X. Gao, and C. Watanabe. 2007. Technology Strategies of Innovative Chineese Domestic companies. International Journal Technology and Globalization 3 (4):344-363. Fan, P., and C. Watanabe. 2006. Promoting Industrial Development through Technology Policy: Lessons from Japan and China. Technology in Society 28:303-320. Federal Reserve Bank of Dallas. 2003. China: Awakening Giant, edited by F. R. B. o. Dallas. Dallas, Texas. Fernández, J. 2000. The Macroeconomic Setting for Innovation. In Developing Innovation Systems: Mexico in Global Perspective, edited by M. Cimoli. New York and London: Continuum Books. Gallagher, Kevin P., Juan Carlos Moreno-Brid, and Roberto Porzecanski. 2008. The Dynamism of Mexican Exports: Lost in (Chinese) Translation? World Development 36 (8):1365-1380. Gallagher, Kevin P., and Roberto Porzecanski. 2008. Climbing up the Technology Ladder? High Technology Exports in China and Latin America. Berkeley, CA: Center for Latin American Studies, University of California Berkeley. Gallagher, Kevin P., and Lyuba Zarsky. 2007. The Enclave Economy: Investment and Sustainable Development in Mexico’s Silicon Valley. Cambridge, MA: The MIT Press.
60
Gao, G., K. Hin Chai, J. Liu, and J. Li. 2007. Overcoming ‗Latecomer Disadvantages‘ in Small and Medium-sized Firms: Evidence from China. International Journal Technology and Globalization 3 (4):364-383. Görg, H., and David Greenaway. 2004. Much Ado about Nothing? Do Domestic Firms Really Benefit from Foreign Direct Investment. World Bank Research Observer 19 (2):171-197. Gruber, H. 1992. The learning Curve in the Production of Semiconductor Memory Chips. Applied Economics (24):885-94. Kehoe, TImothy J. 1995. A Review of Mexico's Trade Policy From 1982-1994. The World Economy. Krugman, Paul. 1984. Import protection as Export Promotion: International Competition in the Presence of Oligopoly and Economics of Scale. In Monopolistic Competition and International Trade, edited by H. Kierzkowzki. Oxford: Clarendon Press. Lall, Sanjaya. 1993. Policies for Building Technological Capabilities: Lesson from Asian Experience. Asian Development Review 11 (2):72-103. ———. 2005. Rethinking Industrial Strategy: The Role of the State in the Face of Globalization. In Putting Development First: The Importance of Policy Space in the WTO and IFIs, edited by K. P. Gallagher. London: Zed Books. Lazonick, W. 1991. Business Organization and the Myth of Market Economy. New York and Melbourne: Cambridge University Press. Li, S. and Xia, J. (2008) ; " The roles and Performance of State Firms and Non-State Firms in China's Economic Transition", World Development , Vol 36,No 1 Linder, S.B. 1961. An essay on trade and transformation. New York: John Wiley. Lucas, R.E. 1988. On the Mechanics of Economic development. Journal of Monetary Economics 22 (1):3-42. Lustig, Nora. 1998. Mexico: The Remaking of an Economy. Washington, DC: The Brookings Institution. Moore, R. 1997. Learning-by-Doing and Trade Policy in a Developing Economy. The Journal of Developing Areas (31):515-28. MOST. 2006. National High Tech R&D Program (863 Program). Beijing: Ministry of Science and Technology of the People's Republic of China. Naugthon, Barry. 2007. The Chinese Economy: Transitions and Growth. Cambridge, MA: MIT Press. Nelson, R.R., and S.G. Winter. 1982. An Evolutionary Theory of Economic Change. Cambridge, MA and London, UK: Harvard University Press. Otero, Gerardo. 1996. Neoliberal Reform and Politics in Mexico. In Neo-liberalism Revisited: Economic Restructuring and Mexico's Political Future, edited by G. Otero. Boulder, CO: Westview. Palacios, Juan. 2001. Production Networks and Industrial Clustering in Developing Regions: Electronics Manufacturing in Guadalajara, Mexico. Guadalajara: University of Guadalajara. Paus, Eva. 2005. Foreign Direct Investment, Development and Globalization, Can Costa Rica become Ireland? London: Palgrave.
61
Paus, Eva, and Kevin P. Gallagher. 2008. Missing Links: Foreign Investment and Industrial Development in Costa Rica and Mexico. Studies in Comparative International Development 43 (1). People's Republic of China. 2006. Statistical Yearbook. Beijing. Pizarro, J., and Mehdi Shafaeddin. 2007. From Export promotion to Import substitution: comparative Experience of China and Mexico‖. Puyana, Alicia, and José Romero. 2006. Trade liberalization in Mexico: some Macroeconomic and Sectoral Impacts and Implications for Macroeconomic Policy. Paper read at International Development association (IDEAS) and UNDP conference on Post Liberalization constraints on Macroeconomic policies, 27-29 January, at Muttukadu, Chennai. Ramírez, M. 1994. Public and Private Investment in Mexico, 1950-1990: An Empirical Analysis. Southern Economic Journal. Reynolds, Clark W. 1970. The Mexican Economy. New Haven: Yale University Press. Rivera Vargas, Maria Isabel. 2002. Technology Transfer Via the University-Industry Relationship: The Case of Foreign High Technology Electronics Industry in Mexico's Silicon Valley. Edited by P. Albach, Studies in Higher Education. London: Routledge. Rodrik, Dani. 1999. The New Global Economy and Developing Countries: Making Openness Work. Washington D.C.: Overseas Development Council. ———. 2006. What's So Special about China's Exports? China & World Economy 14 (5):1 - 19. Romer, P.M. 1986. Increasing Returns and Long-run Growth. Journal of Political Economy 94 (5):1002-1037. ———. 1987. Growth Based on Increasing Returns Due to Specialization. The American Economic Review. Papers and Proceedings:52-62. Romo Murillo, David. 2002. Derramas Tecnologicas de la Inversion Extranhera en la Industria Mexicana. Comercio Exterior 53 (3):230-43. Sargent, John, and Linda Matthews. 2007. Capital Intensity, Technology Intensity, and Skill Development in Post China/WTO Maquiladorasand. World Development 36 (4):541-559. ———. 2007. China vs. Mexico in the Global EPZ Industry: Maquiladoras, FDI Quality, and Plant Mortality: University of Texas Pan American Center for Border Economic Studies. ———. 2008. Capital Intensity, Technology Intensity, and Skill Development in Post China/WTO Maquiladoras. World Development 36 (4):541-559. Schmitz, H., and T. Hewitt. 1991. Learning to Raise Infants: A Case –Study in Industrial Policy. In States or Markets? Neo-liberalism and the Development Policy Debate, edited by C. Colclough and J. Manor. Oxford: Clarendon Press. Shafaeddin, Mehdi. 2005. Friedrich List and the Infant Industry Argument. In The Pioneers of development Economics, Great Economist on Developmen, edited by K. S. Jomo. London and New York: Zed Books. ———. 2005. Towards an Alternative perspective on Trade and Industrial Policies. Development and Change 36 (6):1143-1162. ———. 2005. Trade Policy at the crossroads, recent experience of developing countries: Palgrave, Macmillan.
62
Shafaeddin, Mehdi, and Juan Pizarro. 2007. From Export Promotion To Import Substitution; Comparative Experience of China and Mexico: University Library of Munich, Germany. Singh, A. 1993. The Plan, the Market and Evolutionary Economic Reform in China: UNCTAD. Spooner, John G. The nouveau Lenovo wants to shake up the PC market’s status quo. ZDnet 2005 [cited March 3. Available from http://www.zdnet.com. Teubal, M. 1987. Innovation Performance, Learning and Government policy. Madison, WI: University of Wisconsin. ———. 1996. R&D and Technology Policy in NICs as Learning Processes. World Development 24 (3):449-460. UNCTAD. 2008. World Investment Report. Geneva: United Nations. UNCTC. 1992. Foreign Direct Investment and Industrial Restructuring in Mexico. New York: United Nations Centre on Transnational Corporations. Unger, K., and M. Oloriz. 2000. Globalization of Production and Technology. In Developing Innovation Systems: Mexico in Global Perspective, edited by M. Cimoli. New York and London: Continuum Books. USDOC. 2006. Technology Transfer to China, edited by B. o. I. a. Security: United States Department of Commerce. ———. 2006. Technology Transfer to China, edited by B. o. I. a. Security. Washington, DC: United States Department of Commerce. Wade, Robert. 1990. Governing The Market Economic Theory and the Role of Government in East Asian Industrialization. Princeton, NJ: Princeton University Press. Walsh, K. 2003. Foreign High-Tech R&D in china; Risks, Rewards, and Implications for US-china Relations. Washington, D.C.: The Henry L. Stimson Centre. Wang, Q., and H. Wang. 2007. Industrial Standard based Competition and Chinese Firm Strategic Choice. International Journal of Globalisation 3 (4):422-436. Williamson, J., ed. 1990. Latin American Adjustment: how Much Has Happened? Washington D.C.: Institute of International Economics. Wise, Carol, ed. 1998. The Post-NAFTA Political Economy: Mexico and the Western Hemisphere. University Park, PA: The Pennsylvania State University Press. Woo, Guillermo. 2001. Hacia la integracion de pequenas empresas en la industria electronica de Jalisco: dos casos de estudio. In Claroscuros: Integration Exitosa de las Pequenas y Medianas Empresas en Mexico, edited by E. Dussel. Mexico City: Editorial Jus. World Bank. 2008. World Development Indicators: World Bank. Xiwei, Z., and Y. Xiangdong. 2007. Science and Technolgy Policy Reform and its Impact on China‘s National Innovation System. Technology and Science (29):317-25. Ye, M. 2008. Hand off Continual control: the Government Role in China‘s Electronics Industries: Princeton University. Yu, J. 2007. From Path-following to Path-Creating, some Paradigm Shift in China‘s Catching- up. International Journal of Globalisation 3 (4):409-421.
63
Appendix Table A.1: Applications for Patents received and the number of patent granted in China 1990
2000
2005
Items Inventions Domestic Foreign Utility models Domestic Foreign Design Domestic Foreign Total Domestic Foreign Share of domestic (%)
Examined 10137 5832 4305 27615 27488 127 3717 3265 452 41469 36585 4884 88.2
Granted 3838 1149 2689 16952 16744 11644 1798 1411 387 22588 19304 3248 85.5
Examined 51747 25346 26401 68815 68461 354 50120 46532 3588 170682 140339 30343 82.2
Granted 12683 6177 6506 54743 54407 336 37919 34652 3267 105345 95236 10109 90.4
Examined 173327 93485 79842 139566 138085 1481 163371 151587 11784 476264 383157 93089 80.4
Granted 53305 20705 32600 79349 78137 48946 81349 72777 8572 214003 171619 42384 80.2
Sources: (People's Republic of China 2006: Tables 21-44 and 21-46). 1
For more details on List‘s ideas see (Shafaeddin 2005) particularly pp 47-50.
2
See for example the reference in (Bruton 1998: 930). There are at least two versions of the theory, TCB and (Lazonick 1991). Lazonick‘s theory is concerned basically with large firms of developed countries and thus not discussed here. 3.
For a good presentation and development of the theory see (Lall 1993)
4
For more details see (Pizarro and Shafaeddin 2007)
5
They were mainly located in Beijing, Shanghai and Shenzhen. 67% of 33392 high-tech enterprises were located in high-tech parks (Fan, Gao, and Watanabe 2007: 356). 6
The terminal year for China was 2005.
7
These include Huawei, Shenzhen Zhongxin, Datang, Dawning, Beijing Genom Institutes and China National Petroleum.(see: Fan, Gao, and Watanabe 2007) 8
Based on (People's Republic of China 2006), tables 21-13 and 21-9
9
SOEs have also had social objectives (see Lia and Xia,2008).
10
.They include Intel, SAP, Motorala, Lucent, Turbolinux, Nokia, IBM,Ericson, Agilent, Mirosoft, Matsushita, NEC and Samsung (Chen 2008: Table A1). 11
For a brief history of development of the industry up to 1993 see (Ye 2008).
64