(Cohen, 2004) and machine learning (Wainwright & Jordan, ...... Michael, Banerjee, Arindam, Blumenthal, M. Benno, Auroop R. Ganguly, Jason E. Smerdon, and ...
Technical report, arXiv
Nested Sequential Monte Carlo Methods Christian A. Naesseth, Fredrik Lindsten and Thomas Sch¨on
• Please cite this version: Christian A. Naesseth, Fredrik Lindsten and Thomas Sch¨on. Nested Sequential Monte Carlo Methods. arXiv. 2015. Submitted to the International Conference on Machine Learning (ICML) 2015, under review
Abstract We propose nested sequential Monte Carlo (NSMC), a methodology to sample from sequences of probability distributions, even where the random variables are high-dimensional. NSMC generalises the SMC framework by requiring only approximate, properly weighted, samples from the SMC proposal distribution, while still resulting in a correct SMC algorithm. Furthermore, we show that NSMC in itself produces such properly weighted samples. Consequently, one NSMC sampler can be used to construct an efficient high-dimensional proposal distribution for another NSMC sampler, and this nesting of the algorithm can be done to an arbitrary degree. These properties allows us to consider complex and high-dimensional models using SMC. We show results, and comparisons, motivating the efficacy of our approach on several high-dimensional filtering problems.
Nested Sequential Monte Carlo Methods
Christian A. Naesseth Link¨oping University, Link¨oping, Sweden
CHRISTIAN . A . NAESSETH @ LIU . SE
Fredrik Lindsten The University of Cambridge, Cambridge, United Kingdom
FREDRIK . LINDSTEN @ ENG . CAM . AC . UK
Thomas B. Sch¨on Uppsala University, Uppsala, Sweden
THOMAS . SCHON @ IT. UU . SE
Abstract
···
We propose nested sequential Monte Carlo (NSMC), a methodology to sample from sequences of probability distributions, even where the random variables are high-dimensional. NSMC generalises the SMC framework by requiring only approximate, properly weighted, samples from the SMC proposal distribution, while still resulting in a correct SMC algorithm. Furthermore, we show that NSMC in itself produces such properly weighted samples. Consequently, one NSMC sampler can be used to construct an efficient high-dimensional proposal distribution for another NSMC sampler, and this nesting of the algorithm can be done to an arbitrary degree. These properties allows us to consider complex and high-dimensional models using SMC. We show results, and comparisons, motivating the efficacy of our approach on several high-dimensional filtering problems.
··· ···
··· ···
··· k−1
k
k+1
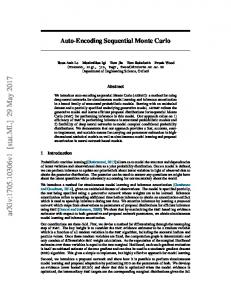
Figure 1. Example of a spatio-temporal model where π ¯k (x1:k ) is described by a k × 2 × 3 undirected graphical model.
time series or state space models (Shumway & Stoffer, 2011; Capp´e et al., 2005). Here the index k corresponds to time and we want to process some observations y1:k in a sequential manner to compute expectations with respect to the filtering distribution π ¯k (dxk ) = P(Xk ∈ dxk | y1:k ). Although we will restrict ourselves to these types of problems here, our method is in fact more generally applicable to a wide range of sequential inference problems. To be specific, we are interested in settings where
for some sequence of probability densities k ≥ 1,
···
···
···
Inference in complex and high-dimensional statistical models is a very challenging problem that is ubiquitous in applications. Examples include, but are definitely not limited to, climate informatics (Monteleoni et al., 2013), bioinformatics (Cohen, 2004) and machine learning (Wainwright & Jordan, 2008). In particular, we are interested in sequential Bayesian inference, which involves computing integrals of the form Z π ¯k (f ) := Eπ¯k [f (X1:k )] = f (x1:k )¯ πk (x1:k )dx1:k , (1)
R
···
···
1. Introduction
π ¯k (x1:k ) = Zk−1 πk (x1:k ),
···
(2)
with normalisation constants Zk = πk (x1:k )dx1:k . Note that x1:k := (x1 , . . . , xk ) ∈ Xk . The typical scenario that we consider is the well-known problem of inference in
(i) Xk is high-dimensional, i.e. Xk ∈ Rd with d � 1, and (ii) there are local dependencies among the latent variables X1:k , both w.r.t. time k and between the individual components of the (high-dimensional) vectors Xk . One example of the type of models we consider are the so-called spatio-temporal models (Wikle, 2015; Cressie & Wikle, 2011; Rue & Held, 2005). In Figure 1 we provide a probabilistic graphical model representation of a spatiotemporal model that we will explore further in Section 6. Sequential Monte Carlo (SMC) methods, reviewed in Section 2.1, comprise one of the most successful methodologies for sequential Bayesian inference. However, it is well known that SMC struggles in high-dimensions. Indeed, these methods are rarely used for dimensions, say, d ≥ 10 (Rebeschini & van Handel, 2015). The purpose of the NSMC methodology is to push this limit well beyond d = 10.
Nested Sequential Monte Carlo Methods
The basic strategy, described in Section 2.2, is to mimic the behaviour of a so-called fully adapted SMC algorithm. Full adaptation can drastically improve the efficiency of SMC in high dimensions. Unfortunately, it can rarely be implemented in practice since the fully adapted proposal distributions are typically intractable. NSMC addresses this difficulty by requiring only approximate, properly weighted, samples from the proposal distribution. The proper weighting condition ensures the validity of NSMC, thus providing a generalisation of the family of SMC methods. Furthermore, NSMC will itself produce properly weighted samples. Consequently, it is possible to use one NSMC procedure within another to construct efficient high-dimensional proposal distributions. This nesting of the algorithm can be done to an arbitrary degree. For instance, for the model depicted in Figure 1 we could use three nested NSMC samplers, one for each dimension of the “volume”. We introduce the concept of proper weighting, approximations of the proposal distribution, and nesting of Monte Carlo algorithms. Throughout Section 3 we consider simple importance sampling and in Section 4 we extend the development to the sequential setting. We deliberately defer the discussion of the existing body of related work until Section 5, in order to open up for a better understanding of the relationships to the new developments presented in Sections 3–4. We also discuss various attractive features of NSMC that are of interest in high-dimensional settings, e.g. the fact that it is easy to distribute the computation, which results in improved memory efficiency and lower communication costs. Finally, the last section profiles our method extensively with a state-of-the-art competing algorithm on several high-dimensional data sets. We also show the performance of inference and the modularity on a d = 1 056 dimensional climatological spatio-temporal model (Fu et al., 2012) structured according to Figure 1.
2. Background and Inference Strategy 2.1. Sequential Monte Carlo Evaluating π ¯k (f ) as well as the normalisation constant Zk in (2) is typically intractable and we need to resort to approximations. SMC methods, or particle filters (PF), constitute a popular class of numerical approximations for sequential inference problems. Here we give a high-level introduction to the concepts underlying SMC methods, and postpone the details to Section 4. For a more extensive treatment we refer to Doucet & Johansen (2011); Capp´e et al. (2005); Doucet et al. (2001). In particular, we will use the auxiliary SMC method as proposed by Pitt & Shephard (1999). At iteration k − 1, the SMC sampler approximates the target distribution π ¯k−1 by a collection of weighted particles i i (samples) {(X1:k−1 , Wk−1 )}N i=1 . These samples define an empirical point-mass approximation of the target distribution
N π ¯k−1 (dx1:k−1 )
:=
N X i=1
Wi P k−1 i δX1:k−1 (dx1:k−1 ), (3) ` ` Wk−1
where δX (dx) denotes a Dirac measure at X. Each iteration of the SMC algorithm can then conceptually be described by three steps, resampling, propagation, and weighting. The resampling step puts emphasis on the most promising particles by discarding the unlikely ones and duplicating the likely ones. The propagation and weighting steps essentially correspond to using importance sampling when changing the target distribution from π ¯k−1 to π ¯k , i.e. simulating new particles from a proposal distribution and then computing corresponding importance weights. 2.2. Adapting the Proposal Distribution The first working SMC algorithm was the bootstrap PF by Gordon et al. (1993), which propagates particles by sampling from the system dynamics and computes importance weights according to the observation likelihood (in the state space setting). However, it is well known that the bootstrap PF suffers from weight collapse in high-dimensional settings (Bickel et al., 2008), i.e. the estimate is dominated by a single particle with weight close to one. This is an effect of the mismatch between the importance sampling proposal and the target distribution, which typically gets more pronounced in high dimensions. More efficient proposals, partially alleviating the degeneracy issue for some models, can be designed by adapting the proposal distribution to the target distribution (see Section 4.2). Naesseth et al. (2014a) make use of the fully adapted SMC method (Pitt & Shephard, 1999) for doing inference in a (fairly) high-dimensional discrete model where xk is a 60-dimensional discrete vector. They can then make use of forward filtering and backward simulation, operating on the individual components of each xk , in order to sample from the fully adapted SMC proposals. However, this method is limited to models where the latent space is either discrete or Gaussian and the optimal proposal can be identified with a tree-structured graphical model. Our development can be seen as a non-trivial extension of this technique. Instead of coupling one SMC sampler with an exact forward filter/backward simulator (which in fact reduces to an instance of standard SMC), we derive a way of coupling multiple SMC samplers and SMC-based backward simulators. This allows us to construct procedures for mimicking the efficient fully adapted proposals for arbitrary latent spaces and structures in high-dimensional models.
3. Proper Weighting and Nested Importance Sampling In this section we will lay the groundwork for the derivation of the class of NSMC algorithms. We start by consid-
Nested Sequential Monte Carlo Methods
ering the simpler case of importance sampling (IS), which is a fundamental component of SMC, and introduce the key concepts that we make use of. In particular, we will use a (slightly nonstandard) presentation of an algorithm as an instance of a class, in the object-oriented sense, and show that these classes can be nested to an arbitrary degree. 3.1. Exact Approximation of the Proposal Distribution −1
Let π ¯ (x) = Z π(x) be a target distribution of interest. IS can be used to estimate an expectation π ¯ (f ) := Eπ¯ [f (X)] by sampling from a proposal distribution q¯(x) = Z −1 q(x) and PN PN computing the estimator ( i=1 W i )−1 i=1 W i f (X i ), i
) i i N with W i = Zπ(X q(X i ) , and where {(X , W )}i=1 are the weighted samples. It is well known that it is possible to replace the IS weight by a nonnegative unbiased estimate, and still obtain a valid (consistent, etc.) algorithm. One way to motivate this approach is by considering the random weight to be an auxiliary variable and to extend the target distribution accordingly. Our development is in the same flavour, but we will use a more explicit condition on the relationship between the random weights and the simulated particles. Specifically, we will make use of the following key property to formally justify the proposed algorithms.
Definition 1 (Properly weighted sample). A (random) pair (X, W ) is properly weighted for π if W ≥ 0 and E[f (X)W ] = π ¯ (f )Z for all measurable functions f . Note that proper weighting of {(X i , W i )}N i=1 implies unbiasedness of the normalising constant estimate. Indeed, takh P i N ing f (x) ≡ 1 gives E N1 i=1 W i = Z. Interestingly, to construct a valid IS algorithm for π ¯ it is sufficient to generate samples that are properly weighted w.r.t. the proposal distribution q. To formalise this claim, assume that we are not able to simulate exactly from q¯, but that it is possible to evaluate the unnormalised density q point-wise. Furthermore, assume we have access to a class Q, which works as follows. The constructor of Q requires the specification of an unnormalised density function, say, q, which will be approximated by the procedures of Q. Furthermore, to highlight the fact that we will typically use IS (and SMC) to construct Q, the constructor also takes as an argument a precision parameter M , corresponding to the number of samples used by the “internal” Monte Carlo procedure. An object is then instantiated as q = Q(q, M ). The class Q is assumed to have the following properties:
With the definition of Q in place, it is possible to generalise1 the basic importance sampler as in Algorithm 1, which generates a weighted sample {(X i , W i )}N ¯. i=1 targeting π Algorithm 1 Nested IS (steps 1–3 for i = 1, . . . , N ) 1. Initialise qi = Q(q, M ). 2. Set Zbi = qi .GetZ() and X i = qi .Simulate(). bi π(X i ) Z . q(X i ) PN 4. Compute Zb = N1 i=1 W i . 3. Set W i =
To see the validity of Algorithm 1 we can interpret the sampler as a standard IS algorithm for an extended target ¯ ¯ u)¯ distribution, defined as Π(x, u) := u Q(x, π (x)q −1 (x), ¯ u) is the joint PDF of the random pair where Q(x, ¯ is indeed a PDF that (q.Simulate(), q.GetZ()). Note that Π admits π ¯ as a marginal; take a measurable subset A ⊆ X and consider, Z ¯ (x) ¯ ¯ × R+ ) = 1A (x) u π Π(A Q(x, u)dxdu q(x) � � � � π (X) π ¯ b 1A (X)¯ =E Z = q¯ 1A Z=π ¯ (A), q(X) q where the penultimate equality follows from the fact that b is properly weighted for q. Furthermore, the standard (X, Z) ¯ and prounnormalised IS weight for a sampler with target Π ¯ is given by u π/q, in agreement with Algorithm 1. posal Q Algorithm 1 is an example of what is referred to as an exact approximation; see e.g., Andrieu & Roberts (2009); Andrieu et al. (2010). Algorithmically, the method appears to be an approximation of an IS, but samples generated by the algorithm nevertheless target the correct distribution π ¯. 3.2. Modularity of Nested IS To be able to implement Algorithm 1 we need to define a class Q with the required properties (A1). The modularity of the procedure (as well as its name) comes from the fact that we can use Algorithm 1 also in this respect. Indeed, let us now view π ¯ —the target distribution of Algorithm 1—as the proposal distribution for another Nested IS procedure and consider the following definition of Q:
(A1) Let q = Q(q, M ). Assume that: 1. The construction of q results in the generation of a (possibly random) member variable, accessible as Zb = q.GetZ(). The variable Zb is a nonnegative, R unbiased estimate of the normalising constant Z = q(x)dx. 2. Q has a member function Simulate which returns a (possibly random) variable X = q.Simulate(), such b is properly weighted for q. that (X, Z)
1. Algorithm 1 is executed at the construction of the object p = Q(π, N ), and p.GetZ() returns the normalising b constant estimate Z. 2. p.Simulate() simulates a categorical random variable B PN with P(B = i) = W i / `=1 W ` and returns X B . 1 With q.GetZ() 7→ Z and q.Simulate() returning a sample from q¯ we obtain the standard IS method.
Nested Sequential Monte Carlo Methods
Now, for any measurable f we have, � � N i X B b i bW E[f (X )Z] = E f (X )Z N Zb i=1 " # � � N bi π(X i ) 1 X Z fπ = E f (X i ) = q ¯ Z=π ¯ (f )Z, N i=1 q(X i ) q where, again, we use the fact that (X i , Zbi ) is properly b is properly weighted for q. This implies that (X B , Z) weighted for π and that our definition of Q(π, N ) indeed satisfies condition (A1). The Nested IS algorithm in itself is unlikely to be of direct practical interest. However, in the next section we will, essentially, repeat the preceding derivation in the context of SMC to develop the NSMC method.
Algorithm 2 SMC (fully adapted) b 1. Set {X0i }N i=1 to arbitrary dummy variables. Set Z0 = 1. 2. for k = 1 to n (a) Compute Zbk = Zbk−1 ×
n
1 N
PN
j=1
o j Zk (X1:k−1 ) .
(b) Draw m1:N from a multinomial distribution k j Zk (X1:k−1 ) , for j = with probabilities PN ` `=1 Zk (X1:k−1 ) 1, . . . , N . (c) Set L ← 0 (d) for j = 1 to N j i i. Draw Xki ∼ q¯k (· | X1:k−1 ) and let X1:k = j (X1:k−1 , Xki ) for i = L + 1, . . . , L + mjk . ii. Set L ← L + mjk .
4. Nested Sequential Monte Carlo 4.1. Fully Adapted SMC Samplers Let us return to the sequential inference problem. As before, let π ¯k (x1:k ) = Zk−1 πk (x1:k ) denote the target distribution at “time” k. The unnormalised density πk can be evaluated point-wise, but the normalising constant Zk is typically unknown. We will use SMC to simulate sequentially from the distributions {¯ πk }nk=1 . In particular, we consider the fully adapted SMC sampler (Pitt & Shephard, 1999), which corresponds to a specific choice of resampling weights and proposal distribution, chosen in such a way that the importance weights are all equal to 1/N . Specifically, the proposal distribution (often referred to as the optimal proposal) is given by q¯k (xk | x1:k−1 ) = Zk (x1:k−1 )−1 qk (xk | x1:k−1 ), where qk (xk | x1:k−1 ) :=
πk (x1:k ) . πk−1 (x1:k−1 )
RIn addition, the normalising “constant” Zk (x1:k−1 ) = qk (xk | x1:k−1 )dxk is further used to define the resampling weights, i.e. the particles at time k − 1 are resampled according to Zk (x1:k−1 ) before they are propagated to time k. For notational simplicity, we shall also define q1 (x1 | x0 ) = π1 (x1 ) and Z1 (x0 ) = Z1 . The fully adapted auxiliary SMC sampler is given in Algorithm 2. As mentioned above, at each iteration k = 1, . . . , n, the method produces unweighted samples {Xki }N i=1 approximating π ¯k . It also produces an unbiased estimate Zbk of Zk (Del Moral, 2004, Proposition 7.4.1). The algorithm is expressed in a slightly non-standard form; at iteration k we loop over the ancestor particles, i.e. the particles after resampling at iteration k − 1, and let each ancestor particle j generate mjk offsprings. (The variable L is just for bookkeeping and corresponds to the total number of particles at iteration k that have been generated up to the current loop iteration.) This is done to clarify the connection with the NSMC procedure below. Furthermore, we have included a (completely
superfluous) resampling step at iteration k = 1, where the “dummy variables” {X0i }N i=1 are resampled according to the N (all equal) weights {Z1 (X0i )}N i=1 = {Z1 }i=1 . The analogue of this step is, however, used in the NSMC algorithm, where the initial normalising constant Z1 is estimated. We thus have to resample the corresponding initial particle systems accordingly. 4.2. Fully Adapted Nested SMC Samplers In analogue with Section 3, assume now that we are not able to simulate exactly from q¯k , nor compute Zk . Instead, we have access to a class Q which satisfies condition (A1). The proposed NSMC method is then given by Algorithm 3. Algorithm 3 Nested SMC (fully adapted)) b 1. Set {X0i }N i=1 to arbitrary dummy variables. Set Z0 = 1. 2. for k = 1 to n j (a) Initialise qj = Q(qk (· | X1:k−1 ), M ) for j = 1, . . . , N . (b) Set Zbkj = qj .GetZ() for j = 1, . . . , N . n P o N bj . (c) Compute Zbk = Zbk−1 × 1 Z N
j=1
k
(d) Draw m1:N from a multinomial distribution with k Zbj probabilities PN k for j = 1, . . . , N . b` `=1 Zk (e) Set L ← 0 (f) for j = 1 to N i i. Compute Xki = qj .Simulate() and let X1:k = j i (X1:k−1 , Xk ) for i = L + 1, . . . , L + mjk . ii. delete qj . iii. Set L ← L + mjk .
Nested Sequential Monte Carlo Methods
Algorithm 3 can be seen as an exact approximation of the fully adapted SMC sampler in Algorithm 2. (In the Appendix we provide a formulation of NSMC with arbitrary proposals and resampling weights.) We replace the exact computation of Zk and exact simulation from q¯k , by the approximate procedures available through Q. Despite this approximation, however, Algorithm 3 is a valid SMC method. This is formalised by the following theorem. Theorem 1. Assume that Q satisfies condition (A1). Then, under certain regularity conditions on the function f : Xk 7→ Rd and for an asymptotic variance ΣM k (f ), both specified in the Appendix, we have
Algorithm 4 Backward simulator (fully adapted) 1. Draw Bn uniformly on {1, . . . , N }. en = X Bn . 2. Set X n 3. for k = n − 1 to 1 j e f j = πn ((X1:k , Xk+1:n )) for j = (a) Compute W k j πk (X1:k ) 1, . . . , N . (b) Draw Bk from a categorical distribution with probfj W abilities PN k for j = 1, . . . , N . f` W `=1
N 1/2
! N 1 X D i f (X1:k ) − π ¯k (f ) −→ N (0, ΣM k (f )), N i=1 D
i where {X1:k }M i=1 are generated by Algorithm 3 and −→ denotes convergence in distribution.
Proof. See Appendix, Section A.1.2. Remark 1. The key point with Theorem 1 is that, under certain √ regularity conditions, the NSMC method converges at rate N even for a fixed (and finite) value of the precision parameter M . The asymptotic variance ΣM k (f ), however, will depend on the accuracy and properties of the approximative procedures of Q. We leave it as future work to establish more informative results, relating the asymptotic variance of NSMC to that of the ideal, fully adapted SMC sampler. 4.3. Backward Simulation and Modularity of NSMC As previously mentioned, the NSMC procedure is modular in the sense that we can make use of Algorithm 3 also to define the class Q. Thus, we now view π ¯n as the proposal distribution that we wish to approximately sample from using NSMC. Algorithm 3 directly generates an estimate Zbn of the normalising constant of πn (which indeed is unbiased, see Theorem 2). However, we also need to generate a sample e1:n such that (X e1:n , Zbn ) is properly weighted for πn . X The simplest approach, akin to the Nested IS procedure described in Section 3.2, is to draw Bn uniformly on e1:n = X Bn . This will indeed result {1, . . . , N } and return X 1:n in a valid definition of the Simulate procedure. However, this approach will suffer from the well known path degeneracy of SMC samplers. In particular, since we call qj .Simulate() multiple times in Step 2(f)i of Algorithm 3, we risk to obtain (very) strongly correlated samples by this simple approach. It is possible to improve the performance of the algorithm by instead making use of a backward simulator (Godsill et al., e1:n . The back2004; Lindsten & Sch¨on, 2013) to simulate X ward simulator, given in Algorithm 4, is a type of smoothing algorithm; it makes use of the particles generated by a forward pass of Algorithm 3 to simulate backward in “time” a e1:n approximately distributed according to π trajectory X ¯n .
k
ek:n = (X Bk , X ek+1:n ). (c) Set X k
Remark 2. Algorithm 4 assumes unweighted particles and can thus be used in conjunction with the fully adapted NSMC procedure of Algorithm 2. If, however, the forward filter is not fully adapted the weights need to be accounted for in the backward simulation; see the Appendix. The modularity of NSMC is established by the following result. Definition 2. Let p = Q(πn , N ) be defined as follows: 1. The constructor executes Algorithm 3 with target distribution πn and with N particles, and p.GetZ() returns the estimate of the normalising constant Zbn . e1:n . 2. p.Simulate() executes Algorithm 4 and returns X Theorem 2. The class Q defined as in Definition 2 satisfies condition (A1). Proof. See Appendix, Section A.1.3. A direct, and important, consequence of Theorem 2 is that NSMC can be used as a component of powerful learning algorithms, such as the particle Markov chain Monte Carlo (PMCMC) method (Andrieu et al., 2010) and many of the other methods discussed in Section 5. Since standard SMC is a special case of NSMC, Theorem 2 implies proper weighting also of SMC.
5. Practicalities and Related Work There has been much recent interest in using SMC within SMC in various ways. The SMC2 by Chopin et al. (2013) and the recent method by Crisan & M´ıguez (2013) are sequential learning algorithms for state space models, where one SMC sampler for the parameters is coupled with another SMC sampler for the latent states. Johansen et al. (2012) and Chen et al. (2011) address the state inference problem by splitting the state variable into different components and run coupled SMC samplers for these components. These methods differ substantially from NSMC; they solve different
Nested Sequential Monte Carlo Methods
problems and the “internal” SMC sampler(s) is constructed in a different way (for approximate marginalisation instead of for approximate simulation). The method most closely related to NSMC is the spacetime particle filter (ST-PF) (Beskos et al., 2014a), which has been developed independently and in parallel with our work. The ST-PF is also designed for solving inference problems in high-dimensional models. It can be seen as a island PF (Verg´e et al., 2013) implementation of the method presented by Naesseth et al. (2014b). Specifically, for a spatiotemporal models they run an island PF over both spatial and temporal dimensions. A distinction between NSMC and ST-PF, however, is that in the latter each particle in the “outer” SMC sampler comprises a complete particle system from the “inner” SMC sampler. For NSMC, on the other hand, the particles will simply correspond to different hypotheses about the latent variables (as in standard SMC), regardless of how many samplers that are nested. This is a key feature of NSMC, since it implies that it is easily distributed over the particles. The main computational effort of Algorithm 3 is the construction of {qj }N j=1 and the calls to the Simulate procedure, which can be done independently for each particle. This leads to improved memory efficiency and lower communication costs. Furthermore, we have found (see Section 6) that NSMC can outperform ST-PF even when run on a single machine with matched computational costs. Another strength of NSMC methods are their relative ease of implementation, which we show in Section 6.3. We use the framework to sample from what is essentially a cubic grid Markov random field (MRF) model just by implementing three nested samplers, each with a target distribution defined on a simple chain. There are also other SMC-based methods designed for highdimensional problems, e.g., the block PF studied by Rebeschini & van Handel (2015), the location particle smoother by Briggs et al. (2013) and the PF-based methods reviewed in Djuric & Bugallo (2013). However, these methods are all inconsistent, as they are based on various approximations that result in systematic errors. Other methods using nested Monte Carlo algorithms include the previously mentioned PMCMC (Andrieu et al., 2010), where SMC is used as a component of MCMC. Another example is the importance sampling squared (IS2 ) algorithm by Tran et al. (2013), approximating intractable weights in IS using an IS on the latent space. The objective, estimating static parameters θ, is different from the application of NSMC we present here. This is not to say that the NSMC methods can not be used for learning. The situation is quite the contrary, in fact we show a concrete example in the Appendix of how IS2 can be seen as a special case of sequential nested IS. Furthermore, our proposed algorithms can be used as a component in most of the algorithms mentioned above which further increases the scope of models they can handle.
6. Experimental Results We illustrate NSMC on three high-dimensional examples, both with real and synthetic data. We compare NSMC with standard (bootstrap) PF and the ST-PF of Beskos et al. (2014a) with equal computational budgets on a single machine (i.e., neglecting the fact that NSMC is more easily distributed). These methods are, to the best of our knowledge, the only other available consistent methods for full Bayesian inference in general sequential models. For more detailed explanations of the models and additional results, see the Appendix. 6.1. Gaussian State Space Model We start by considering a high-dimensional Gaussian state space model, where we have access to the true solution from the Kalman filter (Kalman, 1960). The latent variables and measurements {X1:k , Y1:k }, with {Xk , Yk } = d {Xk,l , Yk,l }l=1 , are modeled by a d × k lattice Gaussian MRF, which can be identified with a linear Gaussian state space model (see the Appendix). We run a 2-level NSMC sampler. The outer level is fully adapted, i.e. the proposal distribution is qk = p(xk | xk−1 , yk ), which thus constitute the target distribution for the inner level. To generate properly weighted samples from qk , we use a bootstrap PF operating on the d components of the vector xk . Note that we only use bootstrap proposals where the actual sampling takes place, and that the conditional distribution p(xk | xk−1 , yk ) is not explicitly needed. We simulate data from this model for k = 1, . . . , 100 for different values of d = dim(xk ) ∈ {50, 100, 200}. The exact filtering marginals are computed using the Kalman filter. We compare with both the ST-PF and standard (bootstrap) PF. The results are evaluated based on the effective sample size (ESS, see e.g. Fearnhead et al. (2010)) defined as, i�−1 � h (b xk,l −µk,l )2 , (4) ESS(xk,l ) = E 2 σ k,l
2 where x bk,l denote the mean estimates and µk,l and σk,l denote the true mean and variance of xk,l | y1:k obtained from the Kalman filter. The expectation in (4) is approximated by averaging over 100 independent runs of the involved algorithms. The ESS reflects the estimator accuracy, obvious by the definition which is tightly related to the mean-squarederror. Intuitively the ESS corresponds to the equivalent number of i.i.d. samples needed for the same accuracy.
We also consider the effective resample size (ERS), which is based on the resampling weights at the top levels in the respective SMC algorithms, and defined as ERS =
(
PN
bi )2 Z k 2 . b (Z i )
i=1
PN
i=1
(5)
k
The ERS is an estimate of the effective number of unique particles (or particle systems in the case of ST-PF) available at each resampling step.
Nested Sequential Monte Carlo Methods
ESS
d = 50
d = 100 800
800
700
700
700
600
600
600
500
500 NSMC
NSMC
500
400
400
300
300
300
200
200
400
ST-PF
100 0
1
10
20
30
40
50
60
70
80
90
Bootstrap 100
ST-PF
100 0
k
1
10
20
30
40
50
60
70
80
90
200
330
330
300
300
270
270
270
240
240
240
ST-PF
210
210
150
NSMC
120 90
ST-PF
150 120
30 20
30
40
50
20
30
40
60
70
80
90
Bootstrap 100
k
60
70
80
90
100
180 150
NSMC
60
30
30 1
10
20
30
40
50
60
70
80
90
0
100
ST-PF
90
60 0
50
120
90
60 10
10
210
180
180
1
1
k
300
0
ST-PF
100 0
100
NSMC
k
330
ERS
d = 200
800
NSMC 1
10
20
30
k
40
50
60
70
80
90
100
k
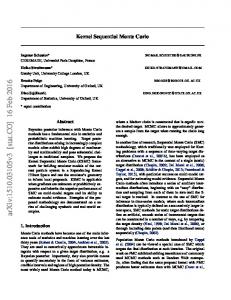
Figure 2. Top: Median (over dimension) ESS (4) and 15–85% percentiles (shaded region). Bottom: Average ERS (5) based on the resampling weights in the (outermost) particle filter. The results are based on 100 independent runs for the Gaussian MRF with dimension d.
We have conducted additional experiments with different model parameters and different choices for N and M (some additional results are given in the Appendix). Overall the results seem to be in agreement with the ones presented here, however ST-PF seems to be more robust to the trade-off between N and M . A rule-of-thumb for NSMC is to generally try to keep N as high as possible, while still maintaining a reasonably large ERS. 6.2. Non-Gaussian State Space Model Next we consider a non-Gaussian SSM, defined by its transition probability p(xk | xk−1 ), a localised Gaussian mixture, and measurement probability p(yk | xk ), which is tdistributed. This example is borrowed from Beskos et al. (2014a), where the full details of the model are given. Beskos et al. (2014a) report improvements for ST-PF over both the bootstrap PF and the block PF by Rebeschini & van Handel (2015). The dimension in this case is d = 1 024.
30 25 20
ESS
We use N = 500 and M = 2 · d for NSMC, N = 500 and M = 4 · d for ST-PF, and N = 2 000 · d for the bootstrap PF. The ST-PF is allowed twice as many particles as the NSMC, since it does not require running backward simulation. The overall computational times of the two algorithms are comparable, being somewhat lower for NSMC. We report the results in Figure 2. Note that the bootstrap PF is omitted from d = 100, 200 due to its poor performance already for d = 50 (which is to be expected). Each dimension l = 1, . . . , d provides us with a value of the ESS, so we present the median (lines) and 15–85% percentiles (shaded regions) in the first row of Figure 2. The ERS is displayed in the second row of Figure 2.
15 10 NSMC 5 0
1
10
20
30
40
50
60
70
80
90
ST-PF Bootstrap 100
k
Figure 3. Median ESS with 15 − 85% percentiles (shaded region) for the non-Gaussian SSM for NSMC, ST-PF and bootstrap PF.
We use N = M = 100 for both ST-PF and NSMC (the special structure of this model implies that there is no significant computational overhead from running backward simulation) and the bootstrap PF is given N = 10 000. We report the ESS (estimated as in Carpenter et al. (1999)) in Figure 3. The ESS for the bootstrap PF is close to 0, for ST-PF around 1–2, and for NSMC slightly higher at 7–8. However, we note that all methods perform quite poorly on this model, and to obtain satisfactory results it would be necessary to use more particles. 6.3. Spatio-Temporal Model – Drought Detection In this final example we study the problem of detecting droughts based on the measured precipitation for different locations on earth. We look at the situation in North America during the years 1901–1950 and the Sahel region in Africa
Nested Sequential Monte Carlo Methods
400
Nr of drought locations
Nr of drought locations
160
120
80
300
200
p(x = 1) > 0.5 p(x = 1) > 0.7
100
40 p(x = 1) > 0.5 0
1900
1910
1920
Year
1930
1940
p(x = 1) > 0.7 p(x = 1) > 0.9 1950
p(x = 1) > 0.9 0
1950
1960
1970
North America region 1.0
60◦ N
Sahel region 1.0
60◦ N
0.9
0.8
0.8
0.7
0.7
0.7
0.6
0.6 40◦ N
140 W
0.6 40◦ N
0.5 ◦
0.5 ◦
140 W
140 W
0.4
0.4
0.4
0.3
0.3
0.3
0.2
0.2
0.1
North America 1939
1.0
60◦ N
0.8
0.5
80◦ W
2000
0.9
◦
110◦ W
1990
0.9
40◦ N
20◦ N
1980
Year
0.0
20◦ N
0.1
110◦ W
80◦ W
0.2 20◦ N
0.1
0.0
110◦ W
North America 1940
80◦ W
0.0
North America 1941
Figure 4. Top: Number of locations with estimated P(Xk,i,j = 1 | y1:k ) > {0.5, 0.7, 0.9} for the two regions. Bottom: Estimate of P(Xk,i,j = 1 | y1:k ) for all sites over a span of 3 years. All results for N = 100, N1 = {30, 40}, N2 = 20.
during the years 1950–2000. These spatial regions and time frames were chosen since they include two of the most devastating droughts during the last century, the so-called Dust Bowl in the US during the 1930s (Schubert et al., 2004) and the decades long drought in the Sahel region in Africa starting in the 1960s (Foley et al., 2003; Hoerling et al., 2006). We consider the spatio-temporal model defined by Fu et al. (2012) and compare with the results therein. Each location in a region is modelled to be in either a normal state 0 or in an abnormal state 1 (drought). Measurements are given by precipitation (in millimeters) for each location and year. At every time instance k our latent structure is described by a rectangular 2D grid Xk = {Xk,i,j }I,J i=1,j=1 ; in essence this is the model showcased in Figure 1. Fu et al. (2012) considers the problem of finding the maximum aposteriori configuration, using a linear programming relaxation. We will instead compute an approximation of the full posterior filtering distribution π ¯k (xk ) = p(xk | y1:k ). The rectangular structure is used to instantiate an NSMC method that on the first level targets the full posterior filtering distribution. To sample from Xk we run, on the second level, an NSMC procedure that operates on the “columns” Xk,1:I,j , j = 1, . . . , J. Finally, to sample each column Xk,1:I,j we run a third level of SMC, that operates on the individual components Xk,i,j , i = 1, . . . , I, using a bootstrap proposal. The structure of our NSMC method applied to this particular problem is illustrated in Figure 5.
N
→
···
Xk−1
Xk
···
Xk+1
M1 →
Xk,1:I,1
Xk,1:I,2
Xk,1:I,3
↓ M2
↓ M2
↓ M2
Figure 5. Top: Full spatio-temporal model depicted in Figure 1 as a chain. Bottom: Decomposition of xk into chains to run the two levels of NSMC methods.
Figure 4 gives the results on the parts of North America, I × J = 20 × 30 (d = 600), and the Sahel region, I × J = 24 × 44 (d = 1 056), that we consider. We ran the NSMC method with N = 100, M1 = {30, 40}, M2 = 20 for the North America and Sahel region, respectively. The first row shows the number of locations where the marginal probability P(Xk,i,j = 1 | y1:k ) estimate exceeds {0.5, 0.7, 0.9}, for both regions. These results seems to be in agreement with Fu et al. (2012, Figures 3, 6), i.e. increased probability of drought for the 1930s Dust Bowl and extended drought in the Sahel region starting approximately in the 1970s. However, we also receive an approximation of the full posterior and can visualise uncertainty in our estimates, as illus-
Nested Sequential Monte Carlo Methods
trated by the three different levels of posterior probability for drought. In general, we obtain a rich sample diversity from the posterior distribution. However, for some problematic years the sampler degenerates, with the result that the three credibility levels all coincide. This is also visible in the second row of Figure 4, where we show the posterior estimates p(xk,i,j | y1:k ) for the years 1939–1941, overlayed on the regions of interest. For year 1940 the sampler degenerates and only reports 0-1 probabilities for all sites. Naturally, one way to improve the estimates is to run the sampler with a larger number of particles, which has been kept very low in this quick illustration for computational reasons. We have shown that a straight-forward NSMC implementation with fairly few particles can attain reasonable approximations to the filtering problem for dimensions as high as 1 000, if not higher. This means that NSMC methods takes the SMC framework an important step closer to being viable for high-dimensional statistical inference problems. However, NSMC is not a silver bullet for solving high-dimensional inference problems, and for some models or for even higher dimensional problems, the method will likely be inadequate. Hence, much work remains to be done, for instance on combining NSMC with other techniques for high-dimensional inference such as localisation (Rebeschini & van Handel, 2015) and annealing (Beskos et al., 2014b), in order to solve even more challenging problems.
Acknowledgments This work was supported by the projects: Learning of complex dynamical systems (Contract number: 637-2014-466) and Probabilistic modeling of dynamical systems (Contract number: 621-2013-5524), both funded by the Swedish Research Council.
Nested Sequential Monte Carlo Methods
A. Appendix In this appendix we start out in Section A.1 by providing a more general formulation of the NSMC method and proofs of the central limit and proper weighting theorems of the main manuscript. We also detail (Section A.2) a straightforward extension of nested IS to a sequential version. We show that a special case of this nested sequential IS turns out to be more or less equivalent to the importance sampling squared algorithm by Tran et al. (2013). This relationship serves as evidence that illustrates that the NSMC framework being more widely applicable than the scope of problems considered in this article. Finally, in Section A.3 we give more details and results on the experiments considered in the main manuscript. A.1. Nested Sequential Monte Carlo We start by presenting a general formulation of a nested auxiliary SMC sampler in Algorithm 5. In this formulation, R qk (xk | x1:k−1 ) is an arbitrary (unnormalised) proposal, normalised by Zk (x1:k−1 ) = qk (xk | x1:k−1 )dxk . Furthermore, the resampling weights are obtain by multiplying the importance weights with the arbitrary adjustment multipliers νk−1 (x1:k−1 , Zk ), which may depend on both the state sequence x1:k−1 and the normalising constant (estimate). The fully adapted NSMC sampler (Algorithm 3 in the main document) is obtained as a special case if we choose qk (xk | x1:k−1 ) =
πk (x1:k ) πk−1 (x1:k−1 )
and νk−1 (x1:k−1 , Zk ) = Zk , in which case the importance weights are indeed given by Wki ≡ 1. Algorithm 5 Nested SMC (auxiliary SMC formulation) i b 1. Set {X0i }N i=1 to arbitrary dummy variables. Set W0 = 1 for i = 1, . . . , N . Set Z0 = 1.
2. for k = 1 to n j (a) Initialise qj = Q(qk (· | X1:k−1 ), M ) for j = 1, . . . , N . j j b (b) Compute Zk = q .GetZ() for j = 1, . . . , N . j j bj ) for j = 1, . . . , N . (c) Compute νbk−1 = νk−1 (X1:k−1 ,Z k
νbj W j for j = 1, . . . , N . (d) Draw m1:N from a multinomial distribution with probabilities PN k−1 k−1 k ` ` bk−1 Wk−1 `=1 ν (e) Set L ← 0 (f) for j = 1 to N j i = (X1:k−1 , Xki ) for i = L + 1, . . . , L + mjk . i. Compute Xki = qj .Simulate() and let X1:k i Zbkj πk (X1:k ) for i = L + 1, . . . , L + mjk . ii. Compute Wki = j j j πk−1 (X1:k−1 ) νbk−1 qk (Xki | X1:k−1 ) iii. delete qj . iv. Set L ← L + mjk . o n P o nP PN N N W j )/( Wj ) . (g) Compute Zbk = Zbk−1 × 1 νbj W j × ( N
j=1
k−1
k−1
j=1
k
j=1
k−1
A.1.1. N ESTED SMC IS SMC The validity of Algorithm 5 can be established by interpreting the algorithm as a standard SMC procedure for a sequence of bk is computed deterministically, proper weighting (i.e., unbiasedness) ensures that Zbk = Zk extended target distributions. If Z and it is evident that the algorithm reduces to a standard SMC sampler. Hence, we consider the case when the normalising constant estimates Zbk are random. For k = 1, . . . , n + 1, let us introduce the random variable Uk−1 which encodes the complete internal state of the object q M generated by q = Q(qk (· | x1:k−1 ), M ). Let the distribution of Uk−1 be denoted as ψ¯k−1 (uk−1 | x1:k−1 ). To put Algorithm 5 into a standard (auxiliary) SMC framework, we shall interpret steps 2a–2b of Algorithm 5 as being the last two steps carried out during iteration k − 1, rather than the first two steps carried out during iteration k. This does not alter the algorithm per se, but it results in that the resampling step is conducted first at each iteration, which is typically the case for standard auxiliary SMC formulations.
Nested Sequential Monte Carlo Methods
The estimator of the normalising constant is computable from the internal state of q, so that we can introduce a function τk such that Zbk = τk (Uk−1 ). Furthermore, note that the simulation of Xk via Xk = q.Simulate() is based solely on the internal state Uk−1 , and denote by γ¯kM (xk | Uk−1 ) the distribution of Xk . Lemma 1. Assume that Q satisfies condition (A1) in the main manuscript. Then, Z M τk (uk−1 )¯ γkM (xk | uk−1 )ψ¯k−1 (uk−1 | x1:k−1 )duk−1 = qk (xk | x1:k−1 ). Proof. The pair (Xk , τk (Uk−1 )) are properly weighted for qk . Hence, for a measurable function f , ZZ M E[f (Xk )τk (Uk−1 ) | x1:k−1 ] = f (xk )τk (uk−1 )¯ γkM (xk | uk−1 )ψ¯k−1 (uk−1 | x1:k−1 )duk−1 dxk Z Z = Zk (x1:k−1 ) f (xk )¯ qk (xk | x1:k−1 )dxk = f (xk )qk (xk | x1:k−1 )dxk . Since f is arbitrary, the result follows. We can now define the sequence of (unnormalised) extended target distributions for the Nested SMC sampler as, Πk (x1:k , u0:k ) :=
τk (uk−1 )ψ¯kM (uk | x1:k )¯ γkM (xk | uk−1 ) πk (x1:k ) Πk−1 (x1:k−1 , u0:k−1 ), qk (xk | x1:k−1 ) πk−1 (x1:k−1 )
and Π0 (u0 ) = ψ¯0M (u0 ). We write Θk = Xk × Uk for the domain of Πk . Lemma 2. Assume that Q satisfies condition (A1) in the main manuscript. Then, Z τk (uk−1 )¯ γkM (xk | uk−1 )Πk−1 (x1:k−1 , u0:k−1 )du0:k−1 = πk−1 (x1:k−1 )qk (xk | x1:k−1 ). R Proof. The proof follows by induction. At k = 1, we have τ1 (u0 )¯ γ1M (x1 | u0 )ψ¯0M (u0 )du0 = q1 (x1 ) by Lemma 1. Hence, assume that the hypothesis holds for k ≥ 1 and consider Z M τk+1 (uk )¯ γk+1 (xk+1 | uk )Πk (x1:k , u0:k )du0:k Z τk (uk−1 )ψ¯kM (uk | x1:k )¯ γkM (xk | uk−1 ) πk (x1:k ) M Πk−1 (x1:k−1 , u0:k−1 )du0:k = τk+1 (uk )¯ γk+1 (xk+1 | uk ) qk (xk | x1:k−1 ) πk−1 (x1:k−1 ) � � R R M πk (x1:k ) τk+1 (uk )¯ γk+1 (xk+1 | uk )ψ¯kM (uk | x1:k )duk τk (uk−1 )¯ γkM (xk | uk−1 )Πk−1 (x1:k−1 , u0:k−1 )du0:k−1 = πk−1 (x1:k−1 )qk (xk | x1:k−1 ) πk (x1:k )qk+1 (xk+1 | x1:k )πk−1 (x1:k−1 )qk (xk | x1:k−1 ) = = πk (x1:k )qk+1 (xk+1 | x1:k ), πk−1 (x1:k−1 )qk (xk | x1:k−1 ) where the penultimate equality follows by applying Lemma 1 and the induction hypothesis to the two integrals, respectively.
As a corollary to Lemma 2, it follows that Z Πk (x1:k , u0:k )du0:k = πk (x1:k ).
(6)
¯ k (x1:k , u0:k ) := Z −1 Πk (x1:k , u0:k ) we Consequently, Πk is normalised by the same constant Zk as πk , and by defining Π k ¯ 0 = Π0 , which is normalised by construction). obtain a probability distribution which admits π ¯k as a marginal (note that Π ¯ k as a proxy for π ¯ k can be used This implies that we can use Π ¯k in a Monte Carlo algorithm, i.e., samples drawn from Π to compute expectations w.r.t. π ¯k . This is precisely what Algorithm 5 does; it is a standard auxiliary SMC sampler for the (unnormalised) target sequence Πk , k = 0, . . . , n, with adjustment multiplier weights νk−1 (x1:k−1 , τk (uk−1 )) and proposal distribution γ¯kM (xk | uk−1 )ψ¯kM (uk | x1:k ). The (standard) weight function for this sampler is thus given by Wk (x1:k , u0:k ) ∝
1 τk (uk−1 )πk (x1:k ) , qk (xk | x1:k−1 )πk−1 (x1:k−1 ) νk−1 (x1:k−1 , τk (uk−1 ))
which is the same as the expression on line 2(f)ii of Algorithm 5.
(7)
Nested Sequential Monte Carlo Methods
A.1.2. C ENTRAL L IMIT T HEOREM – P ROOF OF T HEOREM 1 IN THE M AIN M ANUSCRIPT Now that we have established that Nested SMC is in fact an standard auxiliary SMC sampler, albeit on an extended state space, we can reuse existing convergence results from the SMC literature; see e.g., Johansen & Doucet (2008); Douc & Moulines (2008); Douc et al. (2009); Chopin (2004) or the extensive textbook by Del Moral (2004). Here, in order to prove Theorem 1 of the main manuscript, we make use of the result for the auxiliary SMC sampler by Johansen & Doucet (2008), which in turn is based on the central limit theorem by Chopin (2004). The technique used by Johansen & Doucet (2008) is to reinterpret (as detailed below) the auxiliary SMC sampler as a sequential importance sampling and resampling (SISR) particle filter, by introducing the modified (unnormalised) target distribution Π0k (x1:k , u0:k ) := νk (x1:k , τk+1 (uk ))Πk (x1:k , u0:k ).
(8)
The auxiliary SMC sampler described in the previous section can then be viewed as a SISR algorithm for (8). Indeed, if ¯ M (xk , uk | x1:k−1 , uk−1 ) := ψ¯M (uk | x1:k )¯ we write Q γkM (xk | uk−1 ) for the joint proposal distribution of (xk , uk ), then the k k weight function for this SISR sampler is given by ¯ 0 (x1:k , u0:k ) Π k Wk0 (x1:k , u0:k ) := ¯ M ¯ 0 (x1:k−1 , u0:k−1 ) ∝ νk (x1:k , τk+1 (uk ))Wk (x1:k , u0:k ), Qk (xk , uk | x1:k−1 , uk−1 )Π k−1
(9)
where Wk is defined in (7). This weight expression thus accounts for both the importance weights and the adjustment multipliers of the auxiliary SMC sampler formulation. ¯ k (and thus not π Since this SISR algorithm does not target Π ¯k ) directly, we use an additional IS step to compute estimators of expectations w.r.t. to π ¯ . The proposal distribution for this IS procedure is given by ¯ k (x1:k , u0:k ) := Q ¯M ¯0 Γ k (xk , uk | x1:k−1 , uk−1 )Πk−1 (x1:k−1 , u0:k−1 ).
(10)
Note that we obtain an approximation of (10) after the propagation Step 2(f)i of Algorithm 5, but before the weighting step. ¯ k (x1:k , u0:k ) and with proposal distribution (10), are given by The resulting IS weights, for target distribution Π ¯ k (x1:k , u0:k ) Π ¯ k (x1:k , u0:k ) =: ωk (x1:k , u0:k ) ∝ Wk (x1:k , u0:k ). Γ Hence, with f : Xk 7→ Rd being a test function of interest we can estimate Eπ¯k [f ] = EΠ¯ k [f ] (with obvious abuse of notation) by the estimator N i X Wki f (X1:k ) , PN ` `=1 Wk i=1
(11)
which, again, is in agreement with Algorithm 5. We have now reinterpreted the NSMC algorithm; first as a standard auxiliary SMC sampler, and then further as a standard SISR method. Consequently, we are now in the position of directly applying, e.g., the central limit theorem by Chopin (2004, Theorem 1). The conditions and the statement of the theorem are reproduced here for clarity. For any measurable function f : Θ0 7→ Rd , let Ve0M (f ) = Varψ¯0M (f ) and define, for any measurable function f : Θk 7→ Rd , M VekM (f ) = Vbk−1 (EQ¯ M [f ]) + EΠ¯ 0k−1 [VarQ¯ M (f )], k k
k > 0,
VkM (f ) = VekM (Wk0 (f − EΠ¯ 0k [f ])),
k ≥ 0,
VbkM (f )
k ≥ 0.
=
VkM (f )
+ VarΠ¯ 0k (f ),
Define recursively Φk to be the set of measurable functions f : Θk 7→ Rd such that there exists a δ > 0 with EΓ¯ k [kWk0 f k2+δ ] < ∞ and such that the function (x1:k−1 , u0:k−1 ) 7→ EQ¯ M [Wk0 f ] is in Φk−1 . Furthermore, assume that the identity function f ≡ 1 k belongs to Φk for each k. Then, it follows by Chopin (2004, Theorem 1 and Lemma A.1) that ! N X 1 D i i 1/2 f (X1:k , U0:k ) − EΓ¯ k [f ]) −→ N (0, VekM (f )), (12) N N i=1
Nested Sequential Monte Carlo Methods
for any function f such that the function (x1:k−1 , u0:k−1 ) 7→ EQ¯ M [f − EΓ¯ k [f ]] is in Φk−1 and there exists a δ > 0 such that k 2+δ EΓ¯ k [kf k ] < ∞. The convergence in (12) thus holds for the unweighted samples obtained after the propagation Step 2(f)i of Algorithm 5, but before the weighting step. To complete the proof, it remains to translate (12) into a similar result for the IS estimator (11). To this end we make use of Chopin (2004, Lemma A.2) which is related to the IS correction step of the SMC algorithm. Specifically, for a function f : Xk 7→ Rd , let f e : Θk 7→ Rd denote the extension of f to Θk , defined by f e (x1:k , u0:k ) = f (x1:k ). Then, for [ωk f e ] is in Φk−1 and there exists a δ > 0 such that any f : Xk 7→ Rd such that the function (x1:k−1 , u0:k−1 ) 7→ EQ¯ M k EΓ¯ k [kωk f e k2+δ ] < ∞, we have ! N i X Wki f (X1:k ) D 1/2 −π ¯k (f ) −→ N (0, ΣM N PN k (f )), ` W `=1 k i=1 M e e i eM where {(X1:k , Wki )}M ¯ k [f ])). i=1 are generated by Algorithm 5 and Σk (f ) = Vk (ωk (f − EΠ
A.1.3. N ESTED SMC G ENERATES P ROPERLY W EIGHTED S AMPLES – P ROOF OF T HEOREM 2 IN THE M AIN M ANUSCRIPT In the previous two sections we showed that the NSMC procedure is a valid inference algorithm for π ¯n . Next, we turn our attention to the modularity of the method and the validity of using the algorithm as a component in another NSMC sampler. Let us start by stating a more general version of the backward simulator in Algorithm 6. Clearly, if the forward NSMC procedure is fully adapted Wki ≡ 1, Algorithm 6 reduces to the backward simulator stated in the main manuscript. Algorithm 6 Backward simulator Wj 1. Draw Bn from a categorical distribution with probabilities PN n for j = 1, . . . , N . ` `=1 Wn en = XnBn . 2. Set X 3. for k = n − 1 to 1 fj = W j (a) Compute W k k
j ek+1:n )) πn ((X1:k ,X j πk (X1:k )
for j = 1, . . . , N .
fj W for j = 1, . . . , N . (b) Draw Bk from a categorical distribution with probabilities PN k f` `=1 Wk ek:n = (X Bk , X ek+1:n ). (c) Set X k
e1:n 4. return X e1:n ) generated by Algorithms 5 and 6 is properly weighted for πn (x1:n ), and thereby We will now show that the pair (Zbn , X prove Theorem 2 in the main manuscript. The proof is based on the particle Markov chain Monte Carlo (PMCMC) construction (Andrieu et al., 2010). The idea used by Andrieu et al. (2010) was to construct an extended target distribution, incorporating all the random variables generated by an SMC sampler as auxiliary variables. This opened up for using SMC approximations within MCMC in a provably correct way; these seemingly approximate methods simply correspond to standard MCMC samplers for the (nonstandard) extended target distribution. Here we will use the same technique to prove the proper weighing property of the NSMC procedure. We start by introducing some additional notation for the auxiliary variables of the extended target construction. While Algorithm 5 is expressed using multinomial random variables m1:N in the resampling step, it is more convenient for the sake of the k proof to explicitly introduce the ancestor indices {Aik }N ; see e.g., Andrieu et al. (2010). That is, Aik is a categorical random i=1 Ai
k variable on {1, . . . , N }, such that X1:k−1 is ancestor particle at iteration k − 1 of particle Xki . The resampling Step 2d of Algorithm 5 can then equivalently be expressed as: simulate independently {Aik }N i=1 from the categorical distribution with probabilities j j νbk−1 Wk−1 . PN ` ` bk−1 Wk−1 `=1 ν
Nested Sequential Monte Carlo Methods
Let Xk = {Xk1 , . . . , XkN }, Uk = {Uk1 , . . . , UkN }, and Ak = {A1k , . . . , AN k }, denote all the particles, internal states of the proposals, and ancestor indices, respectively, generated at iteration k of the NSMC algorithm. We can then write down the joint distribution of all the random variables generated in executing Algorithm 5 (up to an irrelevant permutation of the particle indices) as, (N ) n N aik aik Y Y Y i i νbk−1 Wk−1 ak ak ¯M ¯ NSMC (x1:n , u0:n , a1:n ) = Q (xik , uik | x1:k−1 , uk−1 Ψ ψ¯0M (ui0 ) ) , (13) PN ` k νb W ` i=1
k=1
i=1
`=1
k−1
k−1
where we interpret νbki and Wki as deterministic functions of (xi1:k , ui0:k ). Let Bn denote a random variable defined on {1, . . . , N }. The extended target distribution for PMCMC samplers corresponding to (13) is then given by bn b ¯ NSMC (x1:n , u0:n , a1:n ), ¯ 1:n , u0:n , a1:n , bn ) := Zn PWn Ψ Φ(x ` Zn N W n `=1
(14)
¯ is a probability where Zbn is a deterministic function of (x1:n , u0:n , a1:n ). We know from Andrieu et al. (2010) that Φ ¯ n as its marginal distribution for (X bn , U bn ). Consequently, by (6) it follows that the marginal distribution which admits Π 0:n 1:n bn distribution of X1:n is π ¯n . For later reference we define recursively bk−1 := abkk for k = 1, . . . , n, the particle indices for the trajectory obtained by tracing backward the genealogy of the bn ’th particle at iteration n. We now turn our attention to the backward simulator in Algorithm 6. Backward simulation has indeed been used in the context of PMCMC, see e.g. Whiteley (2010); Lindsten & Sch¨on (2013); Lindsten et al. (2014). The strategy used for combining PMCMC with backward simulation is to show that each step of the backward sampler corresponds to a partially collapsed ¯ This implies that the backward sampler leaves Φ ¯ invariant. Gibbs sampling step for the extended target distribution Φ. We use the same approach here, but we need to be careful in how we apply the existing results, since the PMCMC distribution ¯ is defined w.r.t. to Π ¯ n , whereas the backward simulator of Algorithm 6 works with the original target distribution π Φ ¯n . Nevertheless, from the proof of Lemma 1 by Lindsten et al. (2014) it follows that we can write the following collapsed ¯ as: conditional distribution of Φ a
b
¯ k , ubk:n Φ(b k:n
bk+1:n | x1:k , u0:k−1 , a1:k , xk+1:n , bk+1:n )
∝
Wkbk
bk
k+1:n k k k:n Πn ({xb1:k , xk+1:n }, {u0:k−1 , ubk:n }) b
akk k Πk (xb1:k , {u0:k−1 , ubkk })
k ψ¯kM (ubkk | xb1:k ).
(15)
To simplify this expression, consider, � � n Y γsM (xs | us−1 ) πs (x1:s ) τs (us−1 )ψ¯sM (us | x1:s )¯ Πn (x1:n , u0:n ) = Πk (x1:k , u0:k ) qs (xs | x1:s−1 ) πs−1 (x1:s−1 ) s=k+1 ) ( n M Y τs (us−1 )ψ¯s−1 (us−1 | x1:s−1 )¯ γsM (xs | us−1 ) πn (x1:n ) ψ¯nM (un | x1:n ) = ¯M . qs (xs | x1:s−1 ) πk (x1:k ) ψk (uk | x1:k )
(16)
s=k+1
By Lemma 1 we know that each factor of the product (in brackets) on the second line integrates to 1 over us−1 . Hence, k:n plugging (16) into (15) and integrating over ubk:n yields b
¯ k | x1:k , u0:k−1 , a1:k , xbk+1:n , bk+1:n ) ∝ W bk Φ(b k+1:n k
k+1:n k πn ({xb1:k , xk+1:n }) k πk (xb1:k )
,
which coincides with the expression used to simulate the index Bk in Algorithm 6. Hence, simulation of Bk indeed corre¯ and it will thus leave Φ ¯ invariant. (Note that, in comparison with sponds to a partially collapsed Gibbs sampling step for Φ k:n the PMCMC sampler derived by Lindsten et al. (2014) we further marginalise over the variables ubk:n which, however, still results in a valid partially collapsed Gibbs step.) We now have all the components needed to prove proper weighting of the combined NSMC/backward simulation procedure. For notational simplicity, we write ¯ BS,k (bk ) = Φ(b ¯ k | x1:k , u0:k−1 , a1:k , xbk+1:n , bk+1:n ), Ψ k+1:n
Nested Sequential Monte Carlo Methods
e1:n ) be generated by Algorithms 5 and 6. Let f be a measurable function for the distribution of Bk in Algorithm 6. Let (Zbn , X and consider Z e1:n )] = E[Zbn f (X
b01:n Zbn f (X1:n )
(
n Y
) ¯ BS,k (db0k ) Ψ ¯ NSMC (d(x1:n , u0:n , a1:n )) Ψ
k=1
Z = Zn
b01:n
f (X1:n )
(n−1 Y
) ¯ BS,k (db0k ) Ψ
0 ¯ Φ(d(x 1:n , u0:n , a1:n , bn )),
k=1
¯ BS,n (bn ) = where, for the second equality, we have used the definition (14) and noted that Ψ ¯ BS,k w.r.t. Φ, ¯ it follows that invariance of Ψ Z e1:n )] = Zn E[Zbn f (X
W bn PN n ` . `=1 Wn
However, by the
b1:n ¯ f (X1:n )Φ(d(x1:n , u0:n , a1:n , bn )) = Zn π ¯n (f ),
which completes the proof. A.2. Nested Sequential Importance Sampling Here we give the definition of the nested sequential importance sampler and we show that a special case of this is the importance sampling squared (IS2 ) method by Tran et al. (2013). A.2.1. N ESTED S EQUENTIAL I MPORTANCE S AMPLING We present a straightforward extension of the Nested IS class to a sequential IS version. The definition can be seen in Class 7. Note that we do not require that the procedure Q is identical for each individual proposal qk , thus we have a flexibility in designing our algorithm as can be seen in the example in Section A.2.2. We can motivate the algorithm in the same way as for Nested IS and similar theoretical results hold, i.e. Nested SIS is properly weighted for πn and it admits π ¯n as a marginal. Class 7 Nested SIS NSIS(πn , N )
all i for 1, . . . , N i
1. Initialise q = Q(q1 (·), M ). 2. Set Zbi = qi .GetZ(), X i = qi .Simulate(). 1
1
bi π1 (X i ) Z 1 . 3. Set W1i = 1 q1 (X1i ) 4. for k = 2 to n: i (a) Initialise qi = Q(qk (· | X1:k−1 ), M ). i i i i b (b) Set Zk = q .GetZ(), Xk = q .Simulate(). bi πk (X i | X i Z k k 1:k−1 ) i (c) Set Wki = Wk−1 . i i qk (Xk | X1:k−1 ) i i (d) Set X1:k ← (X1:k−1 , Xki ) P N 5. Compute Zbn = N1 i=1 Wni . Simulate() 1. Simulate B on {1, . . . , N } with P(B = i) = B 2. return X1:n .
GetZ() 1. return Zbn .
Wni bn . NZ
Nested Sequential Monte Carlo Methods
A.2.2. R ELATION TO IS2 Here we will show how IS2 , proposed by Tran et al. (2013), can be viewed as a special case of Nested SIS. We are interested in approximating the posterior distribution of parameters θ given some observed values y π ¯ (θ | y) ∝ p(y | θ)p(θ). We assume that the data likelihood p(y | θ) can, by introducing a latent variable x, be computed as an integral Z p(y | θ) = p(y | x, θ)p(x | θ) dx. Now, let our target distribution in Nested SIS be π ¯2 (θ, x) = π ¯2 (x | θ)¯ π1 (θ) = distributions to be
p(y | x,θ)p(x | θ) p(θ). p(y | θ)
We set our proposal
q¯1 (θ) = gIS (θ), q¯2 (x | θ) =
p(y | x, θ)p(x | θ) . p(y | θ)
First, Q(q1 (·), 1) runs an exact sampler from the proposal gIS . Then at iteration k = 2 we let the nested procedure Q(q2 (· | θi ), M ) be a standard IS algorithm with proposal h(x | y, θ), giving us properly weighted samples for q2 . Putting all this together gives us samples θi distributed according to gIS (θ) and weighted by PM p(y | x` ,θi )p(x` | θi ) 1 i p(y | xi , θi )p(xi | θi ) M pbM (y | θi )p(θi ) p(θ ) `=1 h(x` | y,θ i ) · = ,, W2i ∝ gIS (θi ) p(y | xi , θi )p(xi | θi ) gIS (θi ) PM where pbM (y | θi ) = M −1 `=1 proposed by Tran et al. (2013).
p(y | x` ,θ i )p(x` | θ i ) . h(x` | y,θ i )
(17)
Thus we obtain a Nested SIS method that is identical to the IS2 algorithm
A.3. Further Details on the Experiments We provide some further details and results for the experiments presented in the main manuscript. A.3.1. G AUSSIAN S TATE S PACE M ODEL We generate data from a synthetic d-dimensional (dim(xk ) = d) dynamical model defined by p(x1:k , y1:k ) ∝
k Y
φ(xj , yj )ρ(xj )ψ(xj , xj−1 ),
j=1
where the observation potential φ and interaction potentials ρ and ψ are given by φ(xk , yk ) =
d Y l=1
ρ(xk ) =
d Y
φl (xk,l , yk,l ) =
d Y
d Y l=1
τφ 2
(xk,l −yk,l )2
,
l=1
ρl (xk,l , xk,l−1 ) =
l=2
ψ(xk , xk−1 ) =
e−
d Y
e−
τψ 2
(xk,l −xk,l−1 )2
τρ 2
(xk,l −axk−1,l )2
,
l=2
ψl (xk,l , xk−1,l ) =
d Y
e−
,
l=1
and the parameters θ = (τψ , a, τρ , τφ ) = (1, 0.5, 1, 10) are assumed known. This can be visualised as a Gaussian rectangular (d × k) lattice MRF, i.e. it grows with k. The goal is to estimate the filtering distribution p(xk | y1:k ). Furthermore, the above model can be rewritten (useful in the exact implementation) as a high-dimensional linear Gaussian state space model, xk | xk−1 ∼ N (xk ; µk (xk−1 ), Σ), yk | xk ∼ N (yk ; xk , τφ−1 I),
Nested Sequential Monte Carlo Methods Median (over i=1:d) MSE of marginal posterior mean
MSE 10-4
10-2
20
40
t
60
80
MSE
Nested SMC (N=1000, M=50) Nested SMC (N=667, M=75) Nested SMC (N=500, M=100) Nested SMC (N=100, M=500) ST-PF (N=100, M=1000) ST-PF (N=200, M=500) ST-PF (N=400, M=250)
10-3
10-5 0
10-4
Median (over i=1:d) MSE of marginal posterior variance Nested SMC (N=1000, M=50) Nested SMC (N=667, M=75) Nested SMC (N=500, M=100) Nested SMC (N=100, M=500) ST-PF (N=100, M=1000) ST-PF (N=200, M=500) ST-PF (N=400, M=250)
10-5
10-6 0
100
Median (over i=1:d) MSE of marginal posterior mean
10-4
ST-PF (N=100, M=1000) ST-PF (N=200, M=500) ST-PF (N=400, M=250) SMC (N=100000)
MSE
10-3
MSE
10-2
20
40
t
60
80
100
Median (over i=1:d) MSE of marginal posterior variance ST-PF (N=100, M=1000) ST-PF (N=200, M=500) ST-PF (N=400, M=250) SMC (N=100000)
10-5
10-4
10-5 0
20
40
t
60
80
10-6 0
100
20
40
t
60
80
100
Figure 6. Top: Comparisons for different settings of N and M on the 50-dimensional SSM. Bottom: Illustrating the connection between ST-PF and the SMC method by Naesseth et al. (2014b).
where Σ and µk are given as follows τ + τ ρ ψ −τψ 0 . Σ= .. . .. 0 0
−τψ τρ + 2τψ .. . .. . .. . 0 0
0 −τψ .. . .. . .. . 0 0
··· 0 .. . .. . .. . 0 0
··· ··· .. . .. . .. . −τψ 0
0 0
0 0
0
0
0
0
−τψ τρ + 2τψ −τψ
0 −τψ τρ + τψ
−1
,
µk (xk−1 ) = τρ aΣxk−1 . Alternatively, in a more standard formulation, we have xk = Axk−1 + vk , vk ∼ N (0, Q), yk = xk + ek , ek ∼ N (0, R), where A = τρ aΣ, Q = Σ and R = τφ−1 I. Results (mean-squared-error) comparing NSMC and ST-PF for different settings of N and M can be found in the first row of Figure 6 and the second row displays the results when comparing ST-PF to the SMC method by Naesseth et al. (2014b) for equal computational budgets. A.3.2. S PATIO -T EMPORAL M ODEL – D ROUGHT D ETECTION We present the full model for drought detection with our notation, this is essentially the model by Fu et al. (2012) adapted for filtering. The latent variables for each location on a finite world grid, xk,i,j , are binary, i.e. 0 being normal state and 1 being the abnormal (drought) state. Measurements, yk,i,j , are available as real valued precipitation values in millimeters. The probabilistic model for filtering is given as,
p(x1:k , y1:k ) ∝
k Y n=1
φ(xn , yn )ρ(xn )ψ(xn , xn−1 ),
(18a)
Nested Sequential Monte Carlo Methods 1.0
1.0
1.0
0.9
0.9
0.9
0.8
0.8
20◦ N
0
20◦ N 0.7
0.6
0.6
0.5
◦
0
20◦ S
20◦ W
10◦ E
40◦ E
0.7
0.6
0.5
◦
0
0.4
0.4
0.3
0.3
0.2
0.8 20◦ N
0.7
20◦ S
0.2
0.1
0.1
0.0
0.0
20◦ W
Sahel region 1986
10◦ E
40◦ E
0.5
◦
0.4
0.3 20◦ S
0.2
0.1
20◦ W
Sahel region 1987
10◦ E
40◦ E
0.0
Sahel region 1988
Figure 7. Estimate of P(Xk,i,j = 1 | y1:k ) for all sites over a span of 3 years. All results for N = 100, N1 = {30, 40}, N2 = 20.
where I Y J Y
(
1 2 φ(xk , yk ) = exp − 2 (yk,i,j − µab,i,j xk,i,j − µnorm,i,j (1 − xk,i,j )) 2σ i,j i=1 j=1 ρ(xk ) =
J I Y Y
� exp C1
1xk,i,j =xk,i,j−1 + 1xk,i,j =xk,i−1,j
�
,
) ,
(18b)
(18c)
i=1 j=1
ψ(xk , xk−1 ) =
J I Y Y
� exp C2 1xk,i,j =xk−1,i,j .
(18d)
i=1 j=1
Here, 1 is the indicator function, and with the convention that all expressions in (18c) that end up with index 0 evalute to 0. The parameters C1 , C2 are set to 0.5, 3 as in (Fu et al., 2012). Location based parameters σi,j , µab,i,j , µnorm,i,j are estimated based on data from the CRU dataset with world precipitation data from years 1901 − 2012. For the North America region we consider 20 × 30 region with latitude 35 − 55◦ N and longitude 90 − 120◦ W . For the Sahel region we consider 24 × 44 region with latitude 6 − 30◦ N and longitude 10◦ W − 35◦ E. Note that for a few locations in Africa (Sahel region) the average 2 yearly precipitation was constant. For these locations we simply set µnorm,i,j to be this value, µab,i,j = 0 and σi,j to be the mean variance of all locations, thus this might have introduced some artifacts. Results for the Sahel region are displayed in Figure 7.
References Andrieu, C. and Roberts, G. O. The pseudo-marginal approach for efficient Monte Carlo computations. The Annals of Statistics, 37(2):697–725, 2009. Andrieu, Christophe, Doucet, Arnaud, and Holenstein, Roman. Particle Markov chain Monte Carlo methods. Journal of the Royal Statistical Society: Series B (Statistical Methodology), 72(3):269–342, 2010. Beskos, A., Crisan, D., Jasra, A., Kamatani, K., and Zhou, Y. A stable particle filter in high-dimensions. ArXiv:1412.3501, December 2014a. Beskos, Alexandros, Crisan, Dan, and Jasra, Ajay. On the stability of sequential Monte Carlo methods in high dimensions. Ann. Appl. Probab., 24(4):1396–1445, 08 2014b. Bickel, Peter, Li, Bo, and Bengtsson, Thomas. Sharp failure rates for the bootstrap particle filter in high dimensions, volume Volume 3 of Collections, pp. 318–329. Institute of Mathematical Statistics, Beachwood, Ohio, USA, 2008. Briggs, Jonathan, Dowd, Michael, and Meyer, Renate. Data assimilation for large-scale spatio-temporal systems using a location particle smoother. Environmetrics, 24(2):81–97, 2013. Capp´e, Olivier, Moulines, Eric, and Ryd´en, Tobias. Inference in Hidden Markov Models. Springer-Verlag New York, Inc., Secaucus, NJ, USA, 2005. ISBN 0387402640. Carpenter, J., Clifford, P., and Fearnhead, P. Improved particle filter for nonlinear problems. IEE Proceedings Radar, Sonar and Navigation, 146(1):2–7, 1999.
Nested Sequential Monte Carlo Methods
Chen, Tianshi, Sch¨on, Thomas B., Ohlsson, Henrik, and Ljung, Lennart. Decentralized particle filter with arbitrary state decomposition. IEEE Transactions on Signal Processing, 59(2):465–478, Feb 2011. Chopin, N. Central limit theorem for sequential Monte Carlo methods and its application to Bayesian inference. The Annals of Statistics, 32(6):2385–2411, 2004. Chopin, N., Jacob, P. E., and Papaspiliopoulos, O. SMC2: an efficient algorithm for sequential analysis of state space models. Journal of the Royal Statistical Society: Series B (Statistical Methodology), 75(3):397–426, 2013. Cohen, Jacques. Bioinformaticsan introduction for computer scientists. ACM Computing Surveys (CSUR), 36(2):122–158, 2004. Cressie, N. and Wikle, C. K. Statistics for spatio-temporal data. Wiley, 2011. Crisan, D. and M´ıguez, J. Nested particle filters for online parameter estimation in discrete-time state-space Markov models. ArXiv:1308.1883, August 2013. Del Moral, P. Feynman-Kac Formulae - Genealogical and Interacting Particle Systems with Applications. Probability and its Applications. Springer, 2004. Djuric, Petar M and Bugallo, M´onica F. Particle filtering for high-dimensional systems. In Computational Advances in Multi-Sensor Adaptive Processing (CAMSAP), 2013 IEEE 5th International Workshop on, pp. 352–355. IEEE, 2013. Douc, R. and Moulines, E. Limit theorems for weighted samples with applications to sequential Monte Carlo. The Annals of Statistics, 36(5):2344–2376, 2008. Douc, R., Moulines, E., and Olsson, J. Optimality of the auxiliary particle filter. Probability and Mathematical Statistics, 29: 1–28, 2009. Doucet, A. and Johansen, A. M. A tutorial on particle filtering and smoothing: Fifteen years later. In Crisan, D. and Rozovsky, B. (eds.), Nonlinear Filtering Handbook. Oxford University Press, 2011. Doucet, Arnaud, De Freitas, Nando, and Gordon, Neil. An introduction to sequential Monte Carlo methods. Springer, 2001. Fearnhead, Paul, Wyncoll, David, and Tawn, Jonathan. A sequential smoothing algorithm with linear computational cost. Biometrika, 97(2):447–464, 2010. Foley, J. A., Coe, M. T., Scheffer, M., and Wang, G. Regime shifts in the sahara and sahel: Interactions between ecological and climatic systems in northern africa. Ecosystems, 6:524–539, 2003. Fu, Qiang, Banerjee, Arindam, Liess, Stefan, and Snyder, Peter K. Drought detection of the last century: An MRF-based approach. In Proceedings of the 2012 SIAM International Conference on Data Mining, pp. 24–34, Anaheim, CA, USA, April 2012. Godsill, S. J., Doucet, A., and West, M. Monte Carlo smoothing for nonlinear time series. Journal of the American Statistical Association, 99(465):156–168, March 2004. Gordon, N. J., Salmond, D. J., and Smith, A. F. M. Novel approach to nonlinear/non-Gaussian Bayesian state estimation. Radar and Signal Processing, IEE Proceedings F, 140(2):107 –113, April 1993. Hoerling, M., Hurrell, J., Eischeid, J., and Phillips, A. Detection and attribution of twentieth-century northern and southern african rainfall change. Journal of Climate, 19:3989–4008, 2006. Johansen, A. M. and Doucet, A. A note on auxiliary particle filters. Statistics & Probability Letters, 78(12):1498–1504, 2008. Johansen, A. M., Whiteley, N., and Doucet, A. Exact approximation of Rao-Blackwellised particle filters. In Proceesings of the 16th IFAC Symposium on System Identification (SYSID), pp. 488–493, Brussels, Belgium, 2012. Kalman, R. E. A new approach to linear filtering and prediction problems. Transactions of the ASME, Journal of Basic Engineering, 82:35–45, 1960. Lindsten, F. and Sch¨on, T. B. Backward simulation methods for Monte Carlo statistical inference. Foundations and Trends in Machine Learning, 6(1):1–143, 2013.
Nested Sequential Monte Carlo Methods
Lindsten, F., Jordan, M. I., and Sch¨on, T. B. Particle Gibbs with ancestor sampling. Journal of Machine Learning Research, 15:2145–2184, 2014. Monteleoni, Claire, Schmidt, Gavin A., Alexander, Francis, Niculescu-Mizil, Alexandru, Steinhaeuser, Karsten, Tippett, Michael, Banerjee, Arindam, Blumenthal, M. Benno, Auroop R. Ganguly, Jason E. Smerdon, and Tedesco, Marco. Climate informatics. In Yu, Ting, Chawla, Nitesh, and Simoff, Simeon (eds.), Computational Intelligent Data Analysis for Sustainable Development. Chapman and Hall/CRC, London, 2013. Naesseth, Christian A., Lindsten, Fredrik, and Sch¨on, Thomas B. Capacity estimation of two-dimensional channels using sequential Monte Carlo. In Information Theory Workshop (ITW), 2014 IEEE, pp. 431–435, Nov 2014a. Naesseth, Christian A, Lindsten, Fredrik, and Sch¨on, Thomas B. Sequential Monte Carlo for graphical models. In Advances in Neural Information Processing Systems 27, pp. 1862–1870. Curran Associates, Inc., 2014b. Pitt, Michael K and Shephard, Neil. Filtering via simulation: Auxiliary particle filters. Journal of the American statistical association, 94(446):590–599, 1999. Rebeschini, P. and van Handel, R. Can local particle filters beat the curse of dimensionality? Ann. Appl. Probab. (to appear), 2015. Rue, H. and Held, L. Gaussian Markov Random Fields, Theory and Applications. CDC Press, Boca Raton, FL, USA, 2005. Schubert, S. D., Suarez, M. J., Pegion, P. J., Koster, R. D., and Bacmeister, J. T. On the cause of the 1930s dust bowl. Science, 303:1855–1859, 2004. Shumway, R. H. and Stoffer, D. S. Time Series Analysis and Its Applications – with R examples. Springer Texts in Statistics. Springer, New York, USA, third edition, 2011. Tran, M.-N., Scharth, M., Pitt, M. K., and Kohn, R. Importance sampling squared for Bayesian inference in latent variable models. ArXiv:1309.3339, sep 2013. Verg´e, Christelle, Dubarry, Cyrille, Del Moral, Pierre, and Moulines, Eric. On parallel implementation of sequential Monte Carlo methods: the island particle model. Statistics and Computing, pp. 1–18, 2013. Wainwright, Martin J and Jordan, Michael I. Graphical models, exponential families, and variational inference. Foundations R in Machine Learning, 1(1-2):1–305, 2008. and Trends Whiteley, N. Discussion on Particle Markov chain Monte Carlo methods. Journal of the Royal Statistical Society: Series B, 72(3):306–307, 2010. Wikle, C. K. Modern perspectives on statistics for spatio-temporal data. WIREs Computational Statistics, 7(1):86–98, 2015.