William J. Mitsch, Chris J. Anderson, Maria E. Hernandez, Anne Altor, and Li Zhang. School of Natural Resources and Environmental Science Graduate Program ...
Macrophyte Production ♦ 75
Net primary productivity of macrophyte communities after ten growing seasons in experimental marshes William J. Mitsch, Chris J. Anderson, Maria E. Hernandez, Anne Altor, and Li Zhang School of Natural Resources and Environmental Science Graduate Program, The Ohio State University
Introduction Direct measurements of macrophyte net primary productivity (NPP) were first made at the experimental wetland basins at the Olentangy River Wetland Research Park (ORWRP) in 1997. This study in 2003 represents the seventh set of such measurements. Before 1997 (the fourth growing season), harvesting was not considered a good option when vegetation was just getting started in the basins.
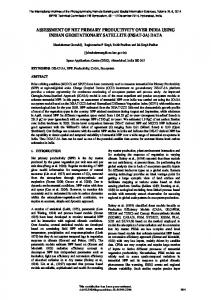
Methods Aboveground net primary productivity (NPP) was estimated by harvesting peak biomass at the end of the growing season on August 14-15, 2003 at selected stations in the two experimental wetland basins at the ORWRP (Figure 1). The same stations established from the boardwalk system in 1997 were used (Mitsch and Bouchard, 1998). To avoid harvesting the exact same spots, quadrats were not established at points were there had been harvesting in previous years. In each station, we used 1-m2 quadrats to delineate the area of vegetation for harvest. When no vegetation was present, the station was skipped. Overall, there are potentially 22 stations in each wetland but a maximum of 16 sites are harvested in each basin. Sixteen quadrats were sampled in Wetland 1 and 10 quadrats were sampled in Wetland 2. The only location where there were not sufficient locations for harvesting the maximum number of stations were in the outflow half (south half) of Wetland 2 where extensive herbivory had occurred during the past year. Eight out of a possible eight plots were sampled in the northern half (inflow area) but only two out of a possible eight plots in the southern half of Wetland 2. In each quadrat, plants were clipped at ground level (the water was lowered in the wetlands to make sampling easier and to allow rapid recovery of the clipped plants). Samples were segregated both by quadrat and by species, placed in plastic bags and weighed in the field with a hanging balance (accuracy ± 40 g). Sub-samples were taken to the laboratory where both wet weight and dry weight (dried at 105°F for 48 hours) were determined to estimate dry/wet ratios. Average ratios for each species were multiplied by total wet weight of each species in a quadrat to estimate total dry weight production. The sum of all species in a quadrat was the estimated peak biomass and hence annual aboveground net primary productivity (NPP).
Figure 1. Potential sampling stations for macrophyte harvesting. Sixteen were sampled in Wetland 1 and 10 in Wetland 2 in 2003.
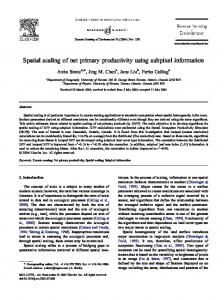
Results and Discussion Comparison of Basins and Location In 2003, macrophyte aboveground NPP was 432±60 gmyr (Table 1). Productivity was 192±54 gm-2yr-1 for 10 sites in Wetland 2, a 63% drop in marsh productivity from 2002. The productivity at the outflow was significantly lower than the inflow for both Wetland 1 and Wetland 2 in 2003 (α = 0.05), a pattern also seen in 2002 (Figure 2). 2
--1
Dry/wet Ratios As in the previous annual reports, dry/wet ratios of individual plants which are necessary for estimating NPP are provided (Table 2). Dry/wet ratios of dominant plants averaged 16% for Schoenoplectus in Wetland 1 but only 5% for the same species in Wetland 2. This difference reflects the overall vigor noticed of this species in the two wetlands. There was a similar lower dry/wet ratio determined
g m-2 yr-1
76 ♦ The Olentangy River Wetland Research Park 2003
Figure 2. Aboveground net primary productivity in Wetland 1 and 2 in inflow and outflow areas for 2003.
Table 1. Estimated net above-ground primary productivity (NAPP) of macrophyte communities in the Olentangy River experimental wetlands based on peak biomass harvest, 1999 - 2003 Numbers are ave±std error [# samples]. ______________________________________________ Wetland/ Year
Total NPP, g m-2 yr-1
Inflow NPP, g m-2 yr-1
Outflow NPP, g m-2 yr-1
601±126 [8] 597±87 [8] 454±98 [7] 915±126 [8] 570±90 [8]
714±90 [8] 368±79 [8] 181±120 [2] 462±79 [8] 295±45 [8]
_______________________________________________________________________________
Wetland 1 1999 657±76 [16] 2000 482±64 [16] 2001 393±87 [9] 2002 689±93 [16] 2003 432±60 [16]
Wetland 2 1999 1023±94 [16] 790±75 [8] 1256±130 [8] 2000 1013±105 [16] 882±126 [8] 1144±163 [8] 2001 832±85 [9] 746±76 [7] 1134±145 [2] 2002 519±64 [15] 699±84 [7] 361±53 [8] 2003 192±54 [10] 226±62 [8] 54±19 [2] ______________________________________________
for Typha and Leersia in Wetland 2 compared to Wetland 1. This was the first year that such a difference in the ratio was seen between the two wetlands.
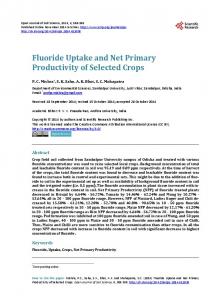
Comparison with Previous Years Overall, macrophyte cover decreased significantly in both wetlands in 2003 compared to similar plot readings in 2002 (Fig. 3). When paired sites were compared between the two wetlands (16 sites were paired in 2003) macrophyte plot productivity was statistically higher in the planted Wetland 1 than in the naturally colonized Wetland 2 (t = 0.0002; α
Table 2. Dry/wet ratios (ave±std error (# samples)) of dominant macrophytes in the Olentangy River wetlands in 2001-2003. ______________________________________________ Species/ Wetland 1 Wetland 2 ______________________________________________ Schoenoplectus tabernaemontani 2002 0.15±0.01 (14) 0.16±0.02 (14) 2003 0.16±0.01 (14) 0.05±0.01 (7) Polygonum sp. 2002 0.16±0.01 (13) 0.15±0.01 (7) Scirpus fluviatilis 2001 na na 2002 0.13±0.03 (3) na Sagittaria latifolia 2002 0.07±0.01 (3) na Sparganium eurycarpum 2001 0.16±0.03 (7) na 2002 0.10±0.01 (10) na 2003 0.15±0.01 (15) na Typha spp. 2001 0.20±0.05 (2) 0.29±0.03 (9) 2002 0.14±0.03 (4) 0.21±0.04 (8) 2003 0.23±0.02 (5) 0.11±0.00 (3) Leersia oryzoides 2002 0.25±0.03 (10) 0.23 ± 0.02 (4) 2003 0.21±0.2 (15) 0.10±0.02 (6) Cyperus sp. 2002 0.15±0.01 (8) 0.21±0.02 (9) Echinochloa sp. 2002 0.13 ±0.03 (5) 0.17±0.04 (2) Lycopus americanus 2002 0.18±0.01 (2) na Ludwigia sp. 2003 na 0.14±0.4 (2) ______________________________________________
Macrophyte Production ♦ 77
* *
*
*
*
Figure 3. Aboveground net primary productivity for 1997-2003 in the experimental wetlands. * indicates significant differences between the two wetlands (α=0.05). Table 3. Percent dominance of macrophytes by aboveground primary productivity in quadrats in 2002 (n = 16 for W1; n= 15 for W2) and 2003 (n = 16 for W1; n= 10 for W2) and species richness in quadrats. nd indicates not detected in biomass samples; 0.0 indicates presence but not significant contributor to productivity. _____________________________________________ 2002 2003 Species W1 W2 W1 W2 _____________________________________________ Schoenoplectus t., 72.8 55.9 36.7 37.3 Polygonum spp. 12.5 21.8 0.0 0.0 Typha spp. 6.9 16.1 16.3 41.9 Sparganium eury. 0.5 nd 18.0 nd Leersia oryzoides 5.1 6.3 28.2 25.3 Cyperus sp. 1.9 5.7 0.0 nd Echinochloa 0.6 0.4 0.0 nd Panicum sp. nd 0.2 nd 5.6 Lycopus sp. 0.5 0.0 nd nd Scirpus fluviatilis 0.5 nd 0.9 nd Sagittaria latifolia 0.4 0.0 0.0 nd Ludwigia palustris 0.0 0.0 nd nd Penthorum sedoides nd nd nd 0.0 Gratiola virginiana nd nd nd 0.0 Mimulus ringens nd nd 0.0 nd ___ ___ ___ ___ TOTAL 100.0 100.0 100.0 100.0 species richness 11 10 10 7 ______________________________________________
= 0.05) for the first time in 7 years. NPP was significantly higher in plots in Wetland 2 than in Wetland 1 for 4 straight years from 1998 to 2001.
Species Dominating the Productivity Macrophyte species that were found in the sample quadrats in 2002 and 2003 are listed in Table 3. Data for 2002 are corrected from data previously published (Mitsch et al., 2003). As was the case in previous years, the species harvested in the two basins indicate some differences that are still attributable to the planting of 1994. Wetland 1, which was planted with 12 species in May 1994, had four of those species still contributing to macrophyte productivity (Schoenoplectus tabernaemontani, Sparganium eurycarpum, Scirpus fluviatalis, and Sagittaria latifolia). S. tabernaemontani contributed 37% of the productivity in W1 and Sparganium eurycarpum added 18% of the productivity in 2003 (Table 3). Colonizing plants Typha and Leersia contributed 16 and 28% of the productivty in W1 in 2003. S. tabernaemontani, which had restored itself in W2 during the spring drawdown from the seed bank in W2 in 2001, still accounted for 37% of the productivity of W2 in 2003. Typha once again dominated the NPP in Wetland 2 with 42% of the productivity in 2003. Colonizing Typha provided 16% of the productivity in Wetland 1. Both were
78 ♦ The Olentangy River Wetland Research Park 2003 significant increases in dominance compared to 2002 when Schoenoplectus dominated productivity in both basins. By contrast Typha contributed 41.4% of the productivity in Wetland 1 and 100% of the productivity in Wetland 2 in 2001. Typha lost dominance in both wetlands because of muskrat herbivory in the winter of 2001, followed by seed bank restoration and subsequent agressive growth by Schoenoplectus in 2002. There were 10 macrophyte species found in the sampling plots in Wetland 1 and seven species in Wetland 2 in 2003 compared to 11 and 10 species seen in 2002 in Wetlands 1 and 2 respectively. Lycopus and Ludwigia palustris were seen in Wetland 1 in 2002 but not in 2003. One additional species, Mimulus ringens, was seen in plots for the first time in 2003 in Wetland 1. Two new species, Penthorum and Gratiola were observed in Wetland 2 plots in 2003 for the first time but five species—Sagittaria, Cyperus, Echinochloa, Lycopus and Ludwigia—were not seen in plots in 2003 after all were present in 2002 plots. Smartweed (Polygonum spp.) continued to be found in both wetland basins but was not nearly as prevalent in 2003 as it was in 2002, when it contributed 12 and 22% of the productivity respectively to Wetlands 1 and 2.
Basin Productivity Based on the aboveground productivity estimates reported here and estimates of macrophyte cover presented elsewhere in this annual report (Mitsch and Zhang, 2004; W1 = 5,549 m2; W2 = 3,253 m2), aboveground productivity by macrophytes was estimated to be 2397 and 625 kg per year in Wetlands 1 and 2 respectively (Table 4). Overall macrophyte organic productivity decreased 46% in Wetland 1 and 81% in Wetland 2 from 2002 to 2003. These numbers are significant for two reasons. First, although the macrophyte community substantially recovered from the herbivory and subsequent macrophyte losses of 2000 and 2001 in 2002, productivity once more decreased in 2003, due to herbivory and possibly high water levels, especially in Wetland 2. This could be a result of the spring water pulsing in 2003. Second, 2003 is the second year in a row where the planted Wetland 1 had a higher esimated macrophyte carbon sequestration than the naturally colonized Wetland 2. The total organic matter production by macrophytes over the last 7-year period is now almost the same in the two wetland basins at 22-23 Mg per basin (Table 4).
Table 4. Estimated macrophyte above-ground net primary productivity in each experimental wetland, kg drywt per wetland basin, 1997-2003 ______________________________________________ Year Wetland 1 Wetland 2 ______________________________________________ 2003 2397 625 2002 4478 3330 2001 963 1250 2000 1960 4265 1999 5800 6800 1998 3300 3500 1997 2525 3040 Total 22,323 22,810 ______________________________________________
References Mitsch, W.J. and V. Bouchard. 1998. Net primary productivity of macrophytes in experimental marshes. In: W.J. Mitsch and V. Bouchard (eds.), The Olentangy River Wetland Research Park at the Ohio State University, Annual Report 1997. The Ohio State University, Columbus, OH, pp. 71-75. Mitsch, W.J., C.J. Anderson, M.E. Hernandez, and L. Zhang. 2003. Net primary productivity of macrophyte communities after nine growing seasons in experimental planted and unplanted marshes. In: W.J. Mitsch, L. Zhang, and C.J. Anderson (eds.), The Olentangy River Wetland Research Park at the Ohio State University, Annual Report 2002. The Ohio State University, Columbus, OH, pp. 37-40. Mitsch, W.J. and L. Zhang. 2004. Plant community development after ten growing seasons in two experimental wetland basins. In: W.J. Mitsch, L. Zhang, and C. Tuttle (eds.), The Olentangy River Wetland Research Park at the Ohio State University, Annual Report 2003. The Ohio State University, Columbus, OH, pp. 69-74.