1182
IEEE JOURNAL OF SELECTED TOPICS IN SIGNAL PROCESSING, VOL. 10, NO. 7, OCTOBER 2016
Network-Based Statistic Show Aberrant Functional Connectivity in Alzheimer’s Disease Yafeng Zhan, Hongxiang Yao, Pan Wang, Bo Zhou, Zengqiang Zhang, Yan’e Guo, Ningyu An, Jianhua Ma, Xi Zhang, and Yong Liu
Abstract—Alzheimer’s disease (AD) and mild cognitive impairment (MCI) have been associated with impaired communication among large-scale brain networks. Given nature that interconnected subnetworks are responsible for daily behavior than a single pair of functional connectivity, it is valid to use a network-based statistic (NBS) method to exploit the clustering structure of connectivity alterations in AD/MCI. We explored abnormal network components using NBS based on resting-state functional magnetic resonance imaging (fMRI)connectivity in a sample of patients with AD (N = 35), MCI (N = 27) and age-matched healthy subjects (N = 27). The results demonstrated that patients had reduced functional connectivity strength in several components, including the default mode network, sensorimotor network, visual-sensory network, and visual-attention network. In patients with AD, the functional connectivity of these components of interest (COIs) exhibited greater attenuation than that in MCI subjects compared with normal cognition. A greater degree of cognitive impairment was correlated with a greater decrease in functional connectivity in the identified COIs. These results indicate that the neurodegenerative disruption of fMRI connectivity is widely distributed in several networks in AD/MCI. These profiles deepen our understanding of the neural basis of AD/MCI dysfunction and indicate the potential of resting-state fMRI measures as biomarkers or predictors of AD. Manuscript received November 19, 2015; revised April 26, 2016; accepted July 11, 2016. Date of publication August 16, 2016; date of current version September 23, 2016. This work was supported in part by the National Natural Science Foundation of China under Grants 81571062, 81471120, and 61431012, in part the Youth Innovation Promotion Association CAS under Grant 2014119, in part the Natural Science Foundation of Beijing under Grant 7152096, in part the Beijing Nova Program under Grant Z1511000003150112, and in part the Open Project Program of the National Laboratory of Pattern Recognition under Grant 201407344. The guest editor coordinating the review of this manuscript and approving it for publication was Dr. Andrew Zalesky. (Corresponding authors: Yong Liu and Xi Zhang.) Y. Zhang is with School of Biomedical Engineering, Southern Medical University, Guangzhou 510515, Guangdong, China, and also with the Brainnetome Center and National Laboratory of Pattern Recognition, Institute of Automation, Chinese Academy of Sciences, Beijing 100190, China (e-mail:
[email protected]). H. Yao and N. An are with the Department of Radiology, Chinese PLA General Hospital, Beijing 100853, China (e-mail: hongxiang.yao@ 301hospital.com.cn;
[email protected]). P. Wang, B. Zhou, Z. Zhang, Y. Guo, and X. Zhang are with the Department of Neurology, Institute of Geriatrics and Gerontology, Chinese PLA General Hospital, Beijing 100853, China (e-mail: wpaofeier@ 163.com;
[email protected];
[email protected]; guoyane@ 301hospital.com.cn;
[email protected]). J. Ma is with the School of Biomedical Engineering, Southern Medical University, Guangzhou, Guangdong 510515, China (e-mail:
[email protected]). Y. Liu is with the Brainnetome Center and National Laboratory of Pattern Recognition, Institute of Automation, Chinese Academy of Sciences, Beijing 100190, China (e-mail:
[email protected]). This paper has supplementary downloadable material available at http:// ieeexplore.ieee.org, provided by the author. The material includes the results based on different brain atlas and different test statistic thresholds. Contact
[email protected] for further questions about this work. Color versions of one or more of the figures in this paper are available online at http://ieeexplore.ieee.org. Digital Object Identifier 10.1109/JSTSP.2016.2600298
Index Terms—Alzheimer’s disease, components of interest, mild cognitive impairment, network-based statistic.
I. INTRODUCTION LZHEIMER’S disease (AD), one of the most common neurodegenerative disorders, is associated with typical symptoms, including memory and cognitive decline, executive dysfunction and language deficits [1], [2]. Mild cognitive impairment (MCI) has a high tendency to convert to AD and is considered as a transitional state between healthy aging and dementia [3], [4]. Previous studies have suggested that AD/MCI is a disconnection syndrome [5]–[7], and more large-scale network-based studies have provided direct evidence to support this neurodegeneration hypothesis [8]–[13]. The patterns of whole brain functional connectivity in AD and MCI have been well studied by using magnetoencephalography [14], electroencephalography [15] and functional magnetic resonance imaging (fMRI) [11], [16], [17] techniques (for a review, see [18]). These studies suggest that alterations in widely distributed functional connectivity pairs are prevalent in AD and MCI. The evidence reveals that the default mode network (DMN) was preferentially affected by AD/MCI [8], [9], [13], [19], [20] and causally influences other networks, such as the executive network (CON) and salience network (SAL) [21]–[24]. Additionally, AD patients exhibit a disrupted “topdown” direction of attention processing associated with dorsal attention networks compared with normal controls [13], [25]. Recently, investigators found sensory and motor nervous system dysfunction [26] and abnormality in functional connectivity within sensory-motor networks [27] in AD/MCI patients. Human cognition is supported by parallel, segregated complex systems of different functional brain regions for processing distinct forms of information [28]–[30]. Investigations that exclusively focus on altered pair-wise connectivity might underestimate the dysfunction in AD/MCI brains. Of note, the challenge to such studies is the lack of power due to multiple comparison corrections for large-scale connectivity. The network-based statistic (NBS) is a method that attempts to exploit the clustering structure of connectivity alterations, namely, the connectivities associated with effects of interest form a connected component, i.e., a cluster of connectivities [31]. Hence, the NBS potentially yields greater power to provide the altered clustering network structure in AD/MCI. We hypothesized that the changes in functional connectivity would represent the distribution of decreased network components in AD. We also expected that the altered connectivity
A
1932-4553 © 2016 IEEE. Personal use is permitted, but republication/redistribution requires IEEE permission. See http://www.ieee.org/publications standards/publications/rights/index.html for more information.
ZHAN et al.: NBS SHOW ABERRANT FUNCTIONAL CONNECTIVITY IN ALZHEIMER’S DISEASE
1183
TABLE I DEMOGRAPHIC, CLINICAL AND NEUROPSYCHOLOGICAL DATA IN NORMAL CONTROL (NC), MILD COGNITIVE IMPAIRMENT (MCI) AND ALZHEIMER’S DISEASE (AD) SUBJECTS
Gender (M/F) Age (year) MMSE CDR AVLT-Immediate Recallc AVLT-Delay Recallc ApoE e4 carrier (%)d Head Motion (FD) Head Motion (FD No.)
NC (n = 27)
MCI (n = 27)
AD (n = 35)
p
16/11 69.2 ± 6.5 28.9 ± 1.0 0 5.9 ± 1.1 5.8 ± 2.0 15% 0.25 ± 0.27 17.8 ± 36.1
13/14 73.8 ± 7.8 26.8 ± 1.8 a 0.5 4.6 ± 1.5 3.1 ± 2.0 a 38% 0.16 ± 0.10 6.7 ± 10.9
12/23 72.4 ± 8.5 19.7 ± 4.1 a,b 1.3 ± 0.5 a,b 2.6 ± 1.6 a,b 0.6 ± 1.2 a,b 64% 0.30 ± 0.27 24.7 ± 37.1
0.143 0.090 < 0.001 < 0.001 < 0.001 < 0.001 – 0.07 0.08
Chi-square was used for gender comparisons. One-way ANOVA with Bonferroni post hoc test was used for age and neuropsychological test comparisons. a Significant compared with NC. b Significant compared with MCI. c Three AD subjects refuse to continue this test. d Sixty-six (NC = 20, MCI = 21, AD = 25) of the 89 subjects have ApoE genotype. MMSE, mini-mental state examination; CDR, Clinical Dementia Rating; AVLT, auditory verbal learning test, ApoE, apolipoprotein E. This table has been used to describe the dataset in our previous studies.
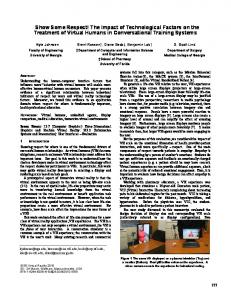
Fig. 1. Schematic of data analysis pipeline. Power’s ROI template was applied to assessing the connectivity matrix on preprocessed rs-fMRI data for each subject. The network-based statistic (NBS) approach was performed to identify abnormal sub-networks between AD and NC. ANOVA was performed on the identified sub-networks between all three groups (NC, MCI and AD). Correlation between connectivity and MMSE were estimated in MCI and AD.
components in AD patients would be decreased in MCI subjects compared with normal cognition (NC). To test these hypotheses, we employed a region of interest (ROI) covering the entire brain to investigate whether altered connectivity components exist in 35 AD patients and 27 age-matched volunteers with NC. First, we investigated network components by dividing each individual’s brain into 264 regions. Second, we identified significant differences in connectivity components based on the NBS method between AD and NC samples. In addition, we included a MCI group to investigate the connectivity strength pattern in the course of AD. Finally, to determine whether the identified altered connectivity components varied with disease progression, Pearson’s correlation analyses were performed between the mean strengths of the identified connectivity components and the clinical variables (Mini-Mental State Examination, MMSE) in MCI and AD patients (Fig. 1). II. MATERIALS AND METHODS A. Subjects Subjects were recruited either as outpatients from the Chinese PLA General Hospital or through a website advertisement. Written informed consent was obtained from all of the participants, and the Medical Ethics Committee of the Chinese PLA General Hospital approved the study. A portion of the subject cohort was used to investigate altered regional homogeneity in AD [32], perceptual and response interference [33], and abnormal amygdala functional connectivity pattern [34] in our previous studies. The same dataset was used in studies on functional connectivity focusing on a specific region of interest, such as thalamic [35] and marginal divisions
[36], aberrant intra- and inter network connectivity patterns in the resting-state [27] and brain morphological characteristics [37] based on structural images. Here, we provide a brief description about data acquisition and preprocessing. All participants met the identical methodological stringency criteria. Specifically, all AD patients met the diagnostic criteria proposed by the National Institute of Neurological and Communicative Disorders and Stroke and the Alzheimer’s Disease and Related Disorders Association criteria for probable AD. The enrolled MCI patients fulfilled the diagnostic criteria described by Petersen and colleagues [4]. The exclusion criteria for participants of present study include the following: (1) other neurological or psychiatric illness, such as Parkinson’s disease, epilepsy, and major depression that can influence the cognitive function; (2) unstable systemic illness or organ failure; (3) metallic foreign bodies in the patients themselves. No subjects were treated with any medication that could have influenced their cognition during the data collection. Each subject was right-handed and underwent a battery of neuropsychological tests, including the MMSE (a 30-point questionnaire that is used to estimate cognitive impairment, screen for dementia and assess dementia progression as well as severity by clinicians), the Auditory Verbal Learning Test (AVLT), the Geriatric Depression Scale, the Clinical Dementia Rating (CDR) and the Activities of Daily Living (ADL) scale. Detailed data descriptions can be found in our previous studies [27], [35]–[37]. The demographic and neuropsychological details for the 89 subjects (27 MCI patients, 35 AD subjects and 27 age- and gendermatched NC subjects) are also provided in Table I, which also can be found in our previous studies. B. Data Acquisition As described in our previous studies, the data were obtained from the 3.0T GE MR system (GE Healthcare, USA) at the Chinese PLA General Hospital, Beijing, China. All subjects
1184
IEEE JOURNAL OF SELECTED TOPICS IN SIGNAL PROCESSING, VOL. 10, NO. 7, OCTOBER 2016
were instructed to keep their eyes closed and relax. Comfortable foam padding was used to minimize head motion, and ear plugs were used to reduce the scanner noise. Resting-state data were acquired using the following protocol: echo planar imaging (EPI) sequence with repetition time = 2000 ms, echo time = 30 ms, flip angle = 90◦ , matrix = 64 × 64, field of view = 220 mm × 220 mm, slice thickness = 3 mm and slice gap = 1 mm. Each volume was composed of 30 axial slices, and each functional run lasted for 6 minutes and 40 seconds. For each subject, a T2-weighted image was collected and evaluated by two senior radiologists to exclude the subjects with white matter alterations or other changes. C. Data Preprocessing The resting-state fMRI data were pre-processed in a standard pipeline using the Brainnetome fMRI Toolkit (www.brainnetome.org) with the following steps: (1) slicetiming; (2) realignment to the first volume for correction for small head motions; (3) spatial normalization to a standard EPI template with re-slicing to 2 mm × 2 mm × 2 mm; (4) regression of nuisance parameters, including linear drift, six motion parameters, and the mean time series of all voxels within the white matter and cerebrospinal fluid; (5) temporal filtering (0.01–0.08 Hz) to reduce higher frequency noise; and (6) spatial smoothing with a 6 mm Gaussian kernel (full width at half maximum). In the present study, we excluded subjects who exceeded 3 mm of absolute rotation or translation compared with the first frame. We also evaluated group differences in head motion among the three groups according to the more sensitive criteria of Power et al. [38]. The results showed that the three groups had no significant differences in mean/maximum head motion, framewise displacement (FD) and number of FDs > 0.5 mm (Table I). D. Estimation of the Whole Brain Functional Connectivity We extracted a regional mean fMRI time series from N = 264 ROIs representing 14 resting-state networks (RSN) [39] that cover the entire brain and have been widely used in previous studies [40], [41]. Consistent with prior studies [27], [42], we estimated the functional connectivity between any pair of regions using a Pearson’s correlation coefficient. To improve the normality of the correlation coefficient, Fisher’s r-to-z transformation was applied to yield Z score matrices.
[31]. (3) All the connected components within the suprathreshold connections and the component size (number of links) were determined, and the significance of each component was derived from the null distribution of the maximal component size yielded by the nonparametric permutation approach (5000 permutations). For each permutation, all subjects were reallocated to NC and AD randomly, and the t-statistic was recalculated. Then, the connected components were identified after the same t-statistic threshold was applied. The component sizes were stored and generated an empirical estimate of the null distribution of component sizes. (4) A corrected p-value for an observed component of size k was estimated by identifying the proportion of the total number of permutations for which the maximal component size was greater than k. A detailed description of these steps can be found in the study of Zalesky and colleagues [31]. The components identified between the NC and AD groups using the NBS were extracted as components of interest (COIs). To assess the relationship between connectivity strength and disease severity, we included the MCI group in the following analysis. For each COI, we calculated the mean Z score by averaging the connection strengths within the COI for each subject. One-way analysis of variance (ANOVA) was performed for a group-wise comparison among NC, MCI and AD subjects after regressing out age and gender effects. The P-values were corrected for the false discovery rate (q = 0.05) and the significant effects assessed with post hoc t tests between each pair of group contrast levels (P < 0.05, FDR corrected). In addition, correlation analyses between the mean Z score and MMSE scores in MCI and AD patients were performed after the removal of age and gender effects. III. RESULTS A. Disconnected Components in AD Patients The NBS identified five disconnected components in the group with AD compared with NC (Fig. 2). The COI 1 (P = 0.006) and COI 3 (P = 0.033) demonstrated that impaired functional connectivity is primarily focused within the DMN, whereas COI 2 (P = 0.011) and COI 5 (P = 0.033) revealed that inter-connectivity between sensorimotor and visual networks was influenced by AD. The identified COI 4 (P = 0.005) revealed that the functional connectivity between dorsal attention and visual networks was also affected in AD patients.
E. Statistical Analysis To identify the group differences in functional connectivity between AD and NC, we used the NBS approach [31]. The main steps are as follows. (1) The Z score was corrected for confounders of age and gender using a linear regression method before the NBS statistical method. (2) The NBS approach was conducted between Z score matrices of AD and NC and a primary t-statistic threshold (t = 4.2, P = 0.0001) was applied to t-statistics of two-sample one-sided independent sample t-tests to identify a set of suprathreshold connections
B. Group Differences in Identified COIs The mean Z scores of the identified COIs revealed group differences among three groups (P < 0.05, FDR corrected) (Fig. 3). Furthermore, the results revealed that the mean Z score gradually decreased with disease severity, i.e., the mean Z score of MCI was lower than that of NC but greater than AD. A post hoc analysis revealed significant effects between each pair of NC, MCI, and AD groups for all COIs except for COI 5 (Fig. 3).
ZHAN et al.: NBS SHOW ABERRANT FUNCTIONAL CONNECTIVITY IN ALZHEIMER’S DISEASE
Fig. 2. Five COIs identified between NC and AD using the NBS approach. Colored nodes indicate different RSNs, and lines represent connections between two nodes. The colored lines indicate that the connected nodes belong to the same RSN, whereas the gray lines indicate that the nodes belong to different RSNs. Abbreviation: COI, component of interest; NBS, network-based statistic; RSN, resting-state network. Brain regions identified between NC and AD using the NBS. Abbreviations: SFG, Super frontal gyrus; PreCG, Precentral gyrus; SFGmed, Super frontal gyrus, medial; MCG, Middle cingulum gyrus; ACG, Anterior cingulum gyrus; MOG, Middle occipital gyrus; MFGorb, Middle frontal gyrus, orbital; ROL, Rolandic opercular; REC, Gyrus rectus; SMA, Supplementary motor area; MTGpole, Middle temporal gyrus, pole; PHG, Parahippocampal gyrus; FG, Fusiform; PoCG, Postcentral gyrus; MTG, Middle temporal gryus; PCUN, Precuneus; SPG, Super parietal gyrus; PoCGL, Posterior cingulum gyrus; CUN, Cuneus; CAL, Calcarine; LING, Lingual gyrus; IOG, Inferior occipital gyrus.
1185
Fig. 4. Scatter plots depicting the relationship between the mean Z scores and the MMSE scores in the AD and MCI patients for COI 1 (r = 0.434, p < 0.001), COI 2 (r = 0.367, p = 0.003), COI 3 (r = 0.524, p < 0.001) and COI 4 (r = 0.390, p = 0.002). MCI patients are indicated by the filled triangles, and the AD patients are represented by circles. Abbreviation: COI, component of interest; MMSE, mini-mental state examination.
TABLE II CORRELATION BETWEEN MEAN Z SCORES OF COIS AND MMSE SCORES AD & MCI
COI 1 COI 2 COI 3 COI 4 COI 5
MCI
AD
R
P
R
P
R
P
0.434 0.367 0.524 0.390 0.034
< 0.001 0.003 < 0.001 0.002 0.794
0.315 0.255 0.346 0.116 −0.13
0.11 0.199 0.077 0.564 0.518
0.211 0.217 0.298 0.332 −0.151
0.224 0.211 0.082 0.051 0.386
Abbreviation: COI, component of interest.
Fig. 3. The differences in the mean Z scores within the five COIs. The bar graph shows that the mean Z scores of the COIs tended to decrease with increasing disease severity. Significant effects were conducted using t-tests between each pair of groups with ∗∗ indicating P < 0.01 and ∗ indicating P < 0.05. Abbreviation: COI, component of interest.
correlation trend with the MMSE score in the MCI (r = 0.346, P = 0.077) and AD (r = 0.298, P = 0.082) groups, respectively (Table II). These results demonstrated that as the MMSE score decreased, the mean Z score in the identified COI decreased.
C. Correlations Between Z Score and MMSE Score Correlations between the mean Z score of the identified COIs and MMSE scores were estimated in MCI, AD and MCI plus AD patients. The mean Z scores of COIs related to DMN (i.e., COI 1 with r = 0.434, P < 0.001 and COI 3 with r = 0.524, P < 0.001) were significantly positively correlated with MMSE scores in patients (Fig. 4, Table II). In AD patients, the mean Z score for COI 4 was correlated with the MMSE score at a statistical level of 0.051 (Table II). Additionally, the mean Z score for COI 2 (r = 0.367, P = 0.003) and COI 4 (r = 0.390, P = 0.002) was positively correlated with MMSE scores in patients (Fig. 4, Table II). The mean Z score of COI 3 exhibited a
IV. DISCUSSION The novel finding of the present study is the identification of the five most severity impaired components in AD under a strictly statistical threshold. Moreover, these components of interest are potential markers for distinguishing patients from normal controls. This profile has enriched our understanding of the dysfunction in AD/MCI. Consistent with previous studies [9], [13], [16], [21], [23], [27], [43], the present study identified that the default mode network, e.g., the medial posterior cingulate cortex, middle temporal gyrus and dorsal medial prefrontal cortex, was one of the
1186
IEEE JOURNAL OF SELECTED TOPICS IN SIGNAL PROCESSING, VOL. 10, NO. 7, OCTOBER 2016
most affected components in the AD (Fig. 2). The default mode network is closely associated with episodic memory processing, visuospatial imagery and self-referential thinking [9], [44], [45]. Moreover, the default mode network plays a pivotal role in receiving and processing information from other brain regions and coordinates brain activity for daily cognition [46]. Amyloid plaques deposition and neurofibrillary tangles are pathological hallmarks of AD, and these features first appeared in the core regions of the default mode network [47]. Hence, this component has been frequently identified as one of the core impaired network in AD and MCI patients [11], [16], [23], [27], [48]– [52], and abnormalities in the default mode network may induce deficits in memory and dysfunction in high-order cognitive functions [16], [50]. As our previous study demonstrated that the impaired functional connectivity within the sensory motor network was identified in MCI and AD subjects [16], [27], [53], the present study also revealed disease severity associated with reduced connectivity between the visual and sensorimotor networks as well as dorsal attention and visual networks. The integration of sensory and motor systems is thought to decline with increasing age. Previous studies have demonstrated that “top-down” attention processing related to the dorsal attention network is impaired by AD and MCI [25], [54]. The dorsal attention network is thought to be involved in goal-driven attention orienting processes [55]. Alterations in functional connectivity associated with DAN may results in difficulties in detecting and focusing on proper objects as well as poor behavioral performance in AD and MCI patients. Traditionally, the dysfunction of the sensory and motor system has not been well studied in AD. Recently, people started to realize that sensory and motor regions are also affected by AD pathology and that the sensorimotor deficits might speed up patient dysfunction as AD progresses [26]. Similar to the suggestions of the experts who attended the exploratory workshop titled “Sensory and Motor Dysfunctions in Aging and AD. (2010)”, the experts in the field cite two possible hypotheses regarding the relationship between sensory/motor system dysfunction and AD. One hypothesis indicates that the AD pathologic process initiated from the sensory or motor system could eventually circulate to other brain regions, especially the entorhinal cortex and hippocampus (the core impaired region in AD). The second hypothesis suggests that the altered sensory or motor output disordered signals in the entorhinal cortex/hippocampus and association cortices contribute to the dysfunction arising from these areas [26]. AD is a heterogeneous disease with numerous different initiation points; impaired functional connectivity within the sensorimotor cortex or between this system and other parts of the nervous system raises the possibility that deficits in specific primary nervous system components may represent early noninvasive biomarkers for AD. Our results demonstrated that AD and MCI patients exhibited significantly reduced functional connectivity (mean Z scores) in identified sub-networks compared with NC. Moreover, enhanced attenuation in the functional connectivity was noted with advanced disease stages. This finding is consistent with the previous studies that revealed that AD/MCI exhibited widespread disturbances in functional connectivity and an
ordered aberration in the course of AD, i.e., connectivity strength in MCI patients is reduced compared with NC but increased compared with AD patients [16], [23]. Notably, the mean functional connectivity of the identified sub-networks was significantly correlated with the MMSE score in the MCI plus AD group. The MMSE provides a brief clinical screening tool that quantitatively assesses the severity of cognitive impairment that is used by clinicians to help diagnose dementia and assess its progression [56]. The correlations between MMSE and the connectivity within each COI indicate a general relationship between abnormal brain function and cognitive impairment in patient groups. Taken together, the deficits in the connectivity within these COIs might serve as potential biomarkers for distinguishing AD/MCI from normal controls. Group level comparisons of functional connectivity may shed light on underlying biological processes or disease mechanisms in AD/MCI. In the present study, statistical inference at the single connection level lacks power given the multiple comparisons. The network-based statistic method provides an excellent solution for correcting multiple comparisons in a whole brain pair of connectivity analysis. However, the main limitation of NBS is that it arbitrarily defines a set of suprathreshold links in the connectivity matrix [31]. Similar to other network-based statistics, the selection of a threshold affects the results. To identify the most affected components in AD, we choose a relative strictly threshold in the present study, which might neglect some pathologically meaningful alterations in AD. We also reanalyzed the abnormal functional connectivity between AD and NC using different test statistic thresholds. Reassuringly, our further additional analysis demonstrated that the impaired patterns of alterations we report are robust to different test statistic thresholds (Fig. S1). Another method that addresses the problem of selecting the initial threshold involves applying the method proposed by Smith and Nichols [57]. Another limitation may be the selection of the atlas. Power’s ROIs were derived from a combination of meta-analyses of fMRI data and a technique of mapping cortical areas using resting-state MRI. This method is reasonably accurate and able to describe whole brain networks to examine functional relationships in the human brain. Additionally, we investigated the abnormal functional connectivity between AD and NC using different full brain parcellation templates, and the results showed that the impaired pattern in AD is robust (Fig. S2). One of the primary goals of the imaging studies was to identify objective and quantitative measures for the early diagnosis of MCI subjects. Based on the five COIs identified between NC and AD using the NBS approach, we have identified 5 features (mean Z scores of COI 1-5, respectively) in each subject. We explored to distinguish the MCI patients from NC and AD patients using the Fisher’s linear discriminate functions with the functional connectivity strengths of the abnormal COIs were selected as features. Leave-one-out cross-validation showed that we could correctly distinguish MCI subjects from the NCs in 68.5% and AD from MCI in 71.0% of the cases (Table S1). The main reason for the relatively reduced correct ratio might be attributed to the large variability of the small sample of the MCI subjects. In the future, a relatively large sample size with longitude MRI and clinical data will help to minimize
ZHAN et al.: NBS SHOW ABERRANT FUNCTIONAL CONNECTIVITY IN ALZHEIMER’S DISEASE
the individual effects on the classification analysis. Further, a combination of structural MRI and diffusion MRI will help identify more features based on brain imaging to assess whether these alterations can serve as imaging markers in the future. V. SUMMARY AND CONCLUSIONS Despite these limitations, the NBS identified a set of core networks involved in disease severity associated with reduced functional connectivity. These networks are consistent with pathological alterations reported in the literature that were identified using a variety of imaging modalities. The significant correlation between the mean strength of the identified components and cognitive ability (MMSE) suggest that these identified components might be potential imaging markers for the diagnosis of AD/MCI. In summary, the present study provides critical insights into the cluster-based connections that are particularly crucial for understanding the neural basis of dysfunction in AD/MCI. REFERENCES [1] R. A. Sperling et al., “Toward defining the preclinical stages of Alzheimer’s disease: Recommendations from the National Institute on Aging-Alzheimer’s Association workgroups on diagnostic guidelines for Alzheimer’s disease,” Alzheimers Dement., vol. 7, no. 3, pp. 280–292, May 2011. [2] C. R. Jack, Jr. et al., “Tracking pathophysiological processes in Alzheimer’s disease: An updated hypothetical model of dynamic biomarkers,” Lancet Neurol., vol. 12, no. 2, pp. 207–216, Feb. 2013. [3] R. C. Petersen, “Clinical practice. Mild cognitive impairment,” New England J. Med., pp. 2227–2234, 2011. [4] R. C. Petersen et al., “Mild cognitive impairment: Clinical characterization and outcome,” Arch. Neurol., vol. 56, no. 3, pp. 303–308, Mar. 1999. [5] X. Delbeuck, M. Van der Linden, and F. Collette, “Alzheimer’s disease as a disconnection syndrome?,” Neuropsychol. Rev., vol. 13, no. 2, pp. 79–92, Jun. 2003. [6] X. Delbeuck, F. Collette, and M. Van der Linden, “Is Alzheimer’s disease a disconnection syndrome? Evidence from a crossmodal audio-visual illusory experiment,” Neuropsychologia, vol. 45, no. 14, pp. 3315–3323, Nov. 2007. [7] R. Bajo et al., “Functional connectivity in mild cognitive impairment during a memory task: Implications for the disconnection hypothesis,” J. Alzheimers Dis., vol. 22, no. 1, pp. 183–193, 2010. [8] R. L. Buckner, J. R. Andrews-Hanna, and D. L. Schacter, “The brain’s default network: Anatomy, function, and relevance to disease,” Ann. N. Y. Acad. Sci., vol. 1124, pp. 1–38, Mar. 2008. [9] M. D. Greicius et al., “Default-mode network activity distinguishes Alzheimer’s disease from healthy aging: Evidence from functional MRI,” Proc. Nat. Acad. Sci. USA, vol. 101, no. 13, pp. 4637–4642, Mar. 2004. [10] F. Bai et al., “Abnormal whole-brain functional connection in amnestic mild cognitive impairment patients,” Behav. Brain Res., vol. 216, no. 2, pp. 666–672, Jan. 2011. [11] K. Wang et al., “Altered functional connectivity in early Alzheimer’s disease: A resting-state fMRI study,” Hum. Brain Mapping, vol. 28, no. 10, pp. 967–978, Oct. 2007. [12] G. Chen et al., “Classification of Alzheimer disease, mild cognitive impairment, and normal cognitive status with large-scale network analysis based on resting-state functional MR imaging,” Radiology, vol. 259, no. 1, pp. 213–221, Apr. 2011. [13] C. Sorg et al., “Selective changes of resting-state networks in individuals at risk for Alzheimer’s disease,” Proc. Nat. Acad. Sci. USA, vol. 104, no. 47, pp. 18760–18765, Nov. 2007. [14] C. J. Stam et al., “Magnetoencephalographic evaluation of resting-state functional connectivity in Alzheimer’s disease,” Neuroimage, vol. 32, no. 3, pp. 1335–1344, Sep. 2006. [15] C. J. Stam et al., “Disturbed fluctuations of resting state EEG synchronization in Alzheimer’s disease,” Clin. Neurophysiol., vol. 116, no. 3, pp. 708–715, Mar. 2005.
1187
[16] Y. Liu et al., “Impaired long distance functional connectivity and weighted network architecture in Alzheimer’s disease,” Cereb Cortex, vol. 24, no. 6, pp. 1422–1435, Jun. 2014. [17] E. J. Sanz-Arigita et al., “Loss of ‘small-world’ networks in Alzheimer’s disease: Graph analysis of FMRI resting-state functional connectivity,” PLoS One, vol. 5, no. 11, 2010, Art. no. e13788. [18] Z. Dai and Y. He, “Disrupted structural and functional brain connectomes in mild cognitive impairment and Alzheimer’s disease,” Neurosci. Bull., vol. 30, no. 2, pp. 217–232, Apr. 2014. [19] R. L. Buckner et al., “Molecular, structural, and functional characterization of Alzheimer’s disease: Evidence for a relationship between default activity, amyloid, and memory,” J. Neurosci., vol. 25, no. 34, pp. 7709– 7717, Aug. 2005. [20] R. L. Buckner et al., “Cortical hubs revealed by intrinsic functional connectivity: Mapping, assessment of stability, and relation to Alzheimer’s disease,” J. Neurosci., vol. 29, no. 6, pp. 1860–1873, Feb. 2009. [21] M. R. Brier, J. B. Thomas, and B. M. Ances, “Network dysfunction in Alzheimer’s disease: Refining the disconnection hypothesis,” Brain Connect., vol. 4, no. 5, pp. 299–311, Jun. 2014. [22] V. Menon, “Large-scale brain networks and psychopathology: A unifying triple network model,” Trends Cogn. Sci., vol. 15, no. 10, pp. 483–506, Oct. 2011. [23] M. R. Brier et al., “Loss of intranetwork and internetwork resting state functional connections with Alzheimer’s disease progression,” J. Neurosci., vol. 32, no. 26, pp. 8890–8899, Jun. 2012. [24] S. R. Jilka et al., “Damage to the salience network and interactions with the default mode network,” J. Neurosci., vol. 34, no. 33, pp. 10798–10807, Aug. 13, 2014. [25] R. Li et al., “Attention-related networks in Alzheimer’s disease: A resting functional MRI study,” Hum. Brain Mapping, vol. 33, no. 5, pp. 1076– 1088, May 2012. [26] M. W. Albers et al., “At the interface of sensory and motor dysfunctions and Alzheimer’s disease,” Alzheimers Dement., vol. 11, no. 1, pp. 70–98, Jan. 2015. [27] P. Wang et al., “Aberrant intra- and inter-network connectivity architectures in Alzheimer’s disease and mild cognitive impairment,” Sci. Rep., vol. 5, 2015, Art. no. 14824. [28] G. Tononi, G. M. Edelman, and O. Sporns, “Complexity and coherency: Integrating information in the brain,” Trends Cogn. Sci., vol. 2, no. 12, pp. 474–484, Dec. 1998. [29] O. Sporns, “The human connectome: A complex network,” Ann N. Y. Acad. Sci., vol. 1224, no. 1, pp. 109–125, Apr. 2011. [30] O. Sporns, Networks of the Brain, Cambridge, MA, USA: MIT Press, 2010. [31] A. Zalesky, A. Fornito, and E. T. Bullmore, “Network-based statistic: Identifying differences in brain networks,” Neuroimage, vol. 53, no. 4, pp. 1197–1207, Dec. 2010. [32] Z. Zhang et al., “Altered spontaneous activity in Alzheimer’s disease and mild cognitive impairment revealed by regional homogeneity,” Neuroimage, vol. 59, no. 2, pp. 1429–1440, Jan. 2012. [33] P. Wang et al., “Perceptual and response interference in Alzheimer’s disease and mild cognitive impairment,” Clin. Neurophysiol., vol. 124, no. 12, pp. 2389–2396, Dec. 2013. [34] H. Yao et al., “Decreased functional connectivity of the amygdala in Alzheimer’s disease revealed by resting-state fMRI,” Eur. J. Radiol., vol. 82, no. 9, pp. 1531–1538, Sep. 2013. [35] B. Zhou et al., “Impaired functional connectivity of the thalamus in Alzheimer’s disease and mild cognitive impairment: A resting-state fMRI study,” Curr. Alzheimer Res., vol. 10, no. 7, pp. 754–766, Sep. 2013. [36] Z. Zhang et al., “Altered functional connectivity of the marginal division in Alzheimer’s disease,” Curr. Alzheimer Res., vol. 11, no. 2, pp. 145–155, Feb. 2014. [37] Y. Guo et al., “Grey-matter volume as a potential feature for the classification of Alzheimer’s disease and mild cognitive impairment: An exploratory study,” Neurosci. Bull., vol. 30, no. 3, pp. 477–489, Jun. 2014. [38] J. D. Power et al., “Spurious but systematic correlations in functional connectivity MRI networks arise from subject motion,” Neuroimage, vol. 59, no. 3, pp. 2142–2154, Feb. 2012. [39] J. D. Power et al., “Functional network organization of the human brain,” Neuron, vol. 72, no. 4, pp. 665–678, Nov. 2011. [40] S. Gu et al., “Emergence of system roles in normative neurodevelopment,” Proc. Nat. Acad. Sci. USA, vol. 112, no. 44, pp. 13681–13686, Nov. 2015. [41] K. Amunts et al., “Interoperable atlases of the human brain,” Neuroimage, vol. 99, pp. 525–532, Oct. 2014.
1188
IEEE JOURNAL OF SELECTED TOPICS IN SIGNAL PROCESSING, VOL. 10, NO. 7, OCTOBER 2016
[42] Y. Liu et al., “Whole brain functional connectivity in the early blind,” Brain, vol. 130, no. Pt 8, pp. 2085–2096, Aug. 2007. [43] L. Wang et al., “Alzheimer disease family history impacts resting state functional connectivity,” Ann. Neurol., vol. 72, no. 4, pp. 571–577, Oct. 2012. [44] M. E. Raichle et al., “A default mode of brain function,” Proc. Nat. Acad. Sci. USA, vol. 98, no. 2, pp. 676–682, Jan. 2001. [45] J. Zhou et al., “Divergent network connectivity changes in behavioural variant frontotemporal dementia and Alzheimer’s disease,” Brain, vol. 133, no. Pt 5, pp. 1352–1367, May 2010. [46] R. Li et al., “Large-scale directional connections among multi restingstate neural networks in human brain: A functional MRI and Bayesian network modeling study,” Neuroimage, vol. 56, no. 3, pp. 1035–1042, Jun. 2011. [47] J. L. Price et al., “The distribution of tangles, plaques and related immunohistochemical markers in healthy aging and Alzheimer’s disease,” Neurobiol. Aging, vol. 12, no. 4, pp. 295–312, Jul./Aug. 1991. [48] B. Dubois et al., “Advancing research diagnostic criteria for Alzheimer’s disease: The IWG-2 criteria,” Lancet Neurol., vol. 13, no. 6, pp. 614–629, Jun. 2014. [49] D. C. Zhu et al., “Alzheimer’s disease and amnestic mild cognitive impairment weaken connections within the default-mode network: A multimodal imaging study,” J. Alzheimers Dis., vol. 34, no. 4, pp. 969–984, 2013. [50] A. M. Ward et al., “Relationships between default-mode network connectivity, medial temporal lobe structure, and age-related memory deficits,” Neurobiol. Aging, vol. 36, no. 1, pp. 265–272, Jan. 2015. [51] J. Wang et al., “Apolipoprotein E epsilon4 modulates functional brain connectome in Alzheimer’s disease,” Hum. Brain Mapping, vol. 36, no. 5, pp. 1828–1846, May 2015. [52] N. Myers et al., “Within-patient correspondence of amyloid-beta and intrinsic network connectivity in Alzheimer’s disease,” Brain, vol. 137, no. 7, pp. 2052–2064, Jul. 2014. [53] Y. Zhan et al., “Longitudinal study of impaired intra- and inter-network brain connectivity in subjects at high risk for Alzheimer’s disease,” J. Alzheimers Dis., vol. 52, no. 3, pp. 913–927, Apr. 2016. [54] Z. Zhang et al., “Functional degeneration in dorsal and ventral attention systems in amnestic mild cognitive impairment and Alzheimer’s disease: An fMRI study,” Neurosci. Lett., vol. 585, pp. 160–165, Jan. 2015. [55] M. D. Fox et al., “Spontaneous neuronal activity distinguishes human dorsal and ventral attention systems,” Proc. Nat. Acad. Sci. USA, vol. 103, no. 26, pp. 10046–10051, Jun. 2006. [56] T. N. Tombaugh and N. J. McIntyre, “The mini-mental state examination: A comprehensive review,” J. Amer. Geriatr. Soc., vol. 40, no. 9, pp. 922– 35, Sep. 1992. [57] S. M. Smith and T. E. Nichols, “Threshold-free cluster enhancement: Addressing problems of smoothing, threshold dependence and localisation in cluster inference,” Neuroimage, vol. 44, no. 1, pp. 83–98, Jan. 2009.
Yafeng Zhan photograph and biography not available at the time of publication.
Hongxiang Yao photograph and biography not available at the time of publication.
Pan Wang photograph and biography not available at the time of publication.
Bo Zhou photograph and biography not available at the time of publication.
Zengqiang Zhang photograph and biography not available at the time of publication.
Yan’e Guo photograph and biography not available at the time of publication.
Ningyu An photograph and biography not available at the time of publication.
Jianhua Ma photograph and biography not available at the time of publication.
Xi Zhang photograph and biography not available at the time of publication. Yong Liu was born in Zaozhuang, ShanDong, China, in 1981. He received the B.S. degree in mathematics from Qufu Normal University in 2002, the M.S. degree from the Department of Mathematics, Beijing University of Technology in 2005, and the Ph.D. degree from the National Laboratory of Pattern Recognition, Institute of Automation, Chinese Academy of Sciences in 2008. From 2008 to 2011, he was an Assistant Professor at the National Laboratory of Pattern Recognition, Institute of Automation, Chinese Academy of Sciences. Since 2011, he has been an Associate Professor at the National Laboratory of Pattern Recognition, Institute of Automation, Chinese Academy of Sciences. He has authored more than 60 articles. His research interests include brain network/connectivity and its applications.