Network Position and Perceptions of Destination Stakeholder Importance Chris Cooper
Noel Scott
Nottingham University Christel DeHaan Tourism and Travel Research Institute Jubilee campus Nottingham NG8 IBB United Kingdom E-mail:
[email protected]
The University of Queensland School of Tourism Ipswich campus 11 Salisbury Road 4305, Ipswich Australia E-mail:
[email protected]
Rodolfo Baggio Bocconi University Master in Economics and Tourism via Sarfatti 25 20136 Milan Italy E-mail:
[email protected]
ABSTRACT This paper examines the organization and governance of the inter-organizational networks of key tourism organizations within the Gold Coast, Australia and how the position of individual stakeholders in a destination network is related to their perceived salience. In this study 22 key organizations identified using a reputation method were interviewed and asked about the skills and power of the 21 other organizations. Based on this data three analyses were conducted. Firstly, an analysis identified the order of the perceived salience of the organizations studied. Secondly, a k-core clustering analysis identified the organizational network as having a core-periphery structure. Thirdly, the network salience of each stakeholders and correlated with their perceived salience resulting in a correlation coefficient of 0.51. Together these analyses indicate that the key stakeholders on the Gold Coast are located in the core of the network and form an elite that is seen as more salient while peripheral stakeholders are seen as less important and suggest that destination management is controlled by a limited number of stakeholders. Key words: Networks, stakeholder, tourism destination, destination management. Chris Cooper is Director of the Christel DeHaan Tourism and Travel Research Institute at the University of Nottingham, UK. He is co-editor of “Current Issues in Tourism” and the author of numerous leading tourism texts, papers and research volumes. He is interested in innovation and knowledge management. Noel Scott is a Senior Research Fellow at The University of Queensland, 4072, Australia and his research interests involve aspects of destination management and marketing. Rodolfo Baggio’s research centers on the use of information and communication technology in tourism, and the analysis of complex networks.
Anatolia, vol. 20, no. 1, pp. 33-45, 2009
INTRODUCTION This paper is part of a stream of research by the authors examining the characteristics of inter-organizational networks of firms linked together to deliver the overall tourism product within a tourism destination. This research is based on a structural view of social interaction highlighting the importance of social organizations, relationships, and interfaces in influencing decisions, beliefs, and behaviour (Scott 2000). Here, structures are seen as recurring patterns of social relationships rather than focusing upon the attributes and actions of single individuals or organizations (Wasserman and Galaskiewicz 1994: 6). The analysis of networks of objects is a study area for researchers from diverse disciplines, including mathematics, physics, biology, the social sciences, policy, economics, and business. This literature provides a rich set of tools and techniques used in network analysis to understand the structural properties of stakeholder networks. In this paper, we examine the organisation and governance of a tourism destination - the Gold Coast, Australia - and seek to characterise the structure of relationships within it (Storper and Harrison 1991). This analysis provides suggestions for improving the effectiveness of inter-organizational collaboration through intervention to improve stakeholder communication, cohesiveness, knowledge management and innovation. A number of models of tourism competitiveness emphasise the importance of destination management (Crouch and Ritchie 1999, Gomezelj and Mihalic 2008) and there is an increasing recognition that the competitive advantage of destinations in the future will be derived less from resources and more from ‘socially constructed and socially regularized innovations to enhance structural competitiveness’ (Connelly 2007:108). In the wider management literature, governance has been linked to the competitive advantage in firms (Makadok 2003) and to the success of tourism destinations (Palmer 2002). Here we consider that the structure of relationships between organizations in a region is an important contributor to the efficiency of communication and decisions made. These networks of relationships provide an important guide ‘into the social relations that characterise the local organisation of tourism’ (Dredge 2006: 579). The structure is critically important given the multi-actor complexity, resource inter-dependencies between the actors and the public-private dimension of tourism destinations, highlighting the importance of a governance perspective (Nordin and Svensson 2005). This particular research examines the structure of the inter-organizational network connecting key tourism organizations in the Gold Coast, Australia, a destination where the contribution of tourism to the local economy is, and is perceived by key stakeholders to be, more that other industry sectors. In structural terms, tourism at the Gold Coast may be considered a cluster that is distinct from other sectors. Social network analysis techniques (Knoke 1993, Scott 2000, Wassermann and Faust 1994) were used to examine the relationship between key stakeholders of the Gold Coast Tourism Bureau, the regional tourism organization (RTO) and in particular to identify their perceived importance. The findings indicate that the stakeholders on the Gold Coast are structured as a core-periphery model and that there is a moderate relationship (r2=0.51) between perceived importance of stakeholders and their position in the network. Thus, this paper provides an example of the application of network analysis to inform tourism theory and practice.
LITERATURE REVIEW The organizational structure of a tourism destination may be considered as a network of interdependent stakeholders. In the management literature, the word stakeholder was first conceptualized as an external party vital for organizational survival (Freeman 1994: 31). From a destination perspective, it is more relevant to consider stakeholders as individuals, groups or organizations with an interest in a particular problem domain (Wood and Gray 1991). In their dealings with each other, stakeholders will apportion different priorities to the opinions and claims of those other stakeholders. Stakeholder salience is defined as ‘the degree to which managers give priority to competing stakeholder claims’ (Mitchell et al. 1997: 584). The importance of stakeholder salience is that the success of a destination manager is determined by the ability to manage the various needs of the stakeholders. Managing stakeholders requires the identification of different levels of salience based on stakeholder interaction. This is because destination managers are limited in their ability to manage stakeholders and therefore they should identify classes of stakeholders vital for the achievement of organizational objectives and then focus management efforts towards them. However, as tourism destinations develop the need for strategic decisions on policy, marketing and product development to maintain competitiveness has increased. As a result, there has been a trend to involve non-state (Bramwell and Rawding 1994) or regional actors (Yuksel et al. 2005) in the process of decision-taking. These changes reflect larger trends in public administration involving integration across sectors and tiers of government and the development of networked policy and organizations. For example in the governance of cities there has been a trend to focus ‘attention on a set of actors that are drawn from but also beyond the formal institutions of government. A key concern is processes of networking and partnership’ (Stoker 2000: 3). The term governance has been used to refer to state and non-state actor policy networks that replace older public governance models based on command and control methods (Rhodes 1997). Governance therefore concerns actors, their roles and relationships (Nordin and Svensson 2007). Nordin and Svensson (2007) found that the most influential and powerful actors in the Swedish ski resort of Åre supported a line of development that the group has agreed upon and that suited their needs and wishes. A focus on governance ‘has been suggested to help in developing our understanding of the dynamics, or lack of dynamics, of a certain destination’ (Nordin and Svensson 2007:54). Rhodes (1997: 15) defines governance as ‘self-organizing, inter-organizational networks characterized by interdependence, resource exchange, rules of the game and significant autonomy from the state’ and here governance is particularly associated with policy networks. This approach is adopted in the examination by Yuksel et al. (2005) of the centralization and decentralization of tourism governance in Turkey. Beritelli, Bieger and Laesser (2007: 96) have a broader view of governance applied to tourist destinations as consisting of ‘setting and developing rules and mechanisms for a policy, as well as business strategies, by involving all the institutions and individuals’. Similarly, governance can be described as the means by which the purpose, direction, policies, actions and behaviours of an organisation are influenced, directed and/or
controlled by its governing body. These tasks cover more than policy and in the context of tourism destinations include operational issues such as marketing. Since governance has ‘the objective of controlling and influencing collaboration outcomes’ (Doz and Hamel 1998: 120) and it is possible that some actors are likely to be more involved than others, leading to a core and a periphery with regard to the governance process (Nordin and Svensson 2007). Further, it may be that networks have different capacities to provide effective governance (Caffyn and Jobbins 2003). This leads to the ‘dark side’ of governance. “Even if the local authority retains a lead role in partnership-based tourism marketing bureaux, they make business interests more influential at the local level. As well as this shift in the representation of local interests, it should also be noted that the private sector representatives on the executive boards of these organizations are usually not elected by the local population as a whole. Consequently, these organizations are less democratic and less accountable to the local electorate. In principle, partnership within tourism marketing bureaux can be taken to mean joint control over the use of resources and shared resourcing (Bramwell and Rawding 1994).
In a study of the development of a tourism website, Bhat (2008: 1137) found that ‘there is a core of a small group of senior people who consult each other’ with the consequent exclusion of others. Thus we may categorize stakeholders as primary or secondary stakeholders in terms of salience or in the context of events as replaceable and irreplaceable (Getz et al. 2007). Primary stakeholders are irreplaceable in the short term. Their exclusion would influence the continuity of an event and, more importantly for this research; the characteristics of their collaboration may affect the outcomes of collaboration among stakeholders. One determinant of salience is stakeholder power, conceptualized here as the degree of influence a stakeholder is able to claim in collaboration (Hall 2007). The source of such influence is derived from the ability of stakeholders to control interdependencies in collaboration between stakeholders (Davenport and Leitch 2005). ‘Whether dealing with the prevention of losses, the pursuit of goals, or selection pressures, one constant in the stakeholder-manager relationship is the attention-getting capacity of the urgent claim’ (Mitchell et al. 1997: 864). Thus this paper examines the overall structure of relationships in the network and also how the position of individual stakeholders in a destination network is related to their perceived importance. METHODOLOGY The tourism region examined in this paper covers the boundaries of the City of the Gold Coast encompassing a coastal strip of land about 40 kilometres long from Surfers Paradise in the north to the New South Wales border as well as a mountainous hinterland. It is an internationally known tourism destination that has substantial highrise accommodation both in hotels and apartments primarily located in the north at Surfers Paradise. A history of the Gold Coast is provided by Russell and Faulkner (1998) and Prideaux (2004). Gold Coast Tourism (formerly the Gold Coast Tourism Bureau) is the official government-recognised regional tourism organization for the Gold Coast region. The
organisation of tourism at the Gold Coast falls within the overall administrative system of tourism in Australia which is built around a core base of industry operators, local government authorities and regional and local tourism organisations. Tourism Queensland (TQ) is the statutory authority responsible for guiding tourism development and marketing at a state level and reports to the State of Queensland’s Department of Tourism. At a regional level in Queensland, Gold Coast Tourism (GCT) and 13 other regional tourism organisations (RTOs) partner with regional stakeholders including industry, local governments and community to manage tourism promotion and marketing initiatives in coordination with Tourism Queensland. The relative size of the 13 RTOs varies significantly with the Gold Coast being the largest in terms of visitor numbers, nights and expenditure. In 2006, the region saw more than 3.5 million domestic overnight visitors spending in excess of 15.2 million nights. In terms of tourism expenditure, the Gold Coast is the third largest region in Australia, with A$2.8 billion (including airfares and long distance transport costs) in expenditure. The GCT is a membership-based, not-for-profit organization established in 1975. Governance of GCT and other RTOs in Queensland is through a Board of Directors which includes representatives of the Gold Coast City Council (GCCC), TQ and elected stakeholders from the membership base. A CEO provides operational control of GCT and funding is obtained from state and local government authorities and from members (with the majority provided by GCCC and TQ and for which in return, these organizations are entitled to nominate a director to the Board). The GCT therefore provides a link between local tourist organisations, operators, government and the community and has responsibilities for both promotion and coordination of the Gold Coast tourism sector. The organizations chosen for this study were identified using a reputation method. Based on initial discussions with staff from TQ and further snowball sampling, 22 key organizations were identified and interviewed. Efforts were made to obtain comments from each of these organizations about each of the other 21 organizations as well as other organizations considered to be important. As a result, during the study several organizations from outside the region were identified and included but not interviewed due to time constraints. While the study may be seen to use small numbers of respondents, these respondents were perceived as the key stakeholders in the region. Each organization was interviewed in person with the interviews taking around one hour. A written questionnaire was used and in particular respondents were asked a series of semi-structured questions concerning the organizations they had relationships with. Four questions were used to identify the salience of tourism operators in this study. Each respondent was asked to list their relationships with other stakeholders in the region in terms of their frequency of contact, importance to tourism in the region, influence and skills. Responses were collected using predetermined code frames where a lower score represented a partial indication to higher salience. The questions used were: 1. How frequently does your organization have contact with [organisation]? 2. How important is [organisation] to your continuing participation in tourism in this region? 3. To what extent do you agree that [organization] has a lot of skills and knowledge to contribute to the development of tourism in this region? 4. To what extent do you agree that [organisation] has the power to influence the direction of tourism in this region? The scores for each of the above four questions were firstly averaged to provide the figures provided in Table 1. The number of respondents who gave an opinion of the
organization varied and this is listed in the final column of Table 1. In order to provide some overall ranking, the average scores on the ‘importance influence and skills’ columns were then added to provide a total average score column (total). These total scores provide an assessment of the relative perceived importance of key stakeholders in the region. Table 1. Frequency of Interaction (Freq), Perceptions of Importance (Imp), Skills and Influence (Inf) Organization Freq Imp Skills Inf Total No Convention and Exhibition Ctr 3.3 1.1 1.2 1.2 3.5 14 Developer 2.8 1.4 1.2 1.6 4.2 5 Casino 3.0 1.5 1.4 1.3 4.3 12 Airport 3.0 1.5 1.5 1.4 4.3 11 Vineyards 3.2 1.7 1.2 1.5 4.4 10 Gold Coast Tourism Bureau 3.4 1.3 1.7 1.5 4.5 21 Major Event 2.2 1.6 1.5 1.5 4.6 8 International Travel Wholesaler 3.6 1.5 1.8 1.5 4.8 8 Tourism Queensland 3.1 1.5 1.6 1.7 4.8 19 Gold Coast City Council 3.3 1.5 2.0 1.4 4.9 19 Hinterland Resort 3.0 2.1 1.3 1.5 4.9 11 Resort 1.9 2.0 1.6 1.4 5.0 7 Theme Park 3.2 2.2 1.5 1.5 5.1 11 International Hotel 1 3.0 1.8 1.7 1.7 5.2 6 International Hotel 2 3.1 2.1 1.5 1.9 5.5 8 Hinterland Wine Organization 3.2 2.0 1.7 1.9 5.6 7 Tour Wholesaler 3.0 2.2 2.0 1.5 5.7 6 International Hotel 3 3.3 2.2 1.7 1.8 5.7 11 Theme Park 3.0 2.4 1.6 1.8 5.8 11 Destination Mgt Organisation 1 2.7 2.3 1.5 2.1 5.9 15 International Hotel 4 2.8 2.4 1.7 2.0 6.1 10 International Hotel 5 2.3 2.5 1.7 2.0 6.2 10 University 2.5 2.0 1.8 2.5 6.3 11 International Hotel 6 2.8 2.5 1.8 2.1 6.4 12 International Hotel 7 2.3 2.8 1.7 2.0 6.4 9 Federal Government Organisation. 2.5 2.4 2.1 2.1 6.6 8 Caravan Park 2.7 3.0 2.0 1.7 6.7 3 Destination Mgt Organisation 2 2.5 2.5 1.6 2.7 6.8 8 Shire Council 3.1 2.1 2.6 2.1 6.8 8 Hinterland Resort 2.8 2.7 1.9 2.3 6.9 12 Chamber of Commerce 2.8 2.1 2.3 2.6 7.0 10 Wildlife Park 2.2 2.3 2.2 2.7 7.2 12 Tour 2.6 2.1 2.6 2.6 7.2 7 Tourism Association 3.6 2.3 2.2 3.0 7.5 6 Local Tourism Organisation 1 2.3 2.5 2.3 2.8 7.7 6 International Resort 2.3 2.6 2.4 2.7 7.7 8 State Government Department 2.3 2.6 2.5 2.8 7.9 8 Local Tourism Organisation 2 3.1 3.3 2.0 3.0 8.3 4 Local Tourism Organisation 3 2.9 3.2 2.7 2.8 8.7 6
The frequency of contact information was used as the basis for a k-core network analysis (Alvarez-Hamelin et al. 2008). A k-core H (a core of order k) is the subset of nodes whose degrees are greater or equal than k and H is the maximum subgraph with
this property. A k-core can be obtained by recursively removing all the vertices of degree less than k, until all vertices in the remaining graph have degree k at least. A kcore is not necessarily a cohesive group. A k-core decomposition identifies progressively internal cores and decomposes the networks layer by layer, revealing the structure of the different k-shells from the outmost one to the most internal one. The k-core decomposition (Seidman 1983) is a procedure that allows identification of kcores and intuitively provides a hierarchy of the vertices based on their shell index that is a combination of local and global properties. The total scores in Table 1 provide one measure of the salience of Gold Coast stakeholders. In this third analysis we have derived a second metric to represent the importance of the position of a node in a network. A correlation analysis has then been performed to determine the correlation between the results of the two methods of measuring salience. There are a number of metrics for measuring the salience of a network node which capture different salience related characteristics and may be generally grouped under the heading of centrality or hierarchical measures. Note that since hierarchical measures are calculated for each level, in the following we use the cumulative values up to level 3 (i.e. sum of the values for first 3 layers). These measures are shown in Table 2. For each node we then defined a feature vector (Fv) that represents all these characteristics: Fv = (D, C, B, Ev, Hd, Hcc, Cv) To evaluate the overall salience of a node we then obtained a harmonic mean of the ranks obtained from each metric. Ranks are used because of the different numeric scales that are obtained when calculating the different metrics. They also better represent the process of assigning importance followed in the survey. People cannot really “measure” importance; they evaluate “importance ratios” instead. The resultant rank was then compared with the rank in salience calculated from the survey results shown in Table 1. A Spearman rank correlation test was performed (Siegel and Castellan 1988) to determine the correlation coefficient. Table 2. Network Analysis Metrics Measure Definition Degree (D) The number of links to immediate neighbours in the network. Closeness (C) The degree an individual is near all other individuals in a network (directly or indirectly). It reflects the ability to communicate with network members. Betweenness (B) The degree an individual lies between other individuals in the network; the extent to which a node is directly connected only to those other nodes that are not directly connected to each other (an intermediary, a bridge). Therefore, it represents the number of elements with which a person is connecting indirectly through their direct links. Eigenvector (Ev) A measure of the importance of a node in a network. It assigns relative scores to all nodes in the network based on the principle that connections to nodes having a high score contribute more to the score of the node in question. Hierarchical Node Degree The number of links between nodes contained in each layer. (Hd) Hierarchical Clustering The clustering coefficient calculated considering nodes belonging to two adjacent Coefficient (Hcc) layers. Hierarchical Convergence
The ratio between the hierarchical node degree of a node at distance d and the
Ratio (Cv)
number of nodes in the ring at next distance level.
Source: Bonacich, 1987; Borgatti and Everett, 2006; da Fontoura Costa and da Rocha, 2006; da Fontoura Costa and Silva, 2006; Scott, 2000; Wasserman and Faust, 1994).
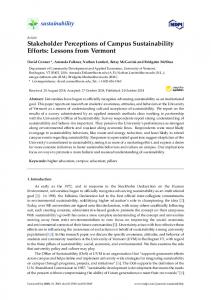
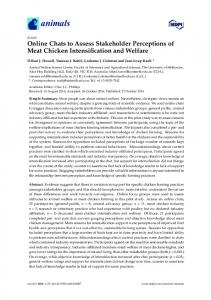
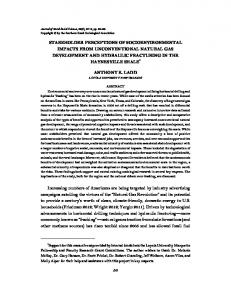
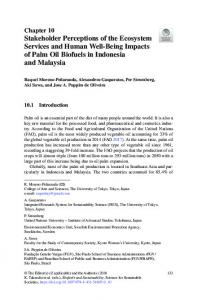
DISCUSSION OF FINDINGS The results of the first analysis examining the perceived importance of the Gold Coast stakeholders, indicates that there is a noticeable variation in scores across the firms interviewed. Thus respondents in a destination can identify those respondents that are more influential, have more skills and knowledge and with whom the respondents work. Interestingly, the firms that are considered to be more salient tend to be larger in size and have larger marketing budgets. While GCT and TQ are in the top ten ranked organizations, the newly established Convention and Exhibition Centre, a major property developer, the casino and airport were all considered as more salient. One exception to this is the high ranking of the vineyard. This is attributed to the personality and extensive contacts of the vineyard owner rather than the nature of that operation. Thus the findings indicate that a destination is not a homogeneous group of firms but is instead heterogeneous in perceived salience. This finding is confirmed by a second analysis of the k-core network structure of the destination with results shown in Figures 1 and 2. These figures both show a group of well-connected tourism organizations surrounded by a shell of less connected operators. Given that the respondents interviewed were selected as those with the highest reputation in the destination, it may be further expected that this core group is also surrounded by a much larger number of peripheral organizations. This indicates that the Gold Coast tourism industry can be considered as having a core-periphery structure (Hjalager 2000). Such a structure has important implications for the diffusion of knowledge, communication and decisionmaking at the destination. It implies that decisions for example will be taken and policy developed based on the interests of those in the core. Such a structure is efficient for decision-making although not necessarily for innovation and introduction of new ideas. However, once adopted, new ideas would be expected to diffuse rapidly to organizations within the destination.
Figure 1. K-core Network Structure of the Respondents
35% 30%
% nodes
25% 20% 15% 10% 5% 0% 1
2
3
4
5
6 7 k-shell
8
9
10
Figure 2. Distribution of Respondents among K-shells
11
A third study examined the correlation between perceived salience of organizations within the destination and their network position based on an average of a number of metrics. The results, shown in Figure 3 indicate a moderate level of correlation between these two measures with a Spearman Correlation coefficient of ρ = 0.51 (p