IEICE TRANS. COMMUN., VOL. E85-B, No. xx JANUARY 20xx
1
LETTER Special Section on Deployment and Operation of New Internet Technology: Challenges and Approaches
Network-Wide Anomaly Detection Based on Routers’ Connecting Relationships* Yingjie Zhou†a), Student Member, and Guangmin Hu†b), Nonmember
SUMMARY Detecting distributed anomalies rapidly and accurately is critical for efficient backbone network management. In this letter, we propose a novel anomaly detection method that uses router connection relationships to detect distributed anomalies in the backbone Internet. The proposed method unveils the underlying relationships among abnormal traffic behavior through closed frequent graph mining, which makes the detection effective and scalable. key words: network-wide anomaly detection, router connection relationships, graph mining
1. Introduction Backbone networks increasingly see distributed anomalous incidents. Some of them arise from network abuse such as DDoS (Distributed Denial of Service), scans and worms, while others are the results of legitimate activities such as transient changes in customer demand and flash crowds. Detecting these anomalies rapidly and accurately is critical for efficient network management. However, these anomalies usually have no easily discernible feature in single link or node, which makes these anomalies difficult to detect in single position and require investigation of the entire network [1]. Network-wide anomaly detection is referred to detecting anomalies by analyzing network traffic features on the whole network. Existing methods use PCA [1] or other techniques [2-5] for network-wide anomaly detection. Although these methods take into consideration the relationships among the traffic feature distribution sequences (e.g., entropy sequences) involved in networkwide anomaly detection, they treat all the relationships between different links equally and fail to distinguish them (e.g., adjacent or nonadjacent). In backbone networks, due to the frequent exchange of data between adjacent routers, the characteristics of abnormal behaviors caused by network distributed anomalous incidents are closely related with routers’ spatial location, their
connection relationships and associated information. This is a significant property for network-wide anomaly detection, which existing methods fail to make full use of. In this letter, we present a novel network-wide anomaly detection method that uses router connection relationships to detect distributed anomalies in the backbone Internet. The proposed method uses a graph to describe the traffic feature distribution sequences and their relationships. Different graphs over time create timeseries graphs. By mining the time-series graphs, distributed anomalies are exposed with the closed frequent graph patterns with respect to typical behavior. We demonstrate the proposed method by using real traffic data collected from an ISP backbone network [6]. The experiment results show that the proposed method is effective and scalable for detecting distributed anomalies in the backbone network. To the best of our knowledge, this is the first work directly related to the use of router connection relationships to detect distributed anomalies in backbone networks. 2. Preliminaries In this letter, we work with netflow traces, which record the IP flows that pass through network equipments. We focus on five traffic features in packet header: packet size (PZ), source IP address (SIP), destination IP address (DIP), source port (SP) and destination port (DP). Entropy measures the uncertainty of random events. We use entropy as a summarization tool because each traffic feature changed over time can be regarded as a sequence of random events. The use of entropy enables highly sensitive detection of a wide range of anomalies [1]. The entropy of traffic feature S is: n
Manuscript received January xx, 20xx. Manuscript revised March xx, 20xx. †The author is with the Department of Communication and Information Engineering, University of Electronic Science and Technology of China, China. *This research is supported by the National Science Foundation (60572092) and the Program for New Century Excellent Talents in University (NCET-07-0148). a) Email:
[email protected] b) Email:
[email protected]
H ( S ) = − ∑ Pi InPi .
(1)
i =1
Where Pi is the attribute’s frequency of a certain n value, n is the total number of instances, and∑i =1 Pi = 1. The entropy can effectively represent the concentration and dispersion situation of corresponding data on the same attribute. The more the data concentrates, the smaller the entropy is, and vice versa.
Copyright © 20XX The Institute of Electronics, Information and Communication Engineers
IEICE TRANS. COMMUN., VOL. E85-B, No. xx JANUARY 20xx
2
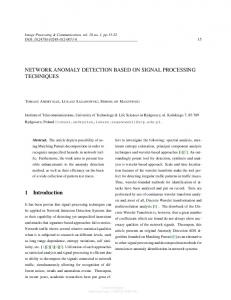
3. The Proposed Method The proposed method addresses the problem of detecting network-wide anomaly in three steps: (1) it designs timeseries graphs to describe the traffic features in different physical topologies of the network; (2) it mines closed frequent graph from the time-series graphs and conducts rules for abnormity determining by selecting emerging patterns; (3) it determines the abnormal time points and the location of anomalies. Figure 1 illustrates the method that takes five entropy sequences as input for networkwide anomaly detection and outputs the abnormal time points and the location of anomalies. five entropy sequences
time-series graph construction
Graph Dataset
closed frequent graph mining
Closed Subgraph
Rules
rules building
emerging patterns based detection
abnormal time points and location of anomalies
Fig.1 Procedure of the proposed method.
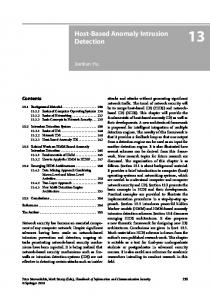
3.1 Time-Series Graph Construction As illustrated in Figure 2, the five components connected to a certain router represent PZ, SIP, DIP, SP and DP during a typical sampling period (which we call a timebin) respectively, and the edges connecting components to routers (dashed line) indicate the subordinate relationships; edges between routers (solid line) denote the connection relationships in logical topology. The graph structure of data organization ensures the correct description of different relationships among the involved traffic feature distribution sequences in different routers. A
represents PZ
D
represents DP
B
represents DIP
E
represents SP
C
represents SIP
R
denotes router
A
E
D
D
C
B
R3
C
D
C
D
R1 E
C
R2 B
E
R4
B E
A
B
A A
Fig.2 Illustration of time-series graphs for network-wide anomaly detection.
Detailed processes are given as follows: 1) Node representation We calculate the changed value sequence from each entropy sequence. K-means clustering method [7] is then used to divide the changed values into four value levels: level 1 is for values which are slightly larger than zero,
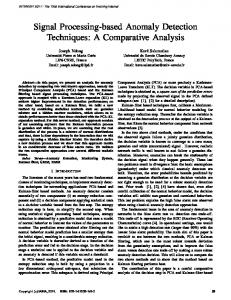
level 2 is for values which are evidently larger zero, level 3 is for values which are slightly less than zero, level 4 is for values which are evidently less than zero. K-means clustering method offers an optimized approach to get symbolic representation for the entropy sequences of traffic features. Let A, B, C, D, E denote the five traffic features, and Aj, Bj, Cj, Dj, Ej (j denotes the value level of the corresponding entropy, j = 1, 2, 3, 4) are the entropies modes of them in the timebin. 2) Edge representation We use the dashed lines to connect all the components to the corresponding routers. The solid lines connect routers according to the logical topology. A graph is then constructed in this way. By using this graph, the relationships among traffic features of different routers are distinguished (adjacent or not). Let pq ( p ∈ router1, q ∈ router2 and p, q=A, B, C , D, E ) represents a 2itemsets graph, and pi q j (i, j=1,2,3,4 and p, q = A, B, C, D, E) denotes a 2-itemsets graph pattern. It is important to notice that the graph patterns which include few routers (e.g., 2-itemsets graph pattern only relates with two routers) are better subgraph patterns, as they occur more frequently in the time-series graphs (the support of them is higher). In this way, we form an undirected graph in each timebin. Different graphs over time create time-series graphs. 3.2 Closed Frequent Graph Pattern Mining and Rules Building Anomalies in network-wide traffic usually have unusual patterns. In this work, the unusual patterns are represented by a series of graph patterns, e.g., a series of frequent graph patterns with respect to typical behavior. Take DDoS for example, it will manipulate a sufficient number of compromised hosts to send numerous useless packets to the defender simultaneously when it attacks, which may cause a sudden increase in the entropy of SIP, a sudden decrease in the entropy of DIP and probably a conspicuous reduction in the entropy of PZ on corresponding routers. Examples of unusual graph patterns which may indicate DDoS is illustrated in Figure 3. However, it is hard to deal with all the frequent graph patterns in the time-series graphs. In particular, for the time-series graphs constructed by the experiment in section 4, the frequent graph patterns are over 40,000,000 with the support threshold of 30%. Obviously, charactering network behavior in this approach is intractable. In order to make the scalability of the method suitable, we introduce closed frequent graph pattern [8], which help us to avoid dealing with the entire data set. A frequent pattern I is closed if there is no proper superpattern of I with the same support in the dataset. The closed frequent graph pattern includes all the useful information of frequent graph pattern, but has much small-
IEICE TRANS. ELECTRON., VOL.XX-X, NO.X XXXX XXXX
3
er scale in pattern number. For the dataset mentioned above, among these 40,000,000 frequent graph patterns, only about 20,000 are closed frequent graph patterns. If the detection is performed on the set of closed frequent graph patterns instead of on the whole set of frequent graph patterns, it will achieve the same accuracy with less redundancy and better efficiency. represents DP
A
represents PZ
D
B
represents DIP
E
represents SP
C
represents SIP
R
denotes router
appear in the timebin. Considering the emerging patterns for the abnormal graph set, the more the emerging patterns in the timebin are, or the greater the emerging ratio of the emerging patterns in the timebin is, the more possibility that network-wide anomaly may appear. The support of an emerging pattern shows the frequency of the pattern that appears in certain graph set. Based on the above ideas, we define the abnormity coefficient Wt to determine whether there are networkwide anomalies in a certain timebin.
A
Wt =
R2 D
D
∑
m =1
( F (t , m, a )sup ( pm , a )emr ( pm , a )) (2)
B
C
R1 D A
R1
arule _ num
R2 B
R3
A A
Fig.3 Illustration of unusual graph patterns that may indicate DDoS
We use some marked data to divide the time-series graphs into two graph sets: abnormal graph set and normal graph set; and mine closed frequent graph patterns in the graph sets respectively. Frequent graph patterns from the abnormal graph set can be regarded as the candidates of rules for abnormality determining. Based on frequent graph patterns mined from both the abnormal graph set and the normal graph set, we can then set up rules (i.e., characteristics of abnormal behavior) for abnormality determination by using emerging patterns [9]. Emerging patterns mining determines the rules by selecting the most meaningful graph patterns from the candidates. It determines anomalies in the graph datasets based on the following theory. Let {Pi}(i = 1,2…m) represents a graph pattern set constructed by closed frequent graph patterns from graph set A. If the conditions that the support of graph pattern Pi in graph set A is α i, the support of the same graph pattern in a different graph set B is β i , and G is a graph that includes {Pi}{i=1,2…m} are satisfied, then the probability that G is in graph set A m is correlated positively with the value 1 − ∏ i =1 ( β i / α i ) . m If the value 1 − ∏ i =1 ( β i / α i ) is close to 1, the graph pattern set {Pi}{i=1,2…m} is called emerging patterns for graph set A, where α i / β i is the emerging ratio for m graph pattern Pi. The greater the value∏ i =1 (α i / β i ) is, the larger the probability that G is in graph set A. The rules that could be used for abnormality determining are built by filtering non-emerging patterns from frequent graph patterns of the abnormal graph set.
In (2), a denotes abnormal graph set, pm denotes a emerging pattern, arule_num denotes the total number of emerging patterns in graph set a, sup(pm, a) denotes the support of emerging pattern pm in graph set a, emr(pm, a) denotes the emerging ratio of emerging pattern pm for graph set a, F(t, m, a) is a two-valued function with value 0 and 1 that denotes the present of emerging pattern pm for graph set a in the timebin t or not respectively. The greater the abnormity coefficient is, the more possibility that network-wide anomalies may appear. In additional, we can infer the location of anomalous event from the graph information of emerging patterns. 4. Experiment Results 4.1 Data Collection We demonstrate our method using real traffic data collected from Abilene [6], the same data sets as in [1]. Abilene contains 9 PoPs (Points of Presence) across the United States mainland. We have collected two weeks’ flow data, which were from Abilene's IP-level sampling flow data (packets sampling 1/100, cycle sampling at intervals of five minutes) for the period January 1, 2008 to January 14, 2008. Every five minutes’ flow statistics constituted the data in a timebin, and a day contained 288 points in time. To obtain a clear understanding of the nature of anomalies detected based on time-series graphs, we manually inspected each of the 4032 time points for discovering the distributed network anomalies. Since the enormous work of manual inspection, we have only identified all the DDoS attacks at present. We marked the data according to the manual inspection introduced in [1]. The data used for training during the period from January 1, 2008 to January 7, 2008 contains 27 DDoS attacks, and the data used for detecting in the next week contains 21 DDoS attacks. Most of the attacks have no easily discernible feature in single link or node.
3.3 Emerging Patterns Based Anomaly Detection
4.2 Emerging Rules Mining
The emerging ratio and quantity of emerging patterns can reflect the possibility that network-wide anomaly may
Based on the data collected during the period from January 1, 2008 to January 7, 2008, we compute five entropy sequences, which are corresponding to five traffic fea-
1 − (β / α )m
IEICE TRANS. COMMUN., VOL. E85-B, No. xx JANUARY 20xx
4
tures: PZ, SIP, DIP, SP and DP. We use these entropy sequences to calculate the changed value sequences. The time-series graphs are then constructed from the changed value sequences. Using the marked data, the time-series graphs were divided into abnormal graph set and normal graph set. Through closed frequent graph patterns mining in the abnormal graph sets, we get 1051 candidates of rules with the support threshold of 40%. Based on the theory described in Section 3.2, we mine the emerging rules by selecting the emerging patterns from the candidates. The threshold of emerging ratio for valuable rules is specified as 1.0 in our experiment. Figure 4 shows the emerging ratio distributions. As mentioned before, the greater the emerging ratio of emerging patterns is, the more possibility that distributed anomalous event may appear. The results verify the effectiveness of the rules for distributed anomaly detection. 30
Number of Emerging Rules
25
20
15
10
5
0 0
5
10
15
20
25
Emerging Ratio
Fig. 4 The emerging ratio distributions
4.3 Abnormality Detection As mentioned in Section 4.1, the data used for anomaly detection in this letter contains 21 DDoS attacks. We use this dataset to examine the performance of our method proposed. We focus on three factors: the detection rate (DR), the false positive rate (FPR) and the false negative rate (FNR), to examine the efficiency of the emerging rules to detect distributed anomalous events. Using the proposed method, we detected 20 DDoS attacks and 19 of them are true DDoS attacks. This result shows our method has a detection rate of 95%. The false positive rate is 5%, and the false negative rate is 9.5%. In additional, we inferred the location of anomalies from the graph information of emerging patterns. The results show that all the inferred locations are correct in our experiment when the detected attacks are not false positive. TABLE 1 Detection Results Compared with PCA Based Method Proposed Method Detection
PCA Based Method 20
Detection
24
DDoS
19
DDoS
19
DR
90.5%
DR
90.5%
FPR
5%
FPR
20.8%
FNR
9.5%
FNR
9.5%
To evaluate the performance of the proposed method with respect to some well-known methods, we compare our detecting results with the results of a PCAbased detection method [1], which is known to be effective in network-wide anomaly detection. The comparison results illustrated in Table 1 show that our method is superior to the conventional detection method with regard to the false positive rate, while the detection rates and false negative rates of both methods are comparable. Although we conducted experiments using off-line traces, the proposed method can process these traces fast enough to allow an on-line operation. For instance, the traces, which are used in our experiment for a week long, are fully processed in the proposed method in less than three hours using normal PCs. 5. Conclusion In this letter, we present a novel network-wide anomaly detection method that uses router connection relationships to detect distributed anomalies in the backbone Internet. The proposed method creates time-series graphs to describe the traffic feature distribution sequences and their relationships. By mining the time-series graphs, distributed anomalies are exposed with the closed frequent graph patterns with respect to typical behavior. Experiment results using real traffic data show that the method proposed in this letter is superior to the conventional detection method with regard to the false positive rate, while the detection rates and false negative rates of both methods are comparable. References [1] A. Lakhina, M. Crovella, and C. Diot, "Mining anomalies using traffic feature distributions," In Proceedings of ACM SIGCOMM, Philadelphia, Pennsylvania, USA, pp. 217-228, Aug. 2005. [2] Y. Zhang, Z. Ge, A. Greenberg, and M. Roughan, "Network anomography, " In Internet Measurement Conference, New York, NY, USA, pp. 1-14, Oct. 2005. [3] T. Ahmed, M. Coates, and A. Lakhina, "Multivariate online anomaly detection using kernel recursive least squares," In Proc. IEEE INFOCOM, Anchorage, AK, USA, pp. 625-633, May 2007. [4] P. Chhabra, C. Scott, E. Kolaczyk, and M. Crovella, "Distributed spatial anomaly detection," In Proc. IEEE INFOCOM, Phoenix, AZ, USA, pp. 1705-1713, April 2008. [5] J. Kline, S. Nam, P. Barford, D. Plonka, and A. Ron, "Traffic anomaly detection at fine time scales with bayes nets," In Proceedings of IEEE ICIMP, Bucharest, Romania, pp. 37-46, June/July 2008. [6] [EB/OL], http://www.internet2.edu/network/ [7] S. Selim, and M. Ismail, "K-Means-Type Algorithms: A Generalized Convergence Theorem and Characterization of Local Optimality," IEEE Transactions on Pattern Analysis and Machine Intelligence, vol. 6, no. 1, pp. 81-87, Jan. 1984. [8] X. Yan, and J. Han, "CloseGraph: Mining Closed Frequent Graph Patterns," In Proceedings of ACM SIGKDD, Washington, DC, USA, pp. 286-295, Aug. 2003. [9] G. Dong, and J. Li, "Efficient mining of emerging patterns: Discovering trends and differences," In Proceedings of ACM SIGKDD, San Diego, California, USA, pp. 43-52, Aug. 1999.