Cognitive, Affective, & Behavioral Neuroscience 2009, 9 (3), 270-285 doi:10.3758/CABN.9.3.270
Neural correlates of arithmetic calculation strategies Miriam Rosenberg-Lee
Stanford University, Palo Alto, California and
Marsha C. Lovett and John R. Anderson
Carnegie Mellon University, Pittsburgh, Pennsylvania Recent research into math cognition has identified areas of the brain that are involved in number processing (Dehaene, Piazza, Pinel, & Cohen, 2003) and complex problem solving (Anderson, 2007). Much of this research assumes that participants use a single strategy; yet, behavioral research finds that people use a variety of strategies (LeFevre et al., 1996; Siegler, 1987; Siegler & Lemaire, 1997). In the present study, we examined cortical activation as a function of two different calculation strategies for mentally solving multidigit multiplication problems. The school strategy, equivalent to long multiplication, involves working from right to left. The expert strategy, used by “lightning” mental calculators (Staszewski, 1988), proceeds from left to right. The two strategies require essentially the same calculations, but have different working memory demands (the school strategy incurs greater demands). The school strategy produced significantly greater early activity in areas involved in attentional aspects of number processing (posterior superior parietal lobule, PSPL) and mental representation (posterior parietal cortex, PPC), but not in a numerical magnitude area (horizontal intraparietal sulcus, HIPS) or a semantic memory retrieval area (lateral inferior prefrontal cortex, LIPFC). An ACT–R model of the task successfully predicted BOLD responses in PPC and LIPFC, as well as in PSPL and HIPS.
A central feature of human cognition is the ability to perform complex tasks that go beyond direct stimulus– response mappings. However, the cognitive capacities that enable this competency—selective attention, maintenance and transformation of internal representation, top-down sequencing—also result in the potential for more than one legitimate route to the response. People navigate with reference to landmarks or in absolute space; reading involves direct semantic retrieval, but can also use orthographic information; quantities can be computed exactly or estimated roughly. Such strategic variation has implications for understanding the neural underpinnings of behavior, in terms of locus, level, and duration of activity. Strategic variation, both within and between participants, has been documented behaviorally in numerous domains (Kwong & Varnhagen, 2005; LeFevre et al., 1996; Rogers, Hertzog, & Fisk, 2000). For methodological reasons, early functional imaging research focused predominantly on simple short tasks in which the assumption of monolithic processing pathways may be justified. However, as researchers image increasingly complex tasks, the need to consider the effects of strategy grows. The investigation of strategies using imaging has the potential to enrich our understanding of neural functioning, but there are challenges that are both practical (accurately assessing
strategy use) and theoretical (parceling out the effects of strategy-specific activity). Our approach in addressing these challenges was threefold: (1) to investigate a domain in which much is already known about the neural substrates, (2) to use a task in which the strategies can be disambiguated behaviorally, and (3) to employ computational modeling in order to make specific predictions about the contributions of the strategies. In the following sections, we will expand on each aspect of our approach. Briefly, building on research into the neural underpinnings of numerical and arithmetic processing, we investigated two strategies for solving multidigit multiplication problems. The strategies could be distinguished by the timing of participants’ keypresses, enabling us to confidently assess strategy use. Finally, using the ACT–R cognitive architecture (Anderson, 2007; Anderson, Qin, Sohn, & Stenger, 2003) with task analyses of the strategies, we modeled participants’ behavior and generated predictions of the BOLD response in regions of interest (ROIs). Cortical Areas Involved in Arithmetic Processing Lesion and functional imaging studies have consistently (although not exclusively) identified the parietal lobe in arithmetic processing (Cipolotti, Warrington, &
M. Rosenberg-Lee,
[email protected]
© 2009 The Psychonomic Society, Inc.
270 270
Neural Correlates of Strategies 271 Butterworth, 1995; Dehaene, Spelke, Pinel, Stanescu, & Tsivkin, 1999; Jackson & Warrington, 1986; Kahn & Whitaker, 1991; Menon, Rivera, White, Glover, & Reiss, 2000; Warrington, 1982; Whalen, McCloskey, Lesser, & Gordon, 1997). The triple-code theory (Dehaene, Piazza, Pinel, & Cohen, 2003), summarizing imaging and neuro psychological research into arithmetic and number processing, proposes that numbers are not represented in a single unified manner. Instead, representations are distributed over several different areas that each code for a different aspect of numbers: The horizontal intraparietal sulcus (HIPS) codes for numerical quantity or magnitude, the posterior superior parietal lobule (PSPL) corresponds to the spatial and attentional aspects of number processing, and the angular gyrus is involved in the verbal processing of numbers. Under this proposal, only the HIPS is a uniquely numerical area; the PSPL is part of general attention system, and the angular gyrus is part of a leftlateralized perisylvian language network. These functional divisions suggest that the arithmetic operations may rely on different areas of the cortical number processing network. For example, multiplication is learned by rote memorization of the “times table” and hence should involve verbal processing, which is supported by the angular gyrus. Conversely, subtraction is purported to be accomplished through reference to an internal number line that is traversed in reaching an answer. Thus, an area such as the horizontal intraparietal sulcus, which is involved in magnitude computation, should play a greater role in subtraction. Consistent with this interpretation, in single-digit tasks, the HIPS is more active during subtraction than during multiplication, whereas the opposite pattern holds in the angular gyrus (Chochon, Cohen, van de Moortele, & Dehaene, 1999; Lee, 2000). The PSPL has been shown to be more active in subtraction over multiplication (Lee, 2000), but has also been implicated in nonmathematical spatial attention tasks (Corbetta, Kincade, Ollinger, McAvoy, & Shulman, 2000; Culham & Kanwisher, 2001; Wojciulik & Kanwisher, 1999). Lesion studies support this distinction between verbal and quantitative aspects of arithmetic processing, finding a dissociation between subtraction and multiplication deficits (Dehaene & Cohen, 1997; Dehaene et al., 2003). Moreover, patients with multiplication impairments also tend to have aphasia, which is consistent with a verbal representation of multiplication facts (but see van Harskamp, Rudge, & Cipolotti, 2002, for contradictory neuropsychological evidence). Imaging research examining arithmetic strategies has contrasted strategies that would be expected to have different neural substrates. For example, in a multidigit multiplication task, well-practiced problems solved by direct retrieval showed less prefrontal and parietal activity and more angular gyrus activity than did novel problems solved by calculation (Delazer et al., 2003). Similarly, a novel arithmetic operator that was learned by rote memorization produced greater angular gyrus activity than did a novel operator that was trained to be solved algorithmically, which in turn produced greater
intraparietal sulcus activity (Delazer et al., 2005). Although not an arithmetic task, algebra problems solved with a verbal strategy had strong prefrontal activity but little parietal activity, whereas the same problems that were solved using an equation-based strategy showed the opposite pattern (Sohn et al., 2004). In these cases, qualitatively different strategies resulted in different loci of cortical activity. Behaviorally Distinct Strategies in Mental Multidigit Multiplication Multidigit arithmetic involves more than repeated single-d igit operations; instead, complex algorithms must be executed that interleave the basic operation with carries or borrows and, in the case of long multiplication and division, addition and subtraction steps, respectively. Moreover, the properties of arithmetic (e.g., commutivity, distributivity) afford some flexibility in the order of processing. This reordering produces distinct strategies (where a strategy is a goal-directed procedure [Siegler & Alibali, 2005] under the deliberate control of the participant [Naus & Ornstein, 1983]). For example, the counton strategy, used by children to solve simple addition problems, involves retrieving the number of fingers of the first addend and then counting up to the second addend to arrive at the final result. A subtle improvement on this strategy, known as the min strategy, is to always begin with the larger addend first, regardless of the order of presentation (Siegler & Shrager, 1984). Compare solving 2 1 21 with the count-on strategy versus with the min strategy: Both strategies involve retrieving and counting, but the counting is much reduced in the latter case. Strategies that are distinguishable by the order in which elements are processed have not been investigated using neuroimaging. The primary purpose of the present study was to establish that such reordered strategies involve the same neural substrates, but that they can be distinguished by their profiles of cortical activity within those substrates. The domain chosen to investigate these questions was mental multidigit multiplication (i.e., multiplying a large multiplicand by a multiplier, without external aids). Of the various methods of solving multidigit multiplication problems, we selected two strategies that differ in the order of the individual single-digit multiplications. The first strategy involves working from right to left, multiplying the multiplier by successive digits in the multiplicand to build up the correct answer. We label this the school strategy, because it is the mental equivalent of the method of long multiplication taught in North American elementary schools. The second strategy involves working from left to right through the multiplicand, and we label it the expert strategy, because it is a method used by some expert, or “lightning,” mental calculators (Pesenti, 2005; Staszewski, 1988). Participants in the present study had to type out their responses as if they were entering them into a calculator or speaking the numbers—that is, putting the largest digit first. A consequence of this constraint is that in the school
272 Rosenberg-Lee, Lovett, and Anderson strategy, participants must calculate the entire product before they can begin to output their response. Conversely, in the expert strategy, participants calculate the largest digits of the product first and so can output their response as they go along. These two strategies have different characteristic patterns of keypresses: School strategy has rapid keypresses at the end of the trial, whereas the expert strategy has intermittent keypresses throughout the trial. Thus, each strategy has a “behavioral signature” that we can use to deduce which strategy participants are using. The two strategies involve performing equivalent cognitive processes (retrieving multiplication facts, transforming internal representations, outputting responses), thus engaging the same brain areas. However, another important consequence of the “largest digit first” output constraint is that the working memory demands differ between the strategies. In the expert strategy, participants output their responses as they go, reducing the amount of information they have to keep in mind; in the school strategy, they must retain all the calculated digits until the end of the trial, increasing the working memory demand. Thus, the two strategies should differentially engage brain areas that are sensitive to working memory load, consistent with our primary goal of establishing that reordered strategies can be differentiated by the profiles of activity within the same brain areas. Moreover, we can investigate the effects of working memory demands on brain areas involved in mental arithmetic. Specifically, the second goal of the present research was to assess the differential responses to the strategies in two sets of brain areas: three areas identified by the triple-code theory (Dehaene et al., 2003) and two areas identified by the ACT–R cognitive architecture (Anderson, 2007). Modeling Reordered Calculation Strategies in a Cognitive Architecture The ACT–R cognitive architecture proposes that cognition is accomplished by the activity of independent modules that are coordinated by a production system. Modules represent various perceptual and motor modalities, such as vision and finger manipulation, and aspects of central cognition, such as retrieving memories, cognitive control, and the maintenance of internal representations. Recent refinements of the theory involve linking the modules to specific cortical regions (Anderson, 2007; Anderson et al., 2003; Qin et al., 2004; Qin et al., 2003). Two modules were of particular interest in the present study: the retrieval module, which is identified with the lateral inferior prefrontal cortex (LIPFC), and the imaginal module, which is identified with the posterior parietal cortex (PPC). Extensive research implicates the LIPFC with semantic memory retrieval (Buckner, Kelley, & Petersen, 1999; Cabeza, Dolcos, Graham, & Nyberg, 2002; Dobbins & Wagner, 2005), whereas the PPC has been implicated in the maintenance and transformation of internal representations, across modalities (Alivisatos & Petrides, 1997; Carpenter, Just, Keller, Eddy, & Thulborn, 1999; Clark & Wagner, 2003; Davachi, Maril, & Wagner, 2001; Reichle, Carpenter, & Just, 2000). For the task in the pres
ent study, the retrieval demands were equivalent between the strategies; thus, we predicted that the LIPFC should not reflect differences between the strategies. Conversely, although the transformations were also equivalent, the maintenance demands were very different between the strategies; thus, we expected the PPC to have a greater response to the school strategy. We used an ACT–R model to quantify these predictions. The purported functions of the triple-code areas suggest predictions for the response of these areas to the strategies. In the PSPL, which has been implicated in internal attention and representation, we expected sensitivity to the strategy manipulation because of the added maintenance demands of the school strategy. The role of the HIPS in numerical processing suggested that it should be activated in mental multiplication; however, the exact form of this processing was unclear. If this area is sensitive only to the magnitude of externally presented numbers, which are equivalent between the strategies, it should not display any strategy effects. However, if it is sensitive to the magnitude of internally represented numbers, it should have greater activity for the school strategy, in which larger numbers are stored. Finally, activity in the angular gyrus was difficult to predict; it is specifically implicated in multiplication, particularly when problems are solved by direct retrieval (Dehaene et al., 2003; Delazer et al., 2003). However, previous research by our group, using algebra, found deactivation in this area (Danker & Anderson, 2007; Sohn et al., 2005). These verbal specifications of proposed functions of cortical areas lead to fairly broad predictions. For example, we would not be surprised to find some strategy differences in the ACT–R PPC area, the PSPL, and the HIPS, even though these areas are supposed to be responding to and accomplishing very different aspects of the task. To make our predictions more precise (in terms of the timing and level of activity), we built a computational model of the task using the ACT–R cognitive architecture. This model automatically generates predictions for activity in the ACT–R modules, which we could then compare with activity in the brain areas of interest (including the triplecode areas, extending the purview of the ACT–R theory). The ACT–R PPC area is situated roughly in the middle of the triple-code areas, so a third goal of the present research was to investigate the relationship between these areas and the ACT–R PPC, using computational modeling. In summary, the present study had three interconnected goals. The first was to demonstrate that strategies that differ in the order of their steps can be distinguished neurally by differential engagement of the same brain areas. For the task in the present study, the differential engagement was mainly due to the differences in maintenance demands between the strategies. The second goal was to examine specific brain areas that are involved in problem solving and numerical processing to assess their sensitivity to this specific working memory difference between the strategies. The final goal was to investigate the patterns of activity in four proximal parietal regions with distinct proposed functions.
Neural Correlates of Strategies 273 Method
Table 1 Example Problem Solved by the Expert and School Strategies
Participants Twenty out of 41 participants who were trained in the present task were selected to participate in the fMRI scanning session. Participants were eligible to be scanned only if they met certain behavioral criteria—that is, if they completed the training procedure in the allotted 2 h (10 participants excluded), obtained accuracy greater than 75% (4 participants excluded), and complied with strategy instructions (assessed by the pattern of keypresses; 7 participants excluded). Of the eligible participants, 2 were not scanned because of claustrophobia, and 3 chose not to participate in the scanning session. The remaining 15 participants had a mean age of 20.80 years (SD 5 2.513), and 12 were male. Strategies Table 1 compares the solution to a 5-digit 3 1-digit problem that was solved via the two mental multiplication strategies used in this experiment. The key difference between the strategies is the direction in which problems are solved. The multiplication algorithm taught in schools, sometimes called “long multiplication,” involves working through the multiplicand from right to left. In the task instructions, this strategy was called the “←” method, but it will be referred to here as the “school” strategy. An alternative method of solving multiplication problems that is used by some expert mental calculators (Staszewski, 1988) is to work through the multiplicand from left to right. In the present experiment, this strategy was called the “” method, but will be referred to here as the “expert” strategy. Although the strategies differ in the direction in which problems are solved, there are many similarities in their execution. In both strategies, the same individual single-digit multiplication facts are computed, and the same number of multiplications by multiples of 10 and the same number of additions are performed (see Table 1). In the experimental setup, participants had to enter their responses manually in the order of largest to smallest digit (i.e., most to least significant), the same order as for using a calculator or speaking digits in English. The result of this constraint is that when using the school strategy, participants must complete all calculations and determine the entire answer before they can output their response. Conversely, because computing goes from left to right in the expert strategy, the largest values are computed first and can thus be output before calculating the entire answer—a feature highlighted to participants. Table 1 also indicates when the numbers can be output for the two strategies.1
School 7 3 6 5 42 7 3 2 5 14 14 3 10 5 140 140 1 42 5 182 7 3 8 5 56 56 3 100 5 5,600 5,600 1 182 5 5,782 7 3 4 5 28 28 3 1,000 5 28,000 28,000 1 5,782 5 33,782 7 3 3 5 21 21 3 10,000 5 210,000 210,000 1 33,782 5 243,782 Press 2 Press 4 Press 3 Press 7 Press 8 Press 2 Press enter
Note—Keypresses indicated in boldface.
in the responses were excluded, because the “0” key was designated as the enter key (see Figure 1). Procedure Input method. In the behavioral sessions, participants entered their responses with a qwerty keyboard and used the finger-digit mapping shown in Figure 1, so that each finger corresponded a single digit, with the right pinkie finger typing the enter key. In the scanning sessions, participants used two data gloves with the same finger-to-number mappings. Behavioral training session. A 2-h behavioral session was used to train the participants on the strategies and to determine who would continue to the scanning session. The training began with a working memory task involving orally repeating visually displayed letters and digits while remembering the digits (Lovett, Daily, & Reder, 2001). The next section was a single-digit multiplication task (digits
1 2 3 4
7 8 9 0 Enter
5 6
2 1
3
7
4 5
8
6
Figure 1. Finger-to-key mapping.
9
Enter
Stimuli The problem space was restricted to 3-, 4-, and 5-digit multiplicands that were multiplied by 1-digit multipliers. The stimuli were further constrained on several dimensions: the individual digits, the distribution of those digits over the multiplicands and multipliers, and the features of the products that resulted. The stimuli were randomly selected from the set of all stimuli meeting these criteria. Digits. All of the digits forming the multiplication problems in this task were restricted to the digits 2–9. Both 1 and 0 were excluded, since single-digit multiplication problems involving these digits tend to be solved not by retrieval, but by reference to rules— for example, zero times anything is zero (LeFevre et al., 1996). Excluding 1 and 0 ensured that for each single-digit multiplication, the participant would have to retrieve a math fact. Distribution. The digits in the multiplicands were constrained to numbers without repeated digits, since repeated retrievals tend to be faster (Anderson, Fincham, & Douglass, 1997). Randomizing the trial order and excluding multiplicands with repeated digits ensured that, on average, no retrieval within a problem would be easier than another. Product. Only stimuli whose product was one more digit than the multiplicand were included, ensuring that the length of the product was constant for each problem type (e.g., 329 3 3 5 987 would not be included, but 329 3 8 5 2,632 would). All products that had a 0
34,826 3 7 Expert 7 3 3 5 21 7 3 4 5 28 21 3 10 5 210 210 1 28 5 238 Press 2 7 3 8 5 56 38 3 10 5 380 380 1 56 5 436 Press 4 7 3 2 5 14 36 3 10 5 360 360 1 14 5 374 Press 3 7 3 6 5 42 74 3 10 5 740 740 1 42 5 782 Press 7 Press 8 Press 2 Press enter
274 Rosenberg-Lee, Lovett, and Anderson 70 Expert-3 Expert-5 School-3 School-5
60
Frequency
50 40 30 20 10 0 0
4
8
12
16
20
24
>25
2-Sec Latency Bins Figure 2. Distributions of latencies in the four conditions of the experiment.
2–9, thus 64 trials) to refresh the multiplication facts used in the experiment. Participants then read through instructions on the school strategy and did three practice problems using it. Next, they read through instructions on the expert strategy and did three practice problems using it. The main training consisted of four alternating blocks of the two strategies. Each block had 24 trials, 8 trials for each of the three problem lengths. The order of the strategies was counterbalanced between participants. These blocks were fairly long for participants, so in addition to breaks between blocks, there was a break after the first 12 trials in each block. Trials were presented on a white background with black lettering. A single trial began with either the “” or “←” at the center of the screen for 2,000 msec, which indicated to participants which strategy to use. Participants had unlimited time to enter their responses, which appeared on-screen as they typed. Once the participant pushed the enter key, indicating that they had completed their responses, a feedback screen (“Correct” in blue lettering or “Incorrect” in red lettering) was displayed for 1,000 msec. In the final block, which was used to determine whether participants would continue to the scanning session, the two strategies were intermixed. Participants did not have a break within the block, nor did they receive feedback on their performance. Instead of feedback, a fixation cross was displayed for 2,000 msec. Participants who were eligible to continue after the training session participated in a 30-min refresher session 1 day before the scanning session. The refresher session consisted of two blocks with the same timing and features as those in the final block of the training session. Thus, the behavioral training involved a total of 168 problems, with 84 solved by each strategy. Scanning session. During the scanning session, participants used two data gloves to enter their responses, employing the same finger-to-number mapping that they had learned in the behavioral session. However, in the scanner, participants were not able to see their hands. In order to further train them on this mapping during the structural scanning, they practiced entering 4-, 5-, and 6-digit numbers that were presented on-screen, while using the data gloves. To engage them in the task, participants were instructed to enter numbers as fast as possible until they were able to type 10 out of 12 numbers correctly, in the allotted time. In practice, a time limit of 7,500 msec on each trial ensured that participants were unable to meet this criterion, and the task was terminated by the experimenter at the end of the structural scanning.
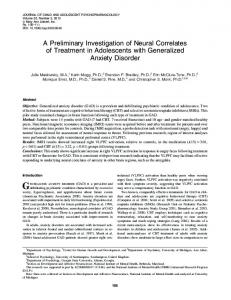
The functional scanning consisted of six blocks of intermixed strategies within a block. To ensure an adequate number of replications of each problem type and to reduce the length of the blocks, we used only 3- and 5-digit problems, resulting in 16 trials in a block, with no break. In total, participants solved 48 problems using each of the strategies. After the 2,000-msec strategy instruction (“” or “←”), participants had 58,000 msec to enter their responses. As in the final block of training, there was no feedback. After each trial, a fixation cross appeared for a minimum of 16,000 msec. This rest period was extended up to 2,000 msec more to synchronize the trial structure with the scan length of 2,000 msec. MRI Acquisition and Preprocessing Event-related f MRI data were collected using a gradient echoplanar-image acquisition on a Siemens 3T Allegra Scanner. The imaging parameters were TR 5 2,000 msec, TE 5 30 msec, flip angle 5 79º, FOV 5 200 mm, matrix size 5 64 3 64, slice thickness 5 3.2 mm, slice gap 5 0 mm, and 34 axial slices/scan with AC–PC on the 11th slice from the bottom. Anatomical scans were acquired by using a standard T2-weighted pulse sequence, with 34 slices and the AC–PC on the 11th slice from the bottom. Preprocessing of the functional imaging data included six-parameter rigid-body motion correction using AIR (Woods, Cherry, & Mazziotta, 1992). Images were coregistered to a common reference anatomical MRI scan by means of the 12-parameter AIR algorithm (Woods, Grafton, Holmes, Cherry, & Mazziotta, 1998) and were smoothed with a 6-mm full-width half-maximum three-dimensional Gaussian filter. fMRI Analyses—Onset Locking and Event Locking Figure 2 shows the distributions of times to solve problems in 2-sec bins that correspond to a length of a scan. For instance, in the 5-digit conditions, over 10% of the observations were completed in fewer than 10 scans (20 sec), and over 10% of the observations involved more than 20 scans (40 sec). We developed a method to address the analysis of imaging data from trials in which 25% of the observations differed in duration by a factor of more than 2. A standard approach would be to align the scans to the onset and to discard any scans past the interval of interest—that is, the onsetlocked approach. However, we wanted a way of aggregating the data so that specific scans would come from averaging the same events across all trials. To achieve this goal, we developed a method for
Neural Correlates of Strategies 275
Onset to 1st click Next to 2nd click Next to 3rd click Next to 4th click Next to last 3 clicks Next to end of rest Total
School-3 6 1
Expert-3 4 3
1 8
School-5 12 1 1 1 1 8
1 8
Expert-5 4 3 3 2 1 8
16
24
16
21
aligning the data from individual trials to a common template for each condition, which we termed event-locked (Anderson et al., 2008).2 Broadly, this method breaks up each trial into a number of intervals that are determined by stimulus and response events, and then aligns each scan from each trial interval to the mean length of the interval for all trials of that condition. (See the Appendix for details of this procedure for aligning the data.) The stimulus events were the onsets of the problem and the rest period, and the response events were the various keypresses (Table 1). Anderson et al. (2008) suggested that event-locked averaging is a more veridical representation of the data and provides a more stringent test of model predictions than do onset-locked averages. Table 2 lists the behavioral events for each condition and gives the mean number of scans associated with each interval. The last three keypresses occurred so rapidly that they were all compressed into a single scan. In addition to the scans given in Table 2, there was the scan during which the strategy instruction was given that defines the baseline for that condition. Thus, there were 17 scans in total for school-3 and expert-3; there were 22 scans for expert-5, and 25 scans for school-5. Identification of confirmatory ROIs. ROI analyses focused on five predefined regions in the left hemisphere for which we had predictions. There were two regions that had been identified by previous studies by our group (Anderson et al., 2003; Anderson, Qin, Stenger, & Carter, 2004; Qin et al., 2004), and three parietal regions that had been identified in the triple-code theory of numerical processing by Dehaene and colleagues (see Dehaene et al., 2003, for a review). Consistent with our previous research, we generated 5 3 5 3 4 voxel regions for the ACT–R ROIs (see, e.g., Qin et al., 2004). Using the coordinates from a meta-analysis by Dehaene et al. (2003, left hemisphere only), we generated 4 3 4 3 4 voxel ROIs for HIPS, PSPL, and angular gyrus. The ACT–R parietal area sits somewhat between the three triple-code areas and does not overlap them (see Figure 4, on p. 276 for the exact locations of these ROIs). Table 3 lists these areas along with their corresponding anatomical structures and Brodmann areas, their size, and the Talairach–Tournoux coordinates of their centroids. Identification of exploratory ROIs. We identified exploratory ROIs by examining the first nine scans of the correct trials (i.e., onset locked) for each strategy, pooled over the two problem lengths. Exploratory statistical maps were assessed for clusterwise significance, using a cluster-defining threshold of p , .01 either for a main effect of strategy or for areas displaying a strategy 3 scan interaction. Clusterwise familywise error was controlled at the p , .01 level, using a critical cluster size of 40 voxels (Cox & Hyde, 1997). All p values were lower bound corrected for violations of sphericity. Table 4 lists these areas, along with their corresponding anatomical structures and Brodmann areas, their size, and the Talairach– Tournoux coordinates of their centroids.
Results Behavioral Participants were fairly accurate on the 3-digit problems (87.8% and 84.1% for the school and expert conditions,
respectively). In contrast, within the 5-digit problems, participants performed well on the expert trials (80.3%), but they performed substantially worse on the school trials (65.6%). A repeated measures ANOVA revealed a main effect of problem length [F(1,14) 5 29.180, p , .001], a main effect of strategy [F(1,14) 5 12.623, p , .005], and an interaction between strategy and length [F(1,14) 5 6.656, p , .05]. Paired t tests revealed that the strategy effect was marginal for the 3-digit problems [t(14) 5 1.884, p , .10], but that it was significant for the 5-digit problems [t(14) 5 3.397, p , .01]. The mean reaction times (RTs) for correct trials in the four conditions are displayed in Figure 3. A strategy 3 problem length repeated measures ANOVA on mean RTs revealed that 5-digit problems took longer than did 3-digit problems [F(1,14) 5 407.073, MSe 5 7.122, p , .001], as did problems solved by the school strategy as compared with the expert strategy [F(1,14) 5 9.129, MSe 5 9.985, p , .01]. There was also a strong strategy 3 length interaction [F(1,14) 5 68.386, MSe 5 1.646, p , .001]. Paired t tests confirmed that the interaction resulted from a large strategy effect on 5-digit problems [t(14) 5 24.996, p , .001], but that there was no difference between the strategies for the 3-digit problems [t(14) 5 0.402, p . .10]. According to the description in Table 1, participants should display a rapid sequence of keypresses at the end of the trial for the school conditions, but intermittent, early keypresses followed by three rapid keypresses at the end of the trial for the expert conditions. This appears to be the pattern displayed in Figure 3. In order to quantify this keypress pattern and confirm that the participants were complying with the strategy instructions, we examined the RTs for the first, second, and last keypresses. The time to the first keypress should have been the shortest for the two expert conditions, and progressively longer for the school-3 and school-5 conditions. Combining the expert conditions, a one-way repeated measures ANOVA revealed that the expert, school-3, and school-5 first keypresses were significantly different from each other [F(2,28) 5 35 30 25
Time (sec)
Table 2 Number of Scans in Each Keypress Interval for Each Condition, Used in Onset-Locked Alignment
20
7th press 6th press 5th press 4th press 3rd press 2nd press 1st press
15 10 5 0 Expert-3
School-3
Expert-5
School-5
Figure 3. Correct trial reaction times with individual keypresses and overall latencies by problem type.
276 Rosenberg-Lee, Lovett, and Anderson
Figure 4. Location of the five confirmatory regions of interest (ROIs) and five exploratory ROIs. PSPL, posterior superior parietal lobule; HIPS, horizontal intraparietal sulcus; PPC, posterior parietal cortex; LIPFC, lateral inferior prefrontal cortex; AG, angular gyrus. Numerals refer to ROIs in Table 4.
279.471, MSe 5 4.614, p , .001]. Paired t tests confirmed that the first keypress for school-3 took longer than that for the expert conditions [t(14) 5 10.557, p , .001], and that the first keypress for the school-5 took longer than that for the school-3 [t(14) 5 15.480, p , .001]. For the second keypress, the school conditions involved continuing to type the response, whereas in the expert conditions, calculation steps preceded the keypress. Collapsing over length for both strategies, a paired t test confirmed that the second keypress for expert conditions took longer than did that for the school conditions [t(14) 5 16.030, p , .001]. For the final keypress (i.e., pushing the enter key), all conditions should have a short latency; consistently, there was no difference between RTs for the school and expert conditions [t(14) 5 20.804, p . .10].
Imaging In the following sections, we present confirmatory results for the five ROIs involved in mathematical cognition (Dehaene et al., 2003) and complex problem solving (Anderson, 2007), and for exploratory ROIs. Confirmatory and exploratory results involved analyses in which the data were aligned to the stimulus onset (onset locked). In the confirmatory section, we also present results in which the data were aligned to all stimulus and response events (event locked). In all cases, the BOLD response for each scan was computed as the percent change from the first scan of the trial. In the event-locked analyses, the data were linearly detrended so that the last scan in each condition returned to baseline. Trials in which a scan exceeded 5% change from baseline were excluded, as were incorrect trials.
16.24* 5.90 42.79* 3.86 8.09 0.80 1.56 0.60 43.09* 5.97 0.12 0.05 66.19* 4.57 0.01 0.16 1.07 5.26 59.33* 2.81 0.07 0.01 1.93 4.63 244, 248, 47 241, 266, 36 64 64
1.18
20.65* 20.12* 40.47* 2.89 27.05* 2.46 24.63* 35.19* 0.01 25.35* 18.25* 0.46 222, 268, 56 64
Triple Code Posterior superior parietal lobule (BA 7) Horizontal intra parietal sulcus (BA 40) Angular gyrus (BA 39) *p , .01.
14.46* 2.43 0.43 9.99* 0.21 14.59* 1.50 1.29 14.66* 0.10 242, 23, 24 100
1.61
23.19* 48.05* 26.17* 0.95 46.35* 0.01 83.52* 3.97 2.56 63.99* 0.06 4.86 224, 263, 40 100
ACT–R Posterior parietal lobule, precuneus (BA 7/39) Lateral inferior prefrontal (BA 9/46)
Event Locked (22 Scans) (5-Digit Problems) Strategy Scan Strategy 3 Scan Event Locked (17 Scans) (3-Digit Problems) Strategy Scan Strategy 3 Scan Event Locked (9 Scans) Length Strategy Scan Onset Locked (9 Scans) Length Strategy Scan Talairach– Tournoux Coordinates Voxel Count Gray Matter (Brodmann Area)
Table 3 Summary of Confirmatory Results: Voxel Count, Talairach Coordinates, and F Statistics for the Five Confirmatory Regions of Interest
Neural Correlates of Strategies 277 Confirmatory analysis. In the following section, we present four analyses: (1) We present data from the first nine scans of the trial using onset locking (i.e., aligning the data only at the stimulus onset). Nine scans represent the average number of scans in the 3-digit problems before the cool-down period. In this analysis, data from all trials can be considered, because every trial contains at least nine scans, and 3- and 5-digit problems are comparable up to this point. (2) We also present event-locking analysis for the first nine scans. To preview, there are no differences in the results produced by the two alignment methods. Event aligning enables us to consider the entire time course of trials of varying length. Thus, we present event-locked analysis (3) for 17 scans from the 3-digit problems and (4) for 22 scans from the 5-digit problems. We performed repeated measures length 3 strategy 3 scan ANOVAs for the five ROIs. Table 3 also lists the F values for the main effects of this analysis (there were no significant two- or three-way interactions at the p , .01 level, lower bound corrected). In the onset-locked, nine-scan analysis, every area except the angular gyrus showed a significant effect of scan, confirming that these areas were activated by the task. There were no significant effects of problem length, which is consistent with the fact that during the initial portion of the trial, there were no differences in the demands between the problem lengths: The steps involved in solving the first three digits of a 5-digit problem were the same as those in a 3-digit problem. Of most interest were areas showing greater activity for problems solved by the school strategy than by the expert strategy. Only the PSPL showed a significant effect of strategy. The F values from the repeated measures length 3 strategy 3 scan ANOVA on the first nine event-locked scans are also shown in Table 3. The results parallel the onset-locked data: There are strong effects for scan for all the ROIs except the angular gyrus, no significant effects for length, and, again, the PSPL shows a strong strategy effect. Aligning the data to the stimulus and response events enabled a comparison of the strategies over the entire trial time course. Figure 5 presents these time courses for the five ROIs. We performed a strategy 3 scan repeated measures ANOVA on the 3-digit problems for the full 17 scans of the aligned data (Table 3 lists the F values for this analysis). For the 3-digit problems, there were no significant effects of strategy at the p , .01 level, although there was a trend toward greater activity in the school strategy for the PSPL. For the 5-digit problems, we performed a strategy 3 scan ANOVA, this time on the 22 scans common to the two strategies (see Table 3). The ACT–R PPC area and the PSPL both showed significantly greater activity for the school strategy than for the expert strategy. The ACT–R PPC, the PSPL, and the HIPS also had a significant scan 3 strategy interaction (lower bound corrected), which was likely driven by the longer sustained activity for the school strategy than for the expert strategy. In contrast, the LIPFC did not differentiate between the strategies, with the two strategies falling back to baseline at the same point even though the school strategy lasted 5 sec longer. A goal of the present article was to investigate the relationship between the ACT–R PPC area and the areas
278 Rosenberg-Lee, Lovett, and Anderson Table 4 Summary of Confirmatory Results: Voxel Count, Talairach Coordinates, and F Statistics for the Five Exploratory Regions of Interest Gray Matter ROI (Brodmann Area) 1 Right pre- and postcentral gyrus (BA 40) 2 Right superior parietal lobule, precuneus (BA 7) 3 Left inferior postcentral gyrus (BA 40) 4 Left lingual gyrus (BA 17/18) 5 Right lingual gyrus (BA 17/18) *p , .01.
Voxel Count 539
Talairach– Tournoux Coordinates 40, 228, 56
Strategy 7.05
Scan 8.99
Strategy 3 Scan 13.53*
192
12, 274, 50
19.14*
19.15*
8.57
41
245, 230, 44
10.15*
25.68*
6.89
89
213, 289, 1
0.63
6.30
10.55*
73
13, 287, 0
5.25
20.75*
12.05*
identified by the triple-code theory. Clearly the angular gyrus (see Figure 5E), which deactivates below baseline, is distinct from the other three areas, all of which have positive activity. To test the similarity in activation patterns among the PSPL, HIPS, and PPC, we created a sequence of 73 nonzero scans (concatenating the four conditions) for each area. A repeated measures ANOVA of area 3 scan revealed no significant differences between the areas [F(1,14) 5 1.248, MSe , .001, p . .10], but a marginally significant area 3 scan interaction [F(1,14) 5 4.978, MSe 5 .001, p , .10], as well as the expected main effect of scan [F(1,14) 5 39.950, MSe 5 .001, p , .001]. One striking difference between the areas is a peak of activity after the last keypress in the HIPS and PSPL, but not in the ACT–R PPC (see Figure 5). To quantify this observation, we averaged the activity for the three scans before and after the final keypress, across conditions. A repeated measures ANOVA of area 3 before/after final keypress revealed no main effect of area [F(1,14) 5 2.326, MSe 5 .00004, p . .10], a main effect of before/after keypress [F(1,14) 5 4.741, MSe 5 .000002, p , .05], and an interaction [F(1,14) 5 13.483, MSe 5 .000001, p , .005]. Paired t tests showed that the HIPS [t(14) 5 1.929, p , .10] and the PSPL [t(14) 5 4.821, p , .005] increased from before to after the final keypress, but that the PPC decreased [t(14) 5 22.073, p , .10]. Exploratory analysis. This section reports the results of an exploratory analysis aimed at identifying brain areas with differential BOLD responses to the two strategies. Five ROIs matching our criteria are shown in Figure 4. Displayed in Table 4 are the coordinates of the areas and the relevant F statistics. These five regions can be grouped on the basis of their activation profiles. Two areas (ROIs 1 and 3) reflected the motor demands of the task—early activity in the expert strategy and larger late activity in the school strategy. ROI 1 is a very large right-hemisphere area (539 voxels), spanning the central sulcus. In contrast, ROI 3 is a smaller (41 voxels) area on the left inferior postcentral
gyrus. The extensive right lateralization of motor activity results from an imbalance in the stimuli set. Over 90% of the problems meeting our selection criteria require the left hand to make the first keypress (i.e., the product begins with a digit less than 6),3 producing greater early activity in the right motor cortex. Two bilateral occipital areas (ROIs 4 and 5) had opposite patterns of activity: Both areas responded to the task, but the right hemisphere area (ROI 5) had greater activity for the school strategy, whereas the left area (ROI 4) had greater activity for the expert strategy. Although participants fixated centrally between trials, there were no instructions regarding gaze during the trial. In the school strategy, participants worked from right to left, meaning that initially the problem was largely in the left visual field, driving activity in the right hemisphere, whereas the reverse pattern holds for the expert strategy. The right superior parietal area (ROI 2) showed stronger responses for the school strategy than for the expert strategy. This region is quite large and extends from the PSPL to the precuneus. The upper extent of the area partially overlaps with the right-mirrored confirmatory PSPL ROI and is coincident with the right-hemisphere area identified by triple-code theory (Dehaene et al., 2003). The lower extent of ROI 3 is close to the right homologue of the ACT–R PPC area, being somewhat more medial and posterior. Although the threshold of 40 contiguous significant voxels did not find a corresponding left parietal region, we did find a region with 13 contiguous significant voxels. It was almost entirely contained within the confirmatory PSPL area and demonstrates the same pattern of greater activity for the school strategy. The Model The ACT–R proposes that cognition results from the independent activity of distinct modules coordinated by a production system. We constructed a model of the task that primarily depends on four modules: visual, imaginal,
Neural Correlates of Strategies 279
A
B
PPC
0.6 0.4 0.2 0.0 3-Digit
5-Digit
% Change in BOLD Response
% Change in BOLD Response
0.8
–0.2
0.3 0.2 0.1 0.0 –0.1
3-Digit
5-Digit
–0.2
C
D
HIPS
PSPL
1.4
1.0 0.8 0.6 0.4 0.2 0.0 3-Digit
5-Digit
% Change in BOLD Response
1.2
% Change in BOLD Response
LIPFC
0.4
1.0
1.2 1.0 0.8 0.6 0.4 0.2 0.0 –0.2
–0.2
E
3-Digit
5-Digit
AG
% Change in BOLD Response
0.2 0.1 School-data
0.0
Expert-data
–0.1 –0.2
School-model
–0.3 Expert-model
–0.4 –0.5
3-Digit
5-Digit
Figure 5. BOLD response and model fit in (A) the posterior parietal cortex (PPC), (B) the lateral inferior prefrontal cortex (LIPFC), (C) the horizontal intraparietal sulcus (HIPS), (D) the posterior superior parietal lobule (PSPSL), and (E) the angular gyrus (AG). Each marker represents a 2-sec TR. The vertical line represents the first scan of the sequence.
retrieval, and manual. The visual module encodes information from the screen, such as the multiplier, and sends it to the imaginal module. The imaginal module requests math facts from the retrieval module. The retrieval module sends multiplication and addition results back to the imaginal module, which updates its stored representation. The manual module produces keypresses, when appropriate, to the strategies. Finally, as digits appear on the
screen, the visual module encodes them. Figure 6 presents the sequences of activity in these modules, for a 3-digit problem solved by each of the strategies. The same steps are involved in both strategies, just reordered, resulting in a process that takes about the same amount of time for both strategies. ACT–R has no a priori limits akin to working memory capacity. Thus, without further refinements, the model
280 Rosenberg-Lee, Lovett, and Anderson would predict that there would be no difference in RT between the strategies, at any problem length. This prediction clearly contradicts the behavioral data in which there was approximately a 5-sec difference between school-5 and expert-5 problems. To account for this difference, we made two additions to the processing steps in the school-5 condition. First, we included a rehearsal step: After computing four digits of the solution, the model transfers three digits from the imaginal module to long memory. When the model is typing the answer, these digits are retrieved from memory and put back into the imaginal module. These steps have the effect of stretching out the RT in the school-5 condition. Second, we also included a step after the model encodes both a school instruction and a 5-digit multiplicand, which sets up the later rehearsal. One parameter was estimated to fit the behavioral data: a factor that scaled the time to retrieve a declarative memory fact (for arithmetic facts: 1.8 sec) and the time to modify the contents of the imaginal module (set to half of the retrieval time—i.e., 0.9 sec). This value produced a reasonable fit to the individual keypress data [r(4) 5 .98, RMSE 5 1.21 sec]. As is noted in the behavioral results, there was extensive variability in solution times. In order to capture this aspect of the data, for each run of the model, the scale factor for the retrieval and imaginal modules were independently and randomly selected from a uniform distribution with the above mean values, ranging from 0 to twice the mean value. In order to generate BOLD predictions, we convolved the module activity with a gamma function. As is typical (see, e.g., Glover, 1999), we represent the BOLD response to a demand that occurred t seconds ago by a gamma function: H (t ) = m(t / s )a e − ( t /s ). The parameter m is the magnitude parameter and determines the height of the function; the parameter s is the scale parameter and determines the time scale, and the parameter a is the shape parameter and determines the narrowness of the function. We fixed a to be 3 and s to be 1.5 sec, and estimated the magnitude parameter from the response in each brain region. The cumulative BOLD response in a particular module is the sum of the individual BOLD responses driven by a module’s activities. This can be modeled by convolving the hemodynamic response, H(t), with a demand function, D(t), that is 1 whenever the module is active, and 0 otherwise:
t
B(t ) = ∫ D( x ) H (t − x )dx. 0
The model was run 100 times, and the resulting data were event locked following the alignment scheme used on the confirmatory results (see the Appendix) and linearly detrended. Table 5 lists the correlations between activity in the five confirmatory ROIs and the four modules. Consistent with the proposal for the functions of the ACT–R regions, the retrieval module best correlated with the LIPFC [r(73) 5 .939], and the imaginal module best correlated with the
Figure 6. A schematic representation of the ACT–R model’s solution to the problem 427 3 7, solved by the two strategies.
Neural Correlates of Strategies 281 Table 5 Correlations Between Activity in the Five Confirmatory Regions of Interest (ROIs) and the Predicted Activity of Four Modules of the Model ROI Visual Retrieval Imaginal Manual AG 2.368 2.686 2.684 2.277 LIPFC .430 .939 .841 2.160 PPC .771 .930 .974 .272 HIPS .853 .803 .947 .550 PSPL .834 .800 .944 .482 Note—AG, angular gyrus; LIPFC, lateral inferior prefrontal cortex; PPC, posterior parietal cortex; HIPS, horizontal intraparietal sulcus; PSPL, posterior superior parietal lobule.
PPC [r(73) 5 .974]. (Figure 5 displays the predicted and actual BOLD responses in these areas.) The model explains two qualitative differences between these areas: (1) In all conditions, the LIPFC returned to baseline earlier than the PPC, and (2) on 5-digit problems, the PPC had greater and prolonged activity for the school strategy, whereas the LIPFC did not differentiate between the strategies. These differences resulted in the model from different periods of activity by the modules. As can be seen in Figure 6, the retrieval module is not involved during the final response phase, after the last math fact is retrieved (except for quick number retrievals), whereas the imaginal module updates the stored representation after the final keypress, prolonging its activity. On school-5 problems, the rehearsal steps produce addition retrieval and imaginal activity, further extending the predicted BOLD response in the imaginal module. However, because the school-5 condition has a 4-scan final response phase, as compared with a 1-scan final response phase in the expert-5 condition, retrieval activity ends much earlier (relative to the last keypress) in the school-5 condition. For the retrieval module, this earlier termination balances the extended activity of rehearsal, producing no net differences between the strategies. Although the strongest correlation to the imaginal module was found in the ACT–R PPC area [r(73) 5 .974], this module was also highly correlated with HIPS [r(73) 5 .947] and PSPL [r(73) 5 .944]. In order to further assess the fits between these areas and the model, we calculated a deviation statistic for each area to the prediction from the imaginal module: 73
( X i − Xˆ i )
i =1
s X2
∑
i
2
.
The numerator calculates the square of the difference between the model predictions and the data, and the denominator calculates the squared standard error in the measurement of each scan over the 15 participants. These values are summed over the 73 nonzero data points. Table 6 lists the value of this statistic for the comparison between the imaginal module’s BOLD prediction and BOLD activity in the PPC, PSPL, and HIPS. Previously, when assessing the fit between data and model, we have assumed this deviation statistic to be distributed as a χ2 (Danker & Anderson, 2007; Sohn et al., 2005). However, because successive scans are not independent observations—producing autocorrelations in the deviations from the mean between scans—the assumptions of the χ2 distribution do not hold. A more correct approach is to assume a gamma distribution, which approximates the sum of autocorrelated χ2s (Anderson et al., 2008). At the p 5 .01 level, this produces a critical value of 154; statistics greater than this value represent significant deviations between predictions and data. As can be seen in Table 6, only the PPC does not exceed this value, further supporting the correspondence between the PPC and the imaginal module. The confirmatory results suggested that HIPS and PSPL had peaks of activity after the last keypress that were not found in the PPC. The imaginal prediction similarly does not display these peaks, contributing to the poorer fit with the HIPS and PSPL. However, both the visual and manual modules show peaks after the final keypress and are more highly correlated with the PSPL and HIPS than is the PPC. To determine whether activity in these areas reflected processing of other information streams, we calculated the best fit between a combination of two ACT–R modules and the data. For the PSPL and the HIPS, the best combination was the imaginal and manual modules, whereas for the PPC, it was the retrieval and the visual modules. The correlation and deviation statistics for these more complex models are also listed in Table 6. In order to assess whether two-parameter models represented substantial improvements in fit, we applied the Bayesian information criterion (BIC) for statistical inference (Raftery, 1995; Wagenmakers, 2007), which balances reductions in deviations with a penalty for increasing the number parameters (i.e., lower values represent better models). For the HIPS, the BIC of this two-parameter model (listed in Table 6) is clearly better than the one-parameter model; for the PSPL, the models are essentially equal; and for the PPC, the more complex model actually produces a higher BIC.
Table 6 Summary of Model Fits: Correlation, Deviation, and Bayesian Information Criterion (BIC) of One- and Two-Parameter Models for Three Regions of Interest (ROIs)—PPC, HIPS, and PSPL One-Parameter Model Two-Parameter Model ROI Correlation Deviation BIC Correlation Deviation BIC PPC .974 141.03 17.81 .980 119.74 20.06 HIPS .947 218.32 27.17 .983 121.01 20.17 PSPL .944 226.39 28.07 .964 206.03 29.70 Note—PPC, posterior parietal cortex; HIPS, horizontal intraparietal sulcus; PSPL, posterior superior parietal lobule.
282 Rosenberg-Lee, Lovett, and Anderson Why might the HIPS and the PSPL have responded to the manual demands of the present task? Functional imaging work suggests that representations of the hands and grasping are proximal to numerical areas of the intraparietal sulcus and the superior parietal lobule (Simon, Mangin, Cohen, Le Bihan, & Dehaene, 2002), producing the constellation of deficits found in Gerstmann’s syndrome (Dehaene et al., 2003). However, manual events in the present task were confounded with digits appearing on the screen (every keypress except the last produced a number on the screen). Unfortunately, our present design could not distinguish whether this extra activity represented manual or visual activity (numerical or otherwise), but it did suggest that the PSPL and the HIPS are functionally distinct from the PPC. Discussion The primary purpose of the present study was to establish that reordered arithmetic strategies activate the same neural substrates, but that they nevertheless can be distinguished by their profiles of cortical activity within those substrates. Neither confirmatory nor exploratory analyses identified any brain areas that were active for one strategy but not for the other, supporting the contention that these strategies involve the same neural substrates. Instead, the same set of brain areas were differentially activated by the two strategies, both in sensory and motor cortex and in higher cognitive areas. Not surprisingly, activity in the motor cortex reflected the behavioral signatures of the strategies, early activity for the expert strategy, and late stronger activity in the school strategy. Interestingly, an unintended behavioral difference between the strategies— looking to the right in the school strategy and to the left in the expert strategy—was also reflected in the neural signal. Activity in the right lingual gyrus was greater for the school strategy than for the expert strategy, and the opposite pattern was found in the left lingual gyrus, reflecting the fact that looking to the right puts the problem in the left visual field, which is processed in the right hemisphere, and vice versa. These results suggest that some aspects of the behavioral signatures of strategies may be recovered from imaging data, even if appropriate additional behavioral measures, such as eyetracking, are not used. Our second focus was on the effects of working memory on brain areas involved in numerical cognition and complex problem solving. A strength of our method is that both the presence and absence of differences between the strategies informed our understanding of the function of these brain areas. Among the triple-code theory areas (Dehaene et al., 2003), the PSPL was the only brain area that consistently demonstrated differential activity between the strategies. The PSPL showed greater activity for the school strategy on the initial nine scans of the experiment and overall on the 5-digit problems, and it showed a trend toward a difference on the 3-digit problems in which there was no difference in RTs between the strategies. Among the confirmatory ROIs, the PSPL was the only area to show strategy differences in the exploratory analyses (strong differences in the right hemisphere and a trend in the left hemisphere). These
strategy effects are consistent with the role of the PSPL in internal attention and representation proposed by the triplecode theory. Conversely, activity in the HIPS did not differentiate between the strategies on 3-digit problems or early in 5-digit problems. The only strategy-related effect observed in the HIPS was longer activity in the school-5 than in the expert-5 problems, closely mirroring the RT differences between these conditions. This pattern suggests that the HIPS is involved in the magnitude processing of external stimuli, which is extended in the school-5 condition, but that it is not sensitive to the magnitudes of internal stored numbers. Among the ACT–R areas, the PPC responded to the strategy manipulation, although the effect was not as strong as might have been expected; it was evident only on the 5-digit problems. Conversely, the LIPFC area did not show any strategy effects, even on the 5-digit problems in which the school strategy took 5 sec longer. This LIPFC result is consistent with purported function of this area in retrieving semantic information proposed by ACT–R (Anderson, 2007; Danker & Anderson, 2007) and others (Buckner et al., 1999; Cabeza et al., 2002; Dobbins & Wagner, 2005). For the 3-digit problems, we instantiated in the model that the retrieval demands between the strategies would be constant, resulting in no strategy differences in this area. For the 5-digit problems, our explanation was more complicated: We proposed that the working memory demands of school-5 problems did produce extra rehearsal-related activity relative to expert-5 problems, but another feature of the school strategy—a longer outputting period—masked our ability to detect the difference. Alternatively, there may be no differences in the retrieval demands between the strategies at both problem lengths, and working memory differences between the strategies are expressed elsewhere in the brain. Both of these interpretations suggest that this area is not actively involved in the maintenance aspects of the task, informing our understanding of the role of the LIPFC and how people implement the strategies. The advantage of the expert strategy in the present study derives from the constraint of outputting the largest digit first and restricting to problems with carries that do not affect already-output digits. We implemented these task parameters in order to generate the behavioral signature and the working memory differences between the strategies. However, the utility of the expert strategy may extend beyond these experimental conditions. For example, if participants have to respond verbally and without pauses (as do lightning mental calculators), the expert strategy builds up the response in the order spoken, whereas in the school strategy, the first digit calculated is the last to be spoken. This difference is analogous to the ease of forward digit span tasks over backward tasks. (However, problems with carries that change more than one already computed digit would negate this advantage.) The expert strategy may also have educational benefits. The everyday mathematics curriculum developed by the University of Chicago School Mathematics Project (Carroll & Isaacs, 2003) teaches a left-to-right strategy similar to the expert strategy. The curriculum authors noted that this method trains estimation skills, stresses place-value
Neural Correlates of Strategies 283 knowledge, takes advantage of the distributive property of multiplication over addition, and prepares students for polynomial multiplication in algebra. These factors may contribute to the teaching of left-to-right multiplication in the United States, Korea, China, India, Japan, and other countries (informal survey). The third goal of the present study was to explore the differences between the ACT–R PPC area and the three areas of the triple-code theory. The PSPL, HIPS, and PPC all demonstrated robust task-related activity. However, the differential responses to the strategy manipulation and the sharp peak after the final keypress in the PSPL and the HIPS, but not in PPC, provide some evidence to distinguish among these areas. The activity of the imaginal module best predicted the ACT–R PPC area over any other ROI. We found a strong fit to the HIPS by combining the manual module with the imaginal module, suggesting a role of manual or visual processing in this area not found in the PPC. The PSPL was equally well fit by the imaginal module and by a combination of imaginal and manual modules, although the fits were weaker than were the correspondences for the other areas. In particular, the strong strategy effects in the PSPL were underestimated by the model. Several aspects of activity in this area not currently modeled in ACT–R could account for the poor fits. First, the PSPL is implicated in spatial working memory in a load-dependent way (Culham & Kanwisher, 2001), but ACT–R modules have no capacity limits. Second, the PSPL area has been implicated in eye movements and shifts of attention that could be more frequent in the school strategy (Simon et al., 2002). Adding these aspects to an ACT–R model could produce better predictions for the functioning of this area. The BOLD response in the angular gyrus was clearly different from that in the other parietal areas. We found no statistically significant responses to the experimental manipulations, nor was there even significant deviation from baseline in any condition. Greater activity for retrieval over calculation in arithmetic tasks has been observed in the angular gyrus (Delazer et al., 2003; Delazer et al., 2005). Given that our task compared different orders of calculation steps, this manipulation may not have produced a measurable response in this area. However, qualitative regularities in BOLD time courses suggest an alternative explanation. In all conditions, the BOLD signal dipped below baseline. Then, after the final keypress, it came back to positive values, overshooting baseline before returning to it. We have previously found task-related differences in activity that go below baseline in this area (Danker & Anderson, 2007; Sohn et al., 2005), as have others (Grabner et al., 2007). In fact, the greater activity for retrieval found by Delazer and colleagues (Delazer et al., 2003; Delazer et al., 2005) represented differences in negative activity. Together, these results suggest that the angular gyrus may be part of the default mode network (Raichle et al., 2001). In particular, it has been hypothesized that this area is involved in episodic encoding and retrieval in the resting state, which is suspended during challenging tasks (Greicius, Krasnow, Reiss, & Menon, 2003). Unfortunately, we were not able to model this area, because our methodology is based on the assumption that
activity in modules produces positive BOLD responses. Beyond this technical hurdle, the real stumbling block is a lack of precise characterization of the function of the angular gyrus, which could be instantiated in a computational model. This is an important direction for future research in this area. Strategy variation is an inherent part of human cognition and a challenging area of research in neuroimaging. We have shown that by investigating a domain with an extensive imaging literature and using a task with careful behavioral controls, we can fruitfully investigate the neural correlates of strategy variation. We demonstrated that reordered arithmetic strategies activate the same neural substrates, but that they can be distinguished by their profiles of cortical activity within those substrates. Moreover, by coupling this empirical work with computational modeling, we have been able to use strategies to further our understanding of the neural underpinnings of mathematics. Particularly, we found that activity in the PSPL and the ACT–R PPC was sensitive to the load differences between the strategies, but that other areas involved in numerical cognition and problem solving were not. Finally, we extended the ACT–R framework to two parietal areas identified by the triple-code theory, and we showed that these areas have a visual/motor component that is not found in the ACT–R parietal area. Author Note The present work was supported by Grant REC-0087396 from NSF to J.R.A., and a National Science and Engineering Research Council postgraduate scholarship to M.R.-L. The authors thank James Sta szewski and Jon Fincham for many helpful discussions, Jared Danker and Yvonne Kao for their comments on the manuscript, and Jennifer Ferris and Pat Gunn for their technical support. Address correspondence to M. Rosenberg-Lee, Stanford University, 780 Welch Road, Room 201, Palo Alto, CA 94304 (e-mail:
[email protected]). References Alivisatos, B., & Petrides, M. (1997). Functional activation of the human brain during mental rotation. Neuropsychologia, 35, 111-118. Anderson, J. R. (2007). Using brain imaging to guide the development of a cognitive architecture. In W. D. Gray (Ed.), Integrated models of cognitive systems (pp. 49-62). New York: Oxford University Press. Anderson, J. R., Carter, C. S., Fincham, J. M., Qin, Y., Ravizza, S. M., & Rosenberg-Lee, M. (2008). Using f MRI to test models of complex cognition. Cognitive Science, 32, 1323-1348. doi:10.1080/03640210802451588 Anderson, J. R., Fincham, J. M., & Douglass, S. (1997). The role of examples and rules in the acquisition of a cognitive skill. Journal of Experimental Psychology: Learning, Memory, & Cognition, 23, 932945. doi:10.1037/0278-7393.23.4.932 Anderson, J. R., Qin, Y., Sohn, M.-H., & Stenger, V. A. (2003). An information-processing model of the BOLD response in symbol manipulation tasks. Psychonomic Bulletin & Review, 10, 241-261. Anderson, J. R., Qin, Y., Stenger, V. A., & Carter, C. (2004). The relationship of three cortical regions to an information-processing model. Journal of Cognitive Neuroscience, 16, 637-653. Buckner, R. L., Kelley, W. M., & Petersen, S. E. (1999). Frontal cortex contributes to human memory formation. Nature Neuroscience, 2, 311-314. Cabeza, R., Dolcos, F., Graham, R., & Nyberg, L. (2002). Similarities and differences in the neural correlates of episodic memory retrieval and working memory. NeuroImage, 16, 317-330. Carpenter, P. A., Just, M. A., Keller, T. A., Eddy, W., & Thulborn, K. (1999). Graded functional activation in the visuospatial
284 Rosenberg-Lee, Lovett, and Anderson system with the amount of task demand. Journal of Cognitive Neuroscience, 11, 9-24. Carroll, W. M., & Isaacs, A. (2003). Achievement of students using the University of Chicago School Mathematics Project’s Everyday Mathematics. In S. L. Senk & D. R. Thompson (Eds), Standardsbased school mathematics curricula: What are they? What do students learn? (pp. 79-108). Mahwah, NJ: Erlbaum. Chochon, F., Cohen, L., van de Moortele, P., & Dehaene, S. (1999). Differential contributions of the left and right inferior parietal lobules to number processing. Journal of Cognitive Neuroscience, 11, 617-630. Cipolotti, L., Warrington, E. K., & Butterworth, B. (1995). Selective impairment in manipulating Arabic numerals. Cortex, 31, 73-86. Clark, D., & Wagner, A. D. (2003). Assembling and encoding word representations: fMRI subsequent memory effects implicate a role for phonological control. Neuropsychologia, 41, 304-317. Corbetta, M., Kincade, J. M., Ollinger, J. M., McAvoy, M. P., & Shulman, G. L. (2000). Voluntary orienting is dissociated from target detection in human posterior parietal cortex. Nature Neuroscience, 3, 292-297. Cox, R. W., & Hyde, J. S. (1997). Software tools for analysis and visualization of fMRI data. NMR in Biomedicine, 10, 171-178. Culham, J. C., & Kanwisher, N. G. (2001). Neuroimaging of cognitive functions in human parietal cortex. Current Opinion in Neurobiology, 11, 157-163. Danker, J. F., & Anderson, J. R. (2007). The roles of prefrontal and posterior parietal cortex in algebra problem solving: A case of using cognitive modeling to inform neuroimaging data. NeuroImage, 35, 1365-1377. doi:10.1016/j.neuroimage.2007.01.032 Davachi, L., Maril, A., & Wagner, A. D. (2001). When keeping in mind supports later bringing to mind: Neural markers of phonological rehearsal predict subsequent remembering. Journal of Cognitive Neuroscience, 13, 1059-1070. Dehaene, S., & Cohen, L. (1997). Cerebral pathways for calculation: Double dissociation between rote verbal and quantitative knowledge of arithmetic. Cortex, 33, 219-250. Dehaene, S., Piazza, M., Pinel, P., & Cohen, L. (2003). Three parietal circuits for number processing. Cognitive Neuropsychology, 20, 487-506. doi:10.1080/02643290244000239 Dehaene, S., Spelke, E., Pinel, P., Stanescu, R., & Tsivkin, S. (1999). Sources of mathematical thinking: Behavioral and brainimaging evidence. Science, 284, 970-974. Delazer, M., Domahs, F., Bartha, L., Brenneis, C., Locky, A., Trieb, T., & Benke, T. (2003). Learning complex arithmetic—An fMRI study. Cognitive Brain Research, 18, 76-88. Delazer, M., Ischebeck, A., Domahs, F., Zamarian, L., Koppel staetter, F., Siedentopf, C. M., et al. (2005). Learning by strategies and learning by drill—Evidence from an f MRI study. Neuro Image, 25, 838-849. Dobbins, I. G., & Wagner, A. D. (2005). Domain-general and domainsensitive prefrontal mechanisms for recollecting events and detecting novelty. Cerebral Cortex, 15, 1768-1778. doi:10.1093/cercor/bhi054 Glover, G. H. (1999). Deconvolution of impulse response in eventrelated BOLD fMRI. NeuroImage, 9, 416-429. Grabner, R. H., Ansari, D., Reishofer, G., Stern, E., Ebner, F., & Neuper, C. (2007). Individual differences in mathematical competence predict parietal brain activation during mental calculation. NeuroImage, 38, 346-356. doi:10.1016/j.neuroimage.2007.07.041 Greicius, M. D., Krasnow, B., Reiss, A. L., & Menon, V. (2003). Functional connectivity in the resting brain: A network analysis of the default mode hypothesis. Proceedings of the National Academy of Sciences, 100, 253-258. doi:10.1073/pnas.0135058100 Jackson, M., & Warrington, E. K. (1986). Arithmetic skill in patients with unilateral cerebral-lesions. Cortex, 22, 611-620. Kahn, H. J., & Whitaker, H. A. (1991). Acalculia—An historical review of localization. Brain & Cognition, 17, 102-115. Kwong, T. E., & Varnhagen, C. K. (2005). Strategy development and learning to spell new words: Generalization of a process. Developmental Psychology, 41, 148-159. doi:10.1037/0012-1649.41.1.148 Lee, K. M. (2000). Cortical areas differentially involved in multiplication and subtraction: A functional magnetic imaging study with a case of selective acalculia. Annals of Neurology, 48, 657-661. LeFevre, J.-A., Bisanz, J., Daley, K. E., Buffone, L., Greenham,
S. L., & Sadesky, G. S. (1996). Multiple routes to solution of singledigit multiplication problems. Journal of Experimental Psychology: General, 125, 284-306. Lovett, M. C., Daily, L. Z., & Reder, L. M. (2001). A source activation theory of working memory: Cross-task prediction of performance in ACT–R. Cognitive Systems Research, 1, 99-118. Menon, V., Rivera, S. M., White, C. D., Glover, G. H., & Reiss, A. L. (2000). Dissociating prefrontal and parietal cortex activation during arithmetic processing. NeuroImage, 12, 357-365. Naus, M. J., & Ornstein, P. A. (1983). Development of memory strategies: Analysis, questions, and issues. In M. T. H. Chi (Ed.), Trends in memory development research. New York: Karger. Pesenti, M. (2005). Calculation abilities in expert calculators. In J. I. D. Campbell (Ed.), Handbook of mathematical cognition (pp. 413-430). New York: Psychology Press. Qin, Y., Carter, C. S., Silk, E. M., Stenger, V. A., Fissell, K., Goode, A., & Anderson, J. R. (2004). The change of the brain activation patterns as children learn algebra equation solving. Proceedings of the National Academy of Sciences, 101, 5686-5691. doi:10.1073/ pnas.0401227101 Qin, Y., Sohn, M. H., Anderson, J. R., Stenger, V. A., Fissell, K., Goode, A., et al. (2003). Predicting the practice effects on the blood oxygenation level-dependent (BOLD) function of fMRI in a symbolic manipulation task. Proceedings of the National Academy of Sciences, 100, 4951-4956. doi:10.1073/pnas.0431053100 Raftery, A. E. (1995). Bayesian model selection in social research. In P. V. Marsden (Ed.), Sociological methodology (Vol. 25, pp. 111-163). Boston: Blackwell. Raichle, M. E., MacLeod, A. M., Snyder, A. Z., Powers, W. J., Gusnard, D. A., & Shulman, G. L. (2001). A default mode of brain function. Proceedings of the National Academy of Sciences, 98, 676-682. Reichle, E. D., Carpenter, P. A., & Just, M. A. (2000). The neural bases of strategy and skill in sentence–picture verification. Cognitive Psychology, 40, 261-295. Rogers, W. A., Hertzog, C., & Fisk, A. D. (2000). An individual differences analysis of ability and strategy influences: Age-related differences in associative learning. Journal of Experimental Psychology: Learning, Memory, & Cognition, 26, 359-394. doi:10.1037/0278 -7393.26.2.359 Siegler, R. S. (1987). The perils of averaging data over strategies: An example from children’s addition. Journal of Experimental Psychology: General, 116, 250-264. Siegler, R. S., & Alibali, M. W. (2005). Children’s thinking (4th ed.). Upper Saddle River, NJ: Prentice Hall. Siegler, R. S., & Lemaire, P. (1997). Older and younger adults’ strategy choices in multiplication: Testing predictions of ASCM using the choice/no-choice method. Journal of Experimental Psychology: General, 126, 22. Siegler, R. S., & Shrager, J. (1984). Strategy choices in addition and subtraction: How do children know what to do? In C. Sophian (Ed.), The origins of cognitive skills (pp. 229-293). Hillsdale, NJ: Erlbaum. Simon, O., Mangin, J. F., Cohen, L., Le Bihan, D., & Dehaene, S. (2002). Topographical layout of hand, eye, calculation, and languagerelated areas in the human parietal lobe. Neuron, 33, 475-487. Sohn, M.-H., Goode, A., Koedinger, K. R., Stenger, V. A., Fissell, K., Carter, C. S., & Anderson, J. R. (2004). Behavioral equivalence, but not neural equivalence—Neural evidence of alternative strategies in mathematical thinking. Nature Neuroscience, 7, 1193-1194. doi:10.1038/nn1337 Sohn, M.-H., Goode, A., Stenger, V. A., Jung, K.-J., Carter, C., & Anderson, J. R. (2005). An information-processing model of three cortical regions: Evidence in episodic memory retrieval. NeuroImage, 25, 21-33. doi:10.1016/j.neuroimage.2004.11.001 Staszewski, J. J. (1988). Skilled memory and expert mental calculation. In M. T. H. Chi, R. Glaser, & M. J. Farr (Eds.), The nature of expertise (pp. 71-128). Hillsdale, NJ: Erlbaum. van Harskamp, N. J., Rudge, P., & Cipolotti, L. (2002). Are multiplication facts implemented by the left supramarginal and angular gyri? Neuropsychologia, 40, 1786-1793. Wagenmakers, E.-J. (2007). A practical solution to the pervasive problems of p values. Psychonomic Bulletin & Review, 14, 779-804. Warrington, E. K. (1982). The fractionation of arithmetical skills— A single case-study. Quarterly Journal of Experimental Psychology:
Neural Correlates of Strategies 285 Human Experimental Psychology, 34A, 31-51. doi:10.1080/ 14640748208400856 Whalen, J., McCloskey, M., Lesser, R. P., & Gordon, B. (1997). Localizing arithmetic processes in the brain: Evidence from a transient deficit during cortical stimulation. Journal of Cognitive Neuroscience, 9, 409-417. Wojciulik, E., & Kanwisher, N. (1999). The generality of parietal involvement in visual attention. Neuron, 23, 747-764. Woods, R. P., Cherry, S. R., & Mazziotta, J. C. (1992). Rapid automated algorithm for aligning and reslicing PET images. Journal of Computer Assisted Tomography, 16, 620-633. Woods, R. P., Grafton, S. T., Holmes, C. J., Cherry, S. R., & Mazziotta, J. C. (1998). Automated image registration: I. General methods of intrasubject, intramodality variation. Journal of Computer Assisted Tomography, 22, 139-152.
Notes 1. In the expert strategy, it is possible for a later calculation to result in a carry that changes a previously calculated digit of the response. In our stimulus set, carries affected only the immediately preceding digit. Therefore, participants were instructed that they could reliably output the leading digit after performing an addition step. 2. This article can be found at http://act-r.psy.cmu.edu/publications/ pubinfo.php?id=793. 3. The stimuli criterion that the products be one more digit than the multiplicand produces this imbalance. Generally, in order to meet this criterion, the leftmost digit multiplication step must result in a 2-digit product (58 of the possible 64 products). Of the 58 products, only 6 have a first digit greater than 6, resulting in far more problems with first digits keyed by the left hand.
Appendix The event-locking method breaks up each trial into a number of intervals determined by behavioral markers, and then aligns each scan from each trial interval to the mean length of the interval for all trials of that condition. The behavioral markers were defined by the onset of the problem, the various keypresses, and the end of the rest period. The behavioral markers for each condition and the mean number of scans associated with each interval are listed in Table 2. The last three keypresses occurred so rapidly that they were all compressed into a single scan. Specifically, for each trial and each region of interest, the percent change of the BOLD response was calculated on each scan with reference to the first scan of the trial before the presentation of the problem (when the strategy instruction for the trial was presented). Then, these change scores were aligned to the mean interval lengths in Table 2. The following is the aligning procedure for taking a scan sequence of length n and deriving a scan sequence of the mean length m. It depends on the relative sizes of m and n: 1. If n is greater than or equal to m, create a sequence of length m by taking m/2 scans from the beginning, and m/2 scans from the end of the interval. If m is odd, select one more from the beginning. This means just deleting the n2m scans in the middle. 2. If n is less than m, create a beginning sequence of length m/2 by taking the first n/2 scans and padding with the last scan in this first n/2. Construct the end similarly. If either n or m is odd, the extra scan is from the beginning. This procedure creates scan sequences that preserve the temporal structure of the beginning and end of the sequences and that just represent the approximate average activity in their middle. These individual scan sequences were combined to create a complete sequence for each trial. Figure A1 illustrates how this alignment procedure would work for scans in the expert-3 condition. It shows how a hypothetical short trial of 13 scans and a hypothetical long trial of 22 scans would be warped onto the average 17-scan trial. The end of the trial always involves 8 scans and so is copied directly in all trials. However, in the case of the short trial, the same scan is copied to multiple positions of the canonical sequence, whereas in the case of the long trial, the middle scans are deleted. One consequence of this alignment procedure is that for each trial in a condition, the scans associated with individual keypresses occupy the same ordinal positions in the complete sequence. �
13 Scan
17 Scan
22 Scan
�
�
1 2 345 + + + + + + + +
1
1
2 345 + + + + + + + +
2 345 + + + + + + + +
Figure A1. The event-locking alignment procedure applied to two trials, one shorter than the template and one longer. Digits represent the keypresses; , the expert strategy instruction; 1, the fixation cross. (Manuscript received November 21, 2008; revision accepted for publication May 6, 2009.)