Apr 16, 2009 ... The application of statistical tools for the detection of fraud can ... A neural
network was implemented in R using 1994 auto insurance data.
Neural Networks for Insurance Fraud Detection Phillip Keung Joycelin Karel Curtis Bright April 16, 2009 According to the Insurance Information Institute, auto insurance fraud in 2007 amounted to $4.8 billion to $6.8 billion of claims in America alone. However, looking for fraud with claims adjusters is expensive and timeconsuming. The application of statistical tools for the detection of fraud can help focus the insurer’s resources and reduce the number of claims adjusters required. Furthermore, sophisticated models may be able to determine connections between variables that a human being would not have considered. Although neural networks are not within the scope of this course, the team decided that a neural network would be well-suited to the problem of finding dependencies and patterns in the data set. This report discusses a 2 hidden layer feedforward neural network created to analyze fraud data. Neural networks were inspired by discoveries in biology. Researchers hypothesized that the brain is essentially a large neural network. Connections between adjacent neurons strengthened or weakened based on the amount of relevant stimulation that the neurons received, and connected neurons fire to induce other neurons to fire. This insight provided a neural network which could be mathematically modelled, and has been used extensively in machine learning and classification. A neural network was implemented in R using 1994 auto insurance data from an unnamed insurer as a training set. The data set was adjusted before training began: many of the timing-related columns were summarized with a single “Days between accident and claim” column. The categorical data was converted into binary variates and the timing variate was entered as an 1
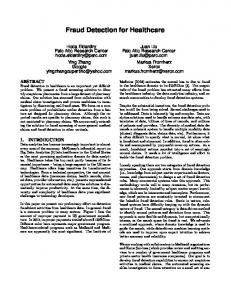
X
Ford Mazda Toyota .. .
−→
Ford 0
Mazda 1
Toyota 0
··· ···
Table 1: Converting the variate ‘Make’ into binary variates integer. (Table 1) To reduce the number of input nodes required, variates were grouped under the following labels: timing, demographics, policy, rating and socioeconomic status. Each node of the neural network took inputs, and had a weight for each input. The weights were set between −1 and 1 to reflect how certain factors can increase or decrease the probability of fraud. These weights can be interpreted as the importance of each input, as large weights affect the output significantly. The inner product of the inputs and the weights is called the activation value, denoted R. R=
n X
(weighti ) × (inputi )
i=1
Each neuron outputted a number between 0 and 1 as its response to the inputs, calculated using 1 . Output = 1 + e−R The ideal set of weights, or ‘brain’, of the network is the vector of 160 real numbers between −1 and 1 that maximizes the average precision of the network. As the brain of the network is a vector in R160 , Newton’s method and other forms of deterministic optimization were deemed unfeasible. They are too sensitive to choice of initial parameters, and no good estimates were available. Instead, a genetic algorithm was used to construct a decent, if not optimal, brain. Constrained Newton-type optimization (i.e., parameters restricted to the [−1, 1]160 hypercube) was also attempted using the genetic algorithm brain as a starting point. Unfortunately, the constrained optimization requires the calculation of the Hessian to build up a picture of the surface being optimized, and function evaluations (i.e., the neural network evaluating a set of data) were so computationally expensive that 48 hours of computing time was insufficient to find a solution within default tolerance. 2
Timing Socio Rating Demog Policy
Figure 1: A schematic of the implemented network The neural network, after 460 generations through the genetic algorithm, had an average precision of 27.7% on the training data set. This is a great improvement over the 6.7% average precision that would be expected with random ranking (note that the proportion of fraud in the training data is 6.7%.) The team members eagerly await the announcement of the effectiveness of their neural network on the test data set.
APPENDIX A: R Code # load genetic algorithm library library(genalg) # returns a number for every observation # this number is used to rank the observation # against other observations in the data set neuralNet