Author’s Accepted Manuscript Neural pattern similarity between contra- and ipsilateral movements in high-frequency band of human electrocorticograms Yusuke Fujiwara, Riki Matsumoto, Takuro Nakae, Kiyohide Usami, Masao Matsuhashi, Takayuki Kikuchi, Kazumichi Yoshida, Takeharu Kunieda, Susumu Miyamoto, Tatsuya Mima, Akio Ikeda, Rieko Osu
PII: DOI: Reference:
www.elsevier.com
S1053-8119(16)30676-0 http://dx.doi.org/10.1016/j.neuroimage.2016.11.058 YNIMG13606
To appear in: NeuroImage Received date: 26 September 2016 Revised date: 31 October 2016 Accepted date: 22 November 2016 Cite this article as: Yusuke Fujiwara, Riki Matsumoto, Takuro Nakae, Kiyohide Usami, Masao Matsuhashi, Takayuki Kikuchi, Kazumichi Yoshida, Takeharu Kunieda, Susumu Miyamoto, Tatsuya Mima, Akio Ikeda and Rieko Osu, Neural pattern similarity between contra- and ipsilateral movements in high-frequency band of human electrocorticograms, NeuroImage, http://dx.doi.org/10.1016/j.neuroimage.2016.11.058 This is a PDF file of an unedited manuscript that has been accepted for publication. As a service to our customers we are providing this early version of the manuscript. The manuscript will undergo copyediting, typesetting, and review of the resulting galley proof before it is published in its final citable form. Please note that during the production process errors may be discovered which could affect the content, and all legal disclaimers that apply to the journal pertain.
Neural pattern similarity between contra- and ipsilateral movements in high-frequency band of human electrocorticograms Yusuke Fujiwaraa*, Riki Matsumotob*, Takuro Nakaec, Kiyohide Usamic, Masao Matsuhashid, Takayuki Kikuchic, Kazumichi Yoshidac, Takeharu Kuniedac,e, Susumu Miyamotoc, Tatsuya Mimad,f, Akio Ikedab,1, Rieko Osug,1 a ATR Neural Information Analysis Laboratories, 2-2-2 Hikaridai, Seika-cho, Soraku-gun, Kyoto 619-0288, Japan b Department of Epilepsy, Movement Disorders and Physiology, Kyoto University Graduate School of Medicine, 54 Shogoin-kawaharacho, Sakyo-ku, Kyoto 606-8507, Japan c Department of Neurology, Kyoto University Graduate School of Medicine, 54 Shogoin-kawaharacho, Sakyo-ku, Kyoto 606-8507, Japan d Human Brain Research Center, Kyoto University Graduate School of Medicine, 54 Shogoin-kawaharacho, Sakyo-ku, Kyoto 606-8507, Japan e Department of Neurosurgery, Ehime University Graduate School of Medicine, Shitsukawa, Toon City 791-0295 Ehime, Japan. f Graduate School of Core Ethics and Frontier Sciences. Ritsumeikan University, 56-1 Toji-in Kitamachi, Kita-ku, Kyoto 603-8577, Japan g ATR Computational Neuroscience Laboratories, 2-2-2 Hikaridai, Seika-cho, Soraku-gun, Kyoto 619-0288, Japan
[email protected] [email protected] * Correspondence to: ATR Neural Information Analysis Laboratories, 2-2-2 Hikaridai, Seika-cho, Soraku-gun, Kyoto 619-0288, Japan. * Correspondence to: Department of Epilepsy, Movement Disorders and Physiology, Kyoto University Graduate School of Medicine, 54 Shogoin-kawaharacho, Sakyo-ku, Kyoto 606-8507, Japan.
Abstract The cortical motor areas are activated not only during contralateral limb movements but also during ipsilateral limb movements. Although these ipsilateral activities have been observed in several brain imaging studies, their functional role is poorly understood. Due to its high temporal resolution and low susceptibility to artifacts from body movements, the electrocorticogram (ECoG) is an advantageous measurement method for assessing the human brain function of motor behaviors. Here, we demonstrate that contra- and ipsilateral movements
1
Akio Ikeda and Rieko Osu contributed equally to this work. and thus are joint senior authors.
1
share a similarity in the high-frequency band of human ECoG signals. The ECoG signals were measured from the unilateral sensorimotor cortex while patients conducted self-paced movements of different body parts, contra- or ipsilateral to the measurement side. The movement categories (wrist, shoulder, or ankle) of ipsilateral movements were decoded as accurately as those of contralateral movements from spatial patterns of the high-frequency band of the precentral motor area (the primary motor and premotor areas). The decoder, trained in the high-frequency band of ipsilateral movements generalized to contralateral movements, and vice versa, confirmed that the activity patterns related to ipsilateral limb movements were similar to contralateral ones in the precentral motor area. Our results suggest that the high-frequency band activity patterns of ipsilateral and contralateral movements might be functionally coupled to control limbs, even during unilateral movements. Keywords: Ipsilateral movement, Precentral motor cortex, High gamma, ECoG, Decoding 1 Introduction The precentral motor cortex (the primary motor [M1] and premotor [PM] areas) that mainly controls contralateral limbs, also demonstrates activity change related to ipsilateral limb movements in monkeys (Cisek et al., 2003; Donchin et al., 1998; Matsunami and Hamada, 1981; Tanji et al., 1988) and humans (Shibasaki and Kato, 1975; Kim et al., 1993; Salmelin et al., 1995a; Kawashima et al., 1998; Cramer et al., 1999; Toma et al., 2002; Verstynen, 2004). After damage to a unilateral sensorimotor area, the brain activity on the side ipsilateral to the paralyzed limb increases to compensate for the affected contralateral area (Johansen-Berg et al., 2002; Gerloff, 2006; Lotze, 2006). Modulation of ipsilateral arm muscle activation by transcranial magnetic stimulation (TMS) of M1 has also been found in healthy subjects (Tazoe and Perez, 2014). Anatomically, homologous regions of both hemispheres (e.g., left and right M1s) are inter-connected via the corpus callosum (Killackey et al., 1983; Zarei et al., 2006; Wahl et al., 2007), and a portion of corticospinal fibers from the M1 and premotor area
2
terminate on ipsilateral ventral horn in the spinal cord (Dum and Strick, 1991; 1996). The neural activity during ipsilateral movements might depend on this structure.
Recently, decoding analysis has been developed to characterize neural ensembles, in which multivariate signals from brain activity (multiunit recording, electroencephalogram [EEG], magnetoencephalogram [MEG], electrocorticogram [ECoG], and functional magnetic resonance imaging [fMRI]) are weighted and combined to decode perceptions and motor behaviors (e.g., movement direction or trajectory) (Taylor et al., 2002; Leuthardt et al., 2004; Kamitani and Tong, 2005; Yanagisawa et al., 2009; Bradberry et al., 2010; Pasley et al., 2012; Haar et al., 2015). A merit of such decoding analysis is that it can assess the differences in neural patterns or multivariate activities with regard to movement categories (e.g., wrist and shoulder), indistinguishable by univariate analysis (e.g., average of activity pattern). If the pattern of neural population varies systematically with movement categories, it is possible to decode them. Using this technique, ipsilateral movements have recently been decoded from EEG (Bundy et al., 2012), ECoG (Scherer et al., 2009; Liu et al., 2010; Hotson et al., 2014), and fMRI (Diedrichsen et al., 2013). However, these studies did not clarify the similarity or disparity between neural representations of contra- and ipsilateral movements.
Here, we hypothesize that ipsilateral movements are coded in the same fashion as contralateral movements in the precentral motor cortex, and if so, movement categories in both ipsi- and contralateral conditions can be classified by a same decoder. This hypothesis can be verified by the cross-decoding technique (Stokes et al., 2009), that is, if a decoder trained with one condition (e.g., visual perception) is generalized to the other condition (e.g., visual imagery), one can argue that the neural representations are consistent across the two conditions.
3
It has long been thought that multiple bands of neural oscillations have a role in movement. The amplitude of the low-frequency band (8–12 Hz, called mu) is typically decreased by actual movements or motor imagery, whereas the amplitude of the middle-frequency band (18–26 Hz, called beta) is increased by such movements or imagery (Salmelin et al., 1995b; Pfurtscheller and Lopes da Silva, 1999; Miller et al., 2010). The scalp EEG (Ball et al., 2008), ECoG (Miller et al., 2007; 2009; Yanagisawa et al., 2011; Pistohl et al., 2012), and MEG (Cheyne et al., 2008) studies have reported that the amplitude of the high-frequency band (50–150 Hz, called high gamma) increases with movement. Several ECoG studies have succeeded in decoding the information on movements from the high-frequency bands (Kubánek et al., 2009; Yanagisawa et al., 2011; Pistohl et al., 2012), and these movement-related modulations were also observed in ipsilateral movements (Ohara, 2000; Jurkiewicz et al., 2006).
In this study, we analyzed ECoG data to assess which frequency band had a similar pattern between contra- and ipsilateral movements. ECoG is advantageous for investigation of motor behaviors because of its high temporal and spatial resolution, high signal-to-noise ratio, and data free from artifacts of limb movements. In particular, it is easier to detect high-frequency (high gamma) bands related to motor behavior with ECoG than with scalp EEG. ECoG data were measured from electrodes covering the unihemispheric sensorimotor area while patients conducted self-paced movements of different body parts (wrist extension, shoulder abduction, and ankle dorsiflexion), contra- or ipsilateral to the measurement side. The decoding analysis conducted separately for contra- and ipsilateral movements demonstrated that the high-frequency band of the precentral motor area (the primary motor and premotor areas) was informative in classifying the movement categories in both conditions. We, then, performed cross-decoding across contra- and ipsilateral movements, in which the decoder trained with the data of contralateral (ipsilateral) condition was generalized to the data of the ipsilateral (contralateral) condition. Using the high-frequency band in the precentral motor cortex, the
4
decoder was generalized across the two conditions.. These results confirmed that the high-frequency band in the precentral motor cortex shares similarity across contra- and ipsilateral movements.
2 Methods 2.1 Subjects Three patients (Patient 1, age 35; Patient 2, age 34; Patient 3, age 61; all male subjects) underwent chronic subdural electrode placement over the frontoparietal area for functional mapping around a lesion (all cases), and presurgical evaluation of intractable epilepsy (Patients 2 and 3). Subdural grid or strip electrodes were placed according to the clinical needs. Electrodes were made of platinum, with a recording diameter of 2.3 mm, and a center-to-center interelectrode distance of 1 cm (Ad-Tech, Racine, WI). All patients had tumorous lesions in the hemisphere where electrodes were implanted (right dorsomedial prefrontal cortex in Patient 1, left dorsomedial prefrontal cortex in Patient 2, and left supramarginal gyrus in Patient 3). Two of three patients (Patients 2 and 3) had intractable partial epilepsy, which was suspected of having arisen from around the lesion. No seizure activity was observed in the ECoG data used in the present study.
To define the location of subdural electrodes on the cortical surface, electrodes were co-registered to a structural MRI that was reconstructed from a magnetization-prepared rapid gradient echo (MPRAGE) sequence. The MPRAGE volumetric scan was performed before and after implantation of subdural electrodes, as a part of the presurgical evaluations. In the volumetric scan taken after implantation, the location of each electrode was identified on the 2D slices using its signal void, which occurred due to a property of the platinum alloy (Matsumoto et al., 2004).
5
The present study was approved by the Ethics Committee of Kyoto University Graduate School of Medicine (No. 79, C533). Written informed consent was obtained from all patients.
2.2 Task The patients performed self-paced brisk movements at intervals of around 10 s. The movement involved wrist extension, shoulder abduction, and ankle dorsiflexion. The movements were performed separately in the sides ipsilateral and contralateral to the recording hemisphere. Actual motor tasks were determined based on each patient’s condition- Patient 1: wrist and shoulder; Patient 2: shoulder and ankle; Patient 3: wrist, shoulder, and ankle. The patients were instructed to make brisk movements while keeping their muscles relaxed between movements. ECoGs of at least 100 trials were recorded for each movement category.
2.3 Data recording ECoG and EMG were recorded in Patients 1 and 2 at a sampling rate of 2000 Hz, and in Patient 3 at a sampling rate of 1000 Hz (EEG1100, Nihon Kohden Co., Tokyo, Japan. The sampling rate of this measurement system degrades to 1000 Hz when the number of electrodes exceeds 70 [106 electrodes in Patient 3]). Recordings from subdural electrodes were referenced to a scalp electrode placed on the skin over the mastoid process, contralateral to the side of electrode implantation. Target muscle activation was monitored by electromyogram (EMG) so that movement onset could be easily identified visually. We bilaterally placed a pair of shallow cup electrodes 2-cm apart on the skin over each corresponding muscle: the extensor digitorum communis (EDC) and the deltoideus (DEL) in Patient 1; the extensor carpi ulnaris (ECU), DEL, and the tibialis anterior (TA) in Patient 2; and the extensor carpi radialis (ECR), DEL, and TA in Patient 3.
6
2.4 Functional cortical mapping by high-frequency electrical cortical stimulation High-frequency electrical cortical stimulation for functional cortical mapping was performed as a part of the routine presurgical evaluation. Repetitive square wave electrical currents of alternating polarity with a pulse width of 0.3 ms and a frequency of 50 Hz were delivered for 2– 5 s via an electrical stimulator (SEN-7203 for Patient 1, and MS-120B/MEE-1232 for Patients 2 and 3, both manufactured by Nihon Kohden). Details of the methodology for cortical stimulation and subsequent cortical mapping have been described elsewhere (Luders, 1987; Matsumoto et al., 2007). In the lateral convexity, the precentral motor area (M1+PM) area was identified by a positive motor response, such as a muscle twitch in contralateral upper or lower extremity. We treated M1 and PM as a single area in this study because it is difficult to dissociate them by electrical cortical stimulation, which elicits similar positive motor responses on M1 and PM. S1 was defined by subjective sensory sensation. The supplementary motor area (SMA) was defined in Patient 1 based on the evoked positive motor response in contralateral upper or lower extremity. Although it was not possible to differentiate the foot portion between SMA and M1, this was not important for our analysis, as we focused on wrist and shoulder movements for Patient 1 (wrist- and shoulder- related activities in the medial wall [SMA; Fried et al., 1991] are not congruent with the somatotopy of M1 [Lotze et al., 2000]). Thus, we labeled this area as SMA for convenience. The negative motor area (NMA) was defined for Patients 2 and 3 as a cortical site where the stimulation interfered with tonic muscle contraction or rapid alternating movements. We excluded the NMA of Patient 3 from analysis because only 2 electrodes were determined as NMA, and this was insufficient for the decoding and similarity analyses. Fig. 1 shows the location of ECoG electrodes functionally defined by the electric stimulation, and Table 1 indicates the number of electrodes in each area. All electrodes eliciting different muscles (wrist, shoulder, and ankle) in each area (M1+PM, S1, SMA, and NMA) were used for the decoding analysis. In Patient 2, the functional mapping could not be fully performed because of dural pain (headache caused by stimulation of the falx cerebri), which
7
constrained the maximal intensity of stimulation. Although we observed decreased signals in a T1-weighted MR image around a small number of electrodes in Patient 1 (2 electrodes) and Patient 2 (1 electrode) due to lesions, we found positive motor responses by high-frequency electrical stimulation on these electrodes. Therefore, we concluded that motor functions were retained in the tissues under the electrodes and were used for our analysis.
2.5 Data preprocessing Movement onset was identified visually as a sudden onset of continuous EMG activity. To detect inadequate trials in which bilateral movements occurred, the standard deviations (SD) of contralateral EMG (opposite to ECoG electrodes) signals before (–0.5 s to 0 s) and after (0 ms to 0.5 s) movement onset (0 ms) were calculated, and trials whose SD after the onset exceeded 10% of the SD before it, were removed from our analysis. This procedure was essential to evaluate our hypothesis about ipsilateral movements, as the neural signals related to contralateral movements would contaminate the signals related to ipsilateral movements when limbs on both sides of the body moved. Fig. 2A shows the bilateral EMGs after removal of bilateral movements (all trials were overlaid). After this procedure, movement-related EMG activity in contralateral homonymous muscle was not observed during ipsilateral movements. Electrodes with high amplitude (> 500 µV) according to interictal epileptic activity were checked. No electrode exceeded the threshold in the 4 regions of interest defined by functional cortical mapping by electrical cortical stimulation. ECoG signals from each electrode of Patient 1 and 2 were downsampled to 1000 Hz, to match the 1000 Hz sampling rate used for Patient 3.
A time-frequency analysis of ECoG signals was conducted for a 4 s duration before and after movement onset (–2 s to 2 s) for each trial. The power spectrum ranging from 2 to 150 Hz was calculated by applying a fast Fourier transform to each time window (250 ms with an overlap of 125 ms) of ECoG signals. The estimated power was divided by the average power of the data
8
during no-movement period (–3 s to –2 s) to evaluate the amplitude changes related to movements over different frequencies within the same amplitude range and to restrict a trial-to-trial variability of ECoG signals.
2.6 Decoding analysis within ipsi- or contralateral movements As feature values for the decoding analysis, we selected 3 frequency power bands: a high-frequency band (64–120 Hz), middle-frequency band (14–40 Hz) and low-frequency band (2–8 Hz). These power bands were calculated by applying a fast Fourier transform to signals in 500-ms time windows from the onset of movement. In addition to these power bands, we also used the low-pass filtered component of ECoG time series as input to the decoder, because several previous studies had succeeded in using this component to decode motor behaviors (Ball et al., 2009; Yanagisawa et al., 2009; Pistohl et al., 2012). To calculate the low-pass filtered component, namely, the slow components of movement-related cortical potential (MRCP), ECoG signals in the time domain were baseline-corrected by subtracting the average value of data during a no-movement period (–3 s to –2 s) for each trial, followed by application of a low-pass filter with a cut-off frequency of 5 Hz. Then the average value in the 500-ms window from the onset of movement was calculated for each electrode. The wrist and shoulder movements terminated at around 500 ms after movement onset; hence, we restricted the time window of our decoding analysis to 0–500 ms. These 4 components from electrodes in the regions of interest (ROI: M1+PM and S1 for all 3 patients, SMA for Patient 1 and NMA for Patient 2) were used in our analyses.
The decoding analyses for contra- and ipsilateral movements were conducted separately. The trial numbers were adjusted according to the minimum number of trials in any movement category, to avoid biasing the decoder predictions towards a specific movement. The total
9
numbers of trials in the ipsilateral data were 130, 84, and 156, and 152, 122, and 258 in the contralateral data for Patients 1, 2, and 3 respectively.
First, we classified the trial-by-trial ECoG signals into the movement categories (wrist, shoulder, and ankle) using all the features (the dimensionality of the feature vectors was the number of electrodes in all ROIs [Table 1] × the 4 components [64–120 Hz, 14–40 Hz, 2–8 Hz and low-pass filtered signal]). To prune off irrelevant features and enhance the selection of relevant features to movements, we used the L1-regularized linear support vector machine (L1-regularized SVM; implemented in LIBLINEAR [Fan et al., 2008]). The decoding performance was evaluated by nested cross-validation. The trials were randomly divided into 5 sets of equal size. In the outer 5-fold cross-validation loop, 1 set was left to test the performance, and the remaining 4 sets were used to estimate the regularization parameter C and decoder weight. In the inner loop, 4-fold cross-validation was performed to search the optimal C varying from 0.01 to 1 in steps of 0.01. The average values of Cs and weights calculated in the inner loop were tested in the outer loop. This procedure was repeated 5 times to evaluate the decoding accuracy for the whole data set.
Second, we performed a decoding analysis for each feature (64–120 Hz, 14–40 Hz, 2–8 Hz and low-pass filtered signal) in each ROI (the dimensionality of the feature vector was the number of electrodes in each ROI) using the linear SVM (hard-margin; implemented in LIBSVM [Chang and Lin, 2011]). In this case, there was no additional parameter such as C to be validated. Thus, we conducted a 5-fold cross-validation procedure to evaluate the decoding performance. Four sets were used to train the decoder, and the remaining set was used to test the decoder performance.
10
A permutation test was conducted to evaluate whether the decoding accuracy was significantly above the chance level. The trial labels (wrist, shoulder, and ankle) were randomized, and the decoders were trained and tested using ECoG signals with these randomized labels, in a similar way to the decoding analysis performed on non-randomized data. A null distribution was generated by repeating this procedure 500 times, and we considered statistical significance to be a decoding accuracy above the 99th percentile of the null distribution (p < 0.01).
2.7 Cross decoding between contra- and ipsilateral movements The generalization capability of the decoder between contra- and ipsilateral movements was evaluated to examine whether the spatial patterns of ECoG signals coding ipsilateral movements were similar to those coding contralateral movements. In this analysis, the decoder was trained using the data of the movements on one side of the body (ipsi/contra), and was then used to decode the movement categories in the opposite side (contra/ipsi). All trials from one side were used to train the decoder, and all trials from the opposite side were used to test the decoder, and vice versa. This procedure was performed for the decoding with all components in all ROIs using L1-regularized SVM (the regularization parameter C was evaluated using 5-fold cross-validation) and for the decoding with each component using ordinary linear SVM. A permutation test was conducted to evaluate whether the decoding accuracy was significantly higher than the chance level in a similar way to the decoding analysis within contra- or ipsilateral movements.
2.8 Spatial correlation analysis between ipsi- and contralateral neural patterns In the electrodes of M1+PM and S1, spatial correlation between the amplitudes of contra- and ipsilateral movements for each component (64–120 Hz, 14–40 Hz, 2–8 Hz and low-pass filtered signal) was calculated using Pearson's correlation coefficient, to estimate the similarity between contra- and ipsilateral movements. The variables used to evaluate the correlation coefficient
11
were similar to the feature values for the decoding analysis in M1+PM and S1. The correlation coefficients of all possible trial combinations between contra- and ipsilateral movements (e.g., 130 ipsi-trials × 152 contra-trials for Patient 1) were calculated and averaged for each movement category. A t-test was performed for each component to evaluate whether the average spatial correlation across movements was significantly higher than 0. The difference in the average spatial correlations across components was tested by one-way ANOVA (p < 0.05), and multiple paired t-test comparisons were then performed to detect significant differences in the spatial correlations between two components (p < 0.05, false discovery rate corrected).
3 Results We analyzed ECoG data from multiple movement categories (wrist, shoulder, and ankle) to test our hypothesis that ipsilateral movements are coded in a similar activity pattern as contralateral movements in the sensorimotor cortex. The movement categories were decoded from the power of several frequency bands for the brain areas, M1+PM, S1, SMA, and NMA, which were determined by electrical cortical stimulation. The similarity of cortical activity patterns between contra- and ipsilateral movements was measured using cross-decoding and spatial correlation across contra- and ipsilateral movements.
3.1 Ipsilateral movement-related cortical potentials Fig. 2B shows examples of the movement-related cortical potentials (MRCPs) at each electrode in M1+PM and S1 during 3 movement categories (wrist [ECR], shoulder [DEL] and ankle [TA]) in Patient 3. The movement-related modulation was observed for both contra- and ipsilateral movements prior to movement onset. There was no significant difference (t-test, p > 0.05) in lags of peak amplitudes of MRCPs between ipsi- and contralateral movements for all movement categories (Fig. 2C).
12
Movement-related modulations were also observed in the frequency domain. Fig. 3A represents the average spectrograms of representative electrodes over all trials of shoulder movement. During contralateral movements, an increase in the amplitude of the high-frequency band (> 60 Hz) and a decrease in the amplitude of the middle-frequency band (10-40 Hz) were found around movement onset. These are consistent with the high gamma band and beta band modulations found in previous ECoG (Miller et al., 2007; Miller et al., 2009; Yanagisawa et al., 2011; Pistohl et al., 2012) and MEG (Cheyne et al., 2008) studies. During ipsilateral movements, increase in the high-frequency bands of Patients 1 and 3 were also observed, while clear modulation in the high-frequency band of Patient 2 disappeared. Although a decrease in the middle-frequency band during ipsilateral movements became weaker than that of contralateral movements, it still existed.
To quantitatively evaluate these movement-related modulations, we defined the 4 components (64–120 Hz, 14–40 Hz, 2–8 Hz and low-pass filtered signal) in M1+PM, and calculated the average values over all trials (movement categories pooled). We then obtained the across-electrode average of the amplitudes of these components for contra- and ipsilateral movements (Fig. 3B). All across-electrode average amplitudes of contra- and ipsilateral movements, except for the 2–8 Hz band of ipsilateral movement, showed a significant increase (64–120 Hz, 2–8 Hz and low-pass filtered signal) or decrease (14–40 Hz) from the baseline (no-movement period). The amplitudes of ipsilateral movement were significantly smaller than contralateral movement in the 64–120 Hz, 2–8 Hz and low-pass filtered signals, whereas there was no significant difference in the 14–40 Hz signals between the movement sides. The amplitude modulation by ipsilateral movements and contralateral movements was distributed in wide frequency bands, although ipsilateral modulation was smaller than the contralateral one.
13
We then examined the amplitude differences according to the 3 movement categories (wrist, shoulder, and ankle), by sorting the amplitudes of contra- and ipsilateral movements into those of the 3 movement categories for each frequency component (Fig. 3C). The differences of the average-electrode amplitudes across movement categories were tested by one-way ANOVA. The average amplitudes of both contra- and ipsilateral movements in 64–120 Hz and 2–8 Hz showed significant effects (p < 0.01). The average amplitudes of ipsilateral movements in the low-pass filtered signal were also significantly different (p < 0.01). The average amplitudes of both contra- and ipsilateral movements in 14–40 Hz, and those of contralateral movements in the low-pass filtered signal, showed no significant difference (p > 0.48). This univariate statistical analysis might imply that the different patterns of amplitudes of the high- and low-frequency components represent the different movement categories.
3.2 Decoding using all components We evaluated whether movement-related modulations (Fig. 3) could identify the different categories (Patient 1, wrist vs. shoulder; Patient 2, shoulder vs. ankle; Patient 3, wrist vs. shoulder vs. ankle) in contra- and ipsilateral movements by using all components of all ROIs. The decoding performances of L1-regularized SVM were above 90% for contralateral movements and above 80% for ipsilateral movements in all patients (Fig. 4A). We also quantified decoding performances independent of the decision boundary of the decoder by calculating the area under the ROC curve (AUC), which confirmed these decoding performances were high (contra: > 0.9, ipsi: > 0.8) in Patients 1 and 2. The confusion matrix of Patient 3 shows the detailed results of 3-class decoding (wrist, shoulder, and ankle), in which the 3 movement types were accurately predicted.
Next, we conducted cross-decoding (Stokes et al., 2009) to examine whether the trained decoder with data of contra- or ipsilateral movements was generalized to the opposite side (ipsi- or
14
contralateral) movements. If the decoder can generalize to the movement of the opposite side, it demonstrates that both movements are encoded in a similar fashion. The cross-decoding between contra- and ipsilateral movements showed significant decoding performance above the chance level (Fig. 4B). However, the generalization performances to the opposite-side movements were lower than the decoding accuracy within contra- and ipsilateral movements (Fig. 4A, light and dark grays indicate results using data of contra- and ipsilateral movements as test data, respectively). It might indicate that some components are invariant, and other components are changed across contra- or ipsilateral movements.
The L1-regularized SVM automatically selects features relevant to the classification of movement categories. We checked which feature values were commonly selected for both contra- and ipsilateral movements (Fig. 4C). However the selection of components were not consistent across subjects. The sparse algorithm including the L1-regularized SVM tends to select a small number of high signal-to-noise ratio (S/N) components from high dimensional data (all components of all ROIs) while the S/N may be variable across subjects dependent on positions of ECoG electrodes (Fig. 1). These algorithmic and measurement factors might result in the inconsistency across subjects. To avoid it, next we evaluate each components of each ROI.
3.3 Decoding using each component To investigate which component was most relevant to the classification of movement categories, we conducted a decoding analysis using each component (64–120 Hz, 14–40 Hz, 2–8 Hz and low-pass filtered signal) of each ROI (M1+PM, S1, SMA, and NMA) separately. For contralateral movements, the movement category was significantly decoded (permutation test, p < 0.01) from the amplitudes of the high frequency band (64–120 Hz) and the low-pass filtered signal of M1+PM in all 3 patients (Fig. 5A, red and blue); a finding similar to the results of
15
previous ECoG studies (Kubánek et al., 2009; Yanagisawa et al., 2011; Pistohl et al., 2012). In S1, the high- (64–120 Hz) and middle- (14–40 Hz) frequency bands also possessed informative activity patterns for the movement categories (Fig. 5A, yellow). The decoding accuracies of the high- and middle-frequency bands, and low-pass filtered signals from SMA (Patient 1 only) were significant (permutation test, p < 0.01). For NMA (Patient 2 only), statistical significance was only found for the high-frequency band (permutation test, p < 0.01).
We next conducted a similar decoding analysis for ipsilateral movements (Fig. 5B). The decoding accuracies of the amplitude of the high-frequency band in M1+PM and S1 decreased from those of contralateral movements but were still significantly above the chance level (permutation test, p < 0.01) for all 3 patients (Fig. 5B, red); a finding similar to the results of previous ECoG studies (Scherer et al., 2009; Liu et al., 2010). The decoding accuracies using the other components were not consistently significant across all patients. SMA showed significant decoding results (permutation test, p < 0.01) when the high-frequency band and low-pass filtered signal were used, while NMA did not demonstrate a significant decoding accuracy for any of the 4 components. Information specific to the movement category was present in activities of the high-frequency band of M1+PM, S1, and SMA during ipsilateral movements. The AUCs and confusion matrices also indicate that the high-frequency bands have effects on decoding the contra- and ipsilateral movements. We also conducted the decoding analysis using sparse logistic regression (Yamashita et al., 2008), and these results were similar to those using SVM (Fig. 5).
In summary, the significant results consistent across patients were obtained when the high-frequency bands in M1+PM and S1 were used, which indicates that movement categories are represented in different patterns of the high-frequency bands both for contra- and ipsilateral movements.
16
3.4 Cross decoding between contra- and ipsilateral movements The significant decoding results from the high-frequency bands of M1+PM and S1 during both contra- and ipsilateral movements (Fig. 5) might imply that M1+PM and S1 codes both movements using the same neural pattern in the high-frequency band. To examine this possibility, we conducted the cross-decoding for each component independently. The generalizations to movements of the opposite side were consistently significant (permutation test, p < 0.01) in both directions (trained with contralateral data and tested with ipsilateral data and vice versa), for all 3 patients, when the high-frequency band of M1+PM was used (Fig. 6AB, red). The reciprocal generalization of the high-frequency band of M1+PM supports our hypothesis that contra- and ipsilateral movements are represented by the same neural pattern. The AUCs (Patients 1 and 2) of the high-frequency band were high in both directions. The confusion matrix of the high-frequency band indicates that the decoder was able to classify upper and lower limbs (wrist and shoulder vs. ankle), but it had difficulty in classifying upper limbs (wrist vs. shoulder).
The low-pass filtered signals of M1+PM and the high-frequency band of S1 were able to generalize (permutation test, p < 0.01) in one direction (ipsi > contra: trained with ipsilateral data and tested with contralateral data). The high-frequency band of SMA was significant (permutation test, p < 0.01) for both directions, whereas that of NMA, was significant (permutation test, p < 0.01) in one direction (ipsi > contra).
3.5 Spatial correlations in the neural activity between contra- and ipsilateral movements Finally, we checked the similarity between the activity patterns of contra- and ipsilateral movements by calculating a spatial correlation (movement categories and patients pooled) between the contra- and ipsilateral patterns for each component in M1+PM (Fig. 7A) and S1
17
(Fig. 7B). The high- (64–120 Hz), middle- (14–40 Hz) and low- (2-8 Hz) frequency bands of M1+PM showed highly significant correlation above 0 (t-test, p < 0.001). The low-pass filtered signal of M1+PM and the high- (64–120 Hz), middle- (14–40 Hz) and low- (2-8 Hz) frequency bands of S1 were significant (t-test, p < 0.01). Then, we tested the statistical difference between the 4 components by one-way ANOVA in each area. The effect was significant in M1+PM (ANOVA, p < 0.05). Multiple comparison tests showed the high- and middle-frequency bands to be significantly higher than the low-frequency band in M1+PM (paired t-test, p < 0.05). It was not significant in S1 (ANOVA, p = 0.30). The spatial patterns of the high- and middle-frequency bands in M1+PM were more similar between the contra- and ipsilateral movements than the other components, which also suggests the neural pattern similarity between ipsi- and contralateral movements in the high frequency band of M1+PM.
4 Discussion We applied cross-decoding technique to the 4 components of ECoG, namely, slow cortical potentials, and low- (mu), middle- (beta), and high- (high gamma) frequency activities, during ipsilateral and contralateral movements. Our goal was to investigate which component had a similarity across contra- and ipsilateral movements. Using activity patterns of the high-frequency band, ipsilateral as well as contralateral movement categories were significantly classified (Fig. 5) for the precentral motor area (M1+PM) and S1 (also SMA for Patient 1), which suggests that information on contra- and ipsilateral movement categories might be best represented in activity pattern of the high-frequency band. The cross-decoding and spatial correlation analyses across contra- and ipsilateral movements showed the similarity in activity patterns within the high-frequency band between the two sides (Figs. 6 and 7).
4.1 Cortical organization about decoded signals
18
We showed the significant decoding accuracies for contralateral movements using the high-frequency bands (Fig. 5A) in the precentral motor area, which were consistent with the previous ECoG studies (Kubánek et al., 2009; Yanagisawa et al., 2011; Pistohl et al., 2012). This classification performance might be based on the somatotopic organization in the high-frequency band (Crone et al., 1998; Miller et al., 2007). Moreover, the coherence of corticospinal gamma band (40–70 Hz) is tightly coupled with a readiness to action (Schoffelen, 2005). Hence, the high-frequency bands in the precentral motor area might be directly involved in contralateral movements.
Our decoding analysis also demonstrated that the high-frequency bands in the precentral motor area are informative in predicting ipsilateral movement categories (Fig. 5B). The somatotopy and gamma-band synchronization between both the lateral motor cortices might induce different neural patterns for different ipsilateral movements. A previous fMRI study found a somatotopic organization associated with ipsilateral limbs (Hanakawa, 2005,) and both the lateral motor cortices are connected via the corpus callosum keeping the somatotopy (Wahl et al., 2007). In addition, the ipsilateral and contralateral motor cortices might interact with the high-frequency band since gamma-band synchronization might be the basis for neuronal communication over different cortical areas (Fries, 2005). The hypothesis of interhemispheric interaction might be supported by phase-locking of the high gamma bands between contra- and ipsilateral motor areas (Darvas et al., 2010). This interhemispheric interaction might result in significant decoding performance in cross-decoding (Fig. 6) and high similarity in activity patterns (Fig. 7) across contra- and ipsilateral movements. Further studies that simultaneously record (e.g. simultaneous neural record on separated areas in the monkey electrophysiology [Smith and Kohn, 2008]) in both hemispheres might provide answers to this question.
19
The decoding result of S1 concerning contralateral movements is plausible because of the somatotopic sensory feedback that accompanies movements. The activity in S1 during ipsilateral movements might come from interhemispheric connection. Tactile stimuli applied to fingers activate the contralateral S1 and deactivate the ipsilateral S1 (Hlushchuk and Hari, 2006), while stimulation of the direct ascending pathway hardly generates any change in activity in the ipsilateral S1 (Kanno et al., 2003). This evidence suggests that the sensory feedback during ipsilateral movements might only indirectly reach S1 via the corpus callosum. This indirect pathway might result in the asymmetric generalization property in S1, unlike that in the motor area (Fig. 6).
The SMA is also somatotopically organized (Mitz and Wise, 1987), and is known as an area specialized for bilateral limb movements (Brinkman, 1984). The significant decoding accuracies for contra- and ipsilateral movements (Fig. 5), and generalizations across both contra- and ipsilateral movements (Fig. 6) are congruent with these previous findings.
4.2 Role of the neural representation of ipsilateral movement The role of ipsilateral activity in the recovery of motor function after injury has been reported in clinical studies (Johansen-Berg et al., 2002; Lotze, 2006; Gerloff, 2006), and a healthy-subject study in which the motor cortex was inhibited by TMS, found similar results (Strens et al., 2003). Within the role of voluntary movements, the M1 activity for ipsilateral movements might contribute towards the coordination of bilateral movements (Donchin et al., 1998). The corticospinal pathways from M1 and PM are directly connected to the ipsilateral ventral horn in the spinal cord (Dum and Strick, 1991; 1996), and this pathway might have almost no role in ipsilateral movements, instead might be involved in bilateral movements. Evidence for this comes from damage to the descending contralateral pathway, which results in impairment of bilateral movements (Shelton and Reding, 2001). The functional role of ipsilateral cortical
20
activity in unilateral voluntary movements is also becoming clear. Ipsilateral cortical activity is required for precise control of the force (Ehrsson et al., 2000; 2001) and timing (Verstynen, 2004; Davare et al., 2006) of contralateral movements. The high-frequency band activity of ipsilateral movements (Fig. 5) might enhance the accuracy of contralateral movements. The ipsilateral activity of SMA might be related to intermanual transfer, that is, motor skills learned using one-hand transfer to the other hand. Motor sequence learning by the unilateral hand activates the bilateral SMAs (Grafton et al., 1995), and the learned sequence is transferred to the contralateral hand without additional learning (Grafton et al., 2002). The role of SMA in intermanual transfer was more directly examined by inhibition of SMA using TMS, which disrupted intermanual transfer (Perez et al., 2007). The activity patterns of SMA during ipsilateral movements, which were similar to those of contralateral movements (Fig. 6), might contribute to interhemispheric motor learning.
Interhemispheric inhibition of the motor cortex has been studied with TMS (Ferbert et al., 1992; Meyer et al., 1995; Daskalakis et al., 2004). Inhibition from the contralateral to the ipsilateral motor cortex reduces mirror movements (unintended movements of ipsilateral limb associated with contralateral voluntary movements; Mayston et al., 1999; Arányi and Rösler, 2002). Inhibition from the ipsilateral to the contralateral motor cortex is known to be involved in suppression of excessive contralateral activity (Kobayashi, 2003) and dexterity of movements (Duque et al., 2007). The relationship between interhemispheric inhibition and similarity of brain activity patterns in the bilateral motor areas, as revealed by generalization of the decoder, remains unclear. A more sophisticated data analysis separating mixed patterns of contra- and ipsilateral activities in one hemisphere is needed to solve this clinically important issue.
Acknowledgments
21
This work was supported in part by Grants-in-Aid for Scientific Research on Innovative Areas (15H01664, 15H05871, 15H05874, 15H05875, 15H05880), Grants-in-Aid for Scientific Research (B) (15H03044, 26282218) and (C) (15K10361) from the Japan Society for the Promotion of Science, a research grant (2736040, 27280201, 2736040) from the Japan Agency for Medical Research and development (AMED) and a research grant (2015) from the Brain Science Foundation. Y. F. was supported by Grant-in-Aid for Young Scientists (B) (26750386) from the Japan Society for the Promotion of Science and a contract with the National Institute of Information and Communications Technology entitled, “Development of network dynamics modeling methods for human brain data simulation systems”. We thank O. Yamashita and two anonymous reviewers for helpful comments.
References Arányi, Z., Rösler, K.M., 2002. Effort-induced mirror movements. A study of transcallosal inhibition in humans. Exp. Brain Res. 145, 76–82. Ball, T., Demandt, E., Mutschler, I., Neitzel, E., Mehring, C., Vogt, K., Aertsen, A., Schulze-Bonhage, A., 2008. Movement related activity in the high gamma range of the human EEG. NeuroImage 41, 302–310. Ball, T., Schulze-Bonhage, A., Aertsen, A., Mehring, C., 2009. Differential representation of arm movement direction in relation to cortical anatomy and function. J. Neural Eng. 6, 016006–16. Bradberry, T.J., Gentili, R.J., Contreras-Vidal, J.L., 2010. Reconstructing three-dimensional hand movements from noninvasive electroencephalographic signals. J. Neurosci. 30, 3432– 3437. Brinkman, C., 1984. Supplementary motor area of the monkey's cerebral cortex: short- and long-term deficits after unilateral ablation and the effects of subsequent callosal section. J. Neurosci. 4, 918–929. Bundy, D.T., Wronkiewicz, M., Sharma, M., Moran, D.W., Corbetta, M., Leuthardt, E.C., 2012. Using ipsilateral motor signals in the unaffected cerebral hemisphere as a signal platform for brain–computer interfaces in hemiplegic stroke survivors. J. Neural Eng. 9, 036011–23.
22
Chang, C.C., Lin, C.J., 2011. LIBSVM: A library for support vector machines. ACM Transactions on Intelligent Systems and Technology (TIST) 2, 27–27. Cheyne, D., Bells, S., Ferrari, P., Gaetz, W., Bostan, A.C., 2008. Self-paced movements induce high-frequency gamma oscillations in primary motor cortex. NeuroImage 42, 332–342. Cisek, P., Crammond, D.J., Kalaska, J.F., 2003. Neural activity in primary motor and dorsal premotor cortex in reaching tasks with the contralateral versus ipsilateral arm. J. Neurophysiol. 89, 922–942. Cramer, S.C., Finklestein, S.P., Schaechter, J.D., Bush, G., Rosen, B.R., 1999. Activation of Distinct Motor Cortex Regions During Ipsilateral and Contralateral Finger Movements. J. Neurophysiol. 81, 383–387. Crone, N.E., Miglioretti, D.L., Gordon, B., Lesser, R.P., 1998. Functional mapping of human sensorimotor cortex with electrocorticographic spectral analysis. II. Event-related synchronization in the gamma band. Brain 121 ( Pt 12), 2301–2315. Darvas, F., Scherer, R., Ojemann, J.G., Rao, R.P., Miller, K.J., Sorensen, L.B., 2010. High gamma mapping using EEG. NeuroImage 49, 930–938. Daskalakis, Z.J., Christensen, B.K., Fitzgerald, P.B., Roshan, L., Chen, R., 2004. The mechanisms of interhemispheric inhibition in the human motor cortex. J. Physiol. 543, 317–326. Davare, M., Duque, J., Vandermeeren, Y., Thonnard, J.-L., Olivier, E., 2006. Role of the Ipsilateral Primary Motor Cortex in Controlling the Timing of Hand Muscle Recruitment. Cereb. Cortex 17, 353–362. Diedrichsen, J., Wiestler, T., Krakauer, J.W., 2013. Two Distinct Ipsilateral Cortical Representations for Individuated Finger Movements. Cereb. Cortex 23, 1362–1377. Donchin, O., Gribova, A., Steinberg, O., Bergman, H., 1998. Primary motor cortex is involved in bimanual coordination. Nature 395, 274–278. Dum, R.P., Strick, P.L., 1996. Spinal cord terminations of the medial wall motor areas in macaque monkeys. J. Neurosci. 16, 6513–6525. Dum, R.P., Strick, P.L., 1991. The origin of corticospinal projections from the premotor areas in the frontal lobe. J. Neurosci. 11, 667-689. Duque, J., Murase, N., Celnik, P., Hummel, F., Harris-Love, M., Mazzocchio, R., Olivier, E., Cohen, L.G., 2007. Intermanual Differences in Movement-related Interhemispheric Inhibition. J. Cogn. Neurosci. 19, 204–213.
23
Ehrsson, H.H., Fagergren, A., Jonsson, T., Westling, G., Johansson, R.S., Forssberg, H., 2000. Cortical activity in precision- versus power-grip tasks: an fMRI study. J. Neurophysiol. 83, 528–536. Ehrsson, H.H., Fagergren, E., Forssberg, H., 2001. Differential fronto-parietal activation depending on force used in a precision grip task: an fMRI study. J. Neurophysiol. 85, 2613– 2623. Fan, R.E., Chang, K.W., Hsieh, C.J., Wang, X.R., Lin, C.J., 2008. LIBLINEAR: A Library for Large Linear Classification. J. Machine Learning Res. 9, 1871–1874. Ferbert, A., Priori, A., Rothwell, J.C., Day, B.L., Colebatch, J.G., Marsden, C.D., 1992. Interhemispheric inhibition of the human motor cortex. J. Physiol. 453, 525–546. Fried, I., Katz, A., McCarthy, G., Sass, K.J., Williamson, P., Spencer, S.S., Spencer, D.D., 1991. Functional organization of human supplementary motor cortex studied by electrical stimulation. J. Neurosci. 11, 3656–3666. Fries, P., 2005. A mechanism for cognitive dynamics: neuronal communication through neuronal coherence. Trends Cogn. Sci. 9, 474–480. Gerloff, C., 2006. Multimodal imaging of brain reorganization in motor areas of the contralesional hemisphere of well recovered patients after capsular stroke. Brain 129, 791– 808. Grafton, S.T., Hazeltine, E., Ivry, R., 1995. Functional mapping of sequence learning in normal humans. J. Cogn Neurosci. 7, 497–510. Grafton, S.T., Hazeltine, E., Ivry, R.B., 2002. Motor sequence learning with the nondominant left hand. Exp. Brain Res. 146, 369–378. Haar, S., Donchin, O., Dinstein, I., 2015. Dissociating Visual and Motor Directional Selectivity Using Visuomotor Adaptation. J. Neurosci. 35, 6813–6821. Hanakawa, T., 2005. Finger and Face Representations in the Ipsilateral Precentral Motor Areas in Humans. J. Neurophysiol. 93, 2950–2958. Hlushchuk, Y., Hari, R., 2006. Transient suppression of ipsilateral primary somatosensory cortex during tactile finger stimulation. J. Neurosci. 26, 5819–5824. Hotson, G., Fifer, M.S., Acharya, S., Benz, H.L., Anderson, W.S., Thakor, N.V., Crone, N.E., 2014. Coarse Electrocorticographic Decoding of Ipsilateral Reach in Patients with Brain Lesions. Plos One 9, e115236–20. Johansen-Berg, H., Rushworth, M.F.S., Bogdanovic, M.D., Kischka, U., Wimalaratna, S., Matthews, P.M., 2002. The role of ipsilateral premotor cortex in hand movement after stroke. Proc. Natl .Acad. Sci . USA 99, 14518–14523.
24
Jurkiewicz, M.T., Gaetz, W.C., Bostan, A.C., Cheyne, D., 2006. Post-movement beta rebound is generated in motor cortex: Evidence from neuromagnetic recordings. NeuroImage 32, 1281–1289. Kamitani, Y., Tong, F., 2005. Decoding the visual and subjective contents of the human brain. Nat. Neurosci. 8, 679–685. Kanno, A., Nakasato, N., Hatanaka, K., Yoshimoto, T., 2003. Ipsilateral Area 3b Responses to Median Nerve Somatosensory Stimulation. NeuroImage 18, 169–177. Kawashima, R., Matsumura, M., Sadato, N., Naito, E., Waki, A., Nakamura, S., Matsunami, K., Fukuda, H., Yonekura, Y., 1998. Regional cerebral blood flow changes in human brain related to ipsilateral and contralateral complex hand movements–a PET study. Eur. J. Neurosci. 10, 2254–2260. Killackey, H.P., Gould, H.J., Cusick, C.G., Pons, T.P., Kaas, J.H., 1983. The relation of corpus callosum connections to architectonic fields and body surface maps in sensorimotor cortex of new and old world monkeys. J. Comp. Neurol. 219, 384–419. Kim, S.G., Ashe, J., Hendrich, K., Ellermann, J.M., Merkle, H., Ugurbil, K., Georgopoulos, A.P., 1993. Functional magnetic resonance imaging of motor cortex: hemispheric asymmetry and handedness. Science 261, 615–617. Kobayashi, M., 2003. Ipsilateral motor cortex activation on functional magnetic resonance imaging during unilateral hand movements is related to interhemispheric interactions. NeuroImage 20, 2259–2270. Kubánek, J., Miller, K.J., Ojemann, J.G., Wolpaw, J.R., Schalk, G., 2009. Decoding flexion of individual fingers using electrocorticographic signals in humans. J. Neural Eng. 6, 066001. Leuthardt, E.C., Schalk, G., Wolpaw, J.R., Ojemann, J.G., Moran, D.W., 2004. A brain– computer interface using electrocorticographic signals in humans. J. Neural Eng. 1, 63–71. Liu, Y., Sharma, M., Gaona, C., Breshears, J., 2010. Decoding ipsilateral finger movements from ecog signals in humans. Advances in Neural Information Processing Systems (NIPS) 22. Lotze, M., 2006. The Role of Multiple Contralesional Motor Areas for Complex Hand Movements after Internal Capsular Lesion. J. Neurosci. 26, 6096–6102. Lotze, M., Erb, M., Flor, H., Huelsmann, E., Godde, B., Grodd, W., 2000. fMRI Evaluation of Somatotopic Representation in Human Primary Motor Cortex. NeuroImage 11, 473–481. Luders, H., 1987. Commentary: chronic intracranial recording and stimulation with subdural electrodes. Surgical treatment of the epilepsies.
25
Matsumoto, R., Nair, D.R., LaPresto, E., Bingaman, W., Shibasaki, H., Lüders, H.O., 2007. Functional connectivity in human cortical motor system: a cortico-cortical evoked potential study. Brain 130, 181–197. Matsunami, K., Hamada, I., 1981. Characteristics of the ipsilateral movement-related neuron in the motor cortex of the monkey. Brain Res. 204, 29–42. Mayston, M.J., Harrison, L.M., Stephens, J.A., 1999. A neurophysiological study of mirror movements in adults and children. Ann. Neurol. 45, 583–594. Meyer, B.U., Röricht, S., Gräfin von Einsiedel, H., Kruggel, F., Weindl, A., 1995. Inhibitory and excitatory interhemispheric transfers between motor cortical areas in normal humans and patients with abnormalities of the corpus callosum. Brain 118 ( Pt 2), 429–440. Miller, K.J., Leuthardt, E.C., Schalk, G., Rao, R.P.N., Anderson, N.R., Moran, D.W., Miller, J.W., Ojemann, J.G., 2007. Spectral Changes in Cortical Surface Potentials during Motor Movement. J. Neurosci. 27, 2424–2432. Miller, K.J., Schalk, G., Fetz, E.E., Nijs, den, M., Ojemann, J.G., Rao, R.P.N., 2010. Cortical activity during motor execution, motor imagery, and imagery-based online feedback. Proc. Natl. Acad. Sci. USA 107, 4430–4435. Miller, K.J., Zanos, S., Fetz, E.E., Nijs, den, M., Ojemann, J.G., 2009. Decoupling the Cortical Power Spectrum Reveals Real-Time Representation of Individual Finger Movements in Humans. J. Neurosci. 29, 3132–3137. Mitz, A.R., Wise, S.P., 1987. The somatotopic organization of the supplementary motor area: intracortical microstimulation mapping. J. Neurosci. 7, 1010-1021. Ohara, S., 2000. Movement-related change of electrocorticographic activity in human supplementary motor area proper. Brain 123, 1203–1215. Pasley, B.N., David, S.V., Mesgarani, N., Flinker, A., Shamma, S.A., Crone, N.E., Knight, R.T., Chang, E.F., 2012. Reconstructing Speech from Human Auditory Cortex. Plos Biol. 10, e1001251. Perez, M.A., Tanaka, S., Wise, S.P., Sadato, N., Tanabe, H.C., Willingham, D.T., Cohen, L.G., 2007. Neural Substrates of Intermanual Transfer of a Newly Acquired Motor Skill. Current Biology 17, 1896–1902. Pfurtscheller, G., Lopes da Silva, F.H., 1999. Event-related EEG/MEG synchronization and desynchronization: basic principles. Clinical Neurophysiol. 110, 1842–1857. Pistohl, T., Schulze-Bonhage, A., Aertsen, A., Mehring, C., Ball, T., 2012. Decoding natural grasp types from human ECoG. NeuroImage 59, 248–260.
26
Salmelin, R., Forss, N., Knuutila, J., Hari, R., 1995a. Bilateral activation of the human somatomotor cortex by distal hand movements. Electroencephalogr Clin. Neurophysiol. 95, 444–452. Salmelin, R., Hämäläinen, M., Kajola, M., Hari, R., 1995b. Functional segregation of movement-related rhythmic activity in the human brain. NeuroImage 2, 237–243. Scherer, R., Zanos, S.P., Miller, K.J., Rao, R.P.N., Ojemann, J.G., 2009. Classification of contralateral and ipsilateral finger movements for electrocorticographic brain-computer interfaces. Neurosurg Focus. 27, E12. Schoffelen, J.M., 2005. Neuronal Coherence as a Mechanism of Effective Corticospinal Interaction. Science 308, 111–113. Shelton, F.N., Reding, M.J., 2001. Effect of lesion location on upper limb motor recovery after stroke. Stroke 32, 107–112. Shibasaki, H., Kato, M., 1975. Movement-associated cortical potentials with unilateral and bilateral simultaneous hand movement. J. Neurol. 208, 191–199. Smith, M.A., Kohn, A., 2008. Spatial and temporal scales of neuronal correlation in primary visual cortex. J. Neurosci. 28, 12591–12603. Stokes, M., Thompson, R., Cusack, R., Duncan, J., 2009. Top-down activation of shape-specific population codes in visual cortex during mental imagery. J. Neurosci. 29, 1565–1572. Strens, L.H.A., Fogelson, N., Shanahan, P., Rothwell, J.C., Brown, P., 2003. The Ipsilateral Human Motor Cortex Can Functionally Compensate for Acute Contralateral Motor Cortex Dysfunction. Current Biology 13, 1201–1205. Tanji, J., Okano, K., Sato, K.C., 1988. Neuronal activity in cortical motor areas related to ipsilateral, contralateral, and bilateral digit movements of the monkey. J. Neurophysiol. 60, 325–343. Taylor, D.M., Tillery, S.I.H., Schwartz, A.B., 2002. Direct cortical control of 3D neuroprosthetic devices. Science 296, 1829–1832. Tazoe, T., Perez, M.A., 2014. Selective Activation of Ipsilateral Motor Pathways in Intact Humans. J. Neurosci. 34, 13924–13934. Toma, K., Matsuoka, T., Immisch, I., Mima, T., Waldvogel, D., Koshy, B., Hanakawa, T., Shill, H., Hallett, M., 2002. Generators of Movement-Related Cortical Potentials: fMRI-Constrained EEG Dipole Source Analysis. NeuroImage 17, 161–173. Verstynen, T., 2004. Ipsilateral Motor Cortex Activity During Unimanual Hand Movements Relates to Task Complexity. J. Neurophysiol. 93, 1209–1222.
27
Wahl, M., Lauterbach-Soon, B., Hattingen, E., Jung, P., Singer, O., Volz, S., Klein, J.C., Steinmetz, H., Ziemann, U., 2007. Human Motor Corpus Callosum: Topography, Somatotopy, and Link between Microstructure and Function. J. Neurosci. 27, 12132– 12138. Yamashita, O., Sato, M.-A., Yoshioka, T., Tong, F., Kamitani, Y., 2008. Sparse estimation automatically selects voxels relevant for the decoding of fMRI activity patterns. NeuroImage 42, 1414–1429. Yanagisawa, T., Hirata, M., Saitoh, Y., Goto, T., Kishima, H., Fukuma, R., Yokoi, H., Kamitani, Y., Yoshimine, T., 2011. Real-time control of a prosthetic hand using human electrocorticography signals. J. Neurosurg. 114, 1715–1722. Yanagisawa, T., Hirata, M., Saitoh, Y., Kato, A., Shibuya, D., Kamitani, Y., Yoshimine, T., 2009. Neural decoding using gyral and intrasulcal electrocorticograms. NeuroImage 45, 1099–1106. Zarei, M., Johansen-Berg, H., Smith, S., Ciccarelli, O., Thompson, A.J., Matthews, P.M., 2006. Functional anatomy of interhemispheric cortical connections in the human brain. J. Anatomy 209, 311–320.
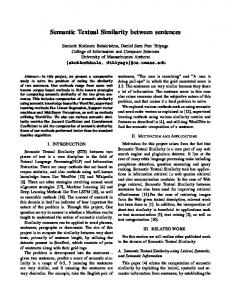
Figure 1. Location of ECoG electrodes and results of functional electric stimulation. White and colored circles indicate the locations of electrodes. The precentral motor area (M1+PM; red), S1 (blue), SMA including the lower limb area of M1 (purple), and NMA (dark green) were identified by electric stimulation. The location of a lesion is indicated by an orange area. The central sulcus (CS) is marked by a black line. The electrodes (each one on M1+PM and S1), whose cortical potential time courses related to movement are shown in Fig. 2, are indicated by arrows on Patient 3.
Figure 2. EMGs and movement-related cortical potentials (MRCPs) during contra- and ipsilateral movements. Top, middle, and bottom rows are wrist (ECR), shoulder (DEL) and ankle (TA) movements, respectively (Patient 3). (A) Bilateral EMGs during ipsilateral
28
movements. The EMGs of all trials are overlaid for each movement. Note that the y-axis scale of contralateral EMGs is 50 times that of ipsilateral EMGs. (B) Examples of MRCPs in M1+PM and S1. Electrode locations are indicated by arrows in Fig. 1. Solid line is the trial-averaged potential, and Shaded area is the 95% confidence interval. The time of 0 s represents movement onset. (C) Trial-averaged time lags of peak amplitudes of MCRPs. Error bars are the 95% confidence intervals across trials.
Figure 3. Power spectrum of ECoG signals during contra- and ipsilateral movements in M1+PM. (A) Trial-averaged spectrograms of a representative channel on M1+PM during shoulder movements, aligned to movement onset (0 s), and normalized by signals before movement onset (–3 to –2 s). Upper and lower panels are spectrograms of contra- and ipsilateral movements respectively. (B) Comparison of amplitudes of the 4 components: high-frequency band (64–120 Hz, red); middle-frequency band (14–40 Hz, yellow); low-frequency band (2–8 Hz, green); low-pass filtered signals (< 5 Hz, blue, shown as Low). The amplitudes of these components were calculated from data after movement onset (0–0.5 s), and an across-electrode average in M1+PM (3 patient-pooled) was obtained. An asterisk indicates statistical significance (paired t-test, p < 0.01). (C) Comparison of the amplitudes of the 3 movement categories (wrist, shoulder, and ankle, three patient-pooled). The amplitudes of contra- and ipsilateral movements in (B) were sorted into the 3 movement categories and plotted for each frequency component. An asterisk indicates a significant difference between average amplitudes of 2 movement categories (ANOVA, p < 0.01, Bonferroni corrected for multiple comparisons). Error bars represent the 95% confidence intervals across electrodes.
29
Figure 4. Decoding results using all components (64–120 Hz, 14–40 Hz, 2–8 Hz, and low-pass filtered signal: Low) in all ROIs. The feature values were calculated from ECoG signals during 0.5 s after movement onset. (A) Decoding results within contra- or ipsilateral movements. Top raw: decoding accuracy (left, middle and right bars correspond to Patients 1, 2 and 3 respectively). Horizontal lines are the chance level (50% for Patients 1 and 2, 33% for Patient 3). Middle row: the area under the ROC curve (AUC) of Patients 1 and 2. Bottom row: confusion matrix of Patient 3. Columns are the actual movements (wrist, shoulder, and ankle from the left), and rows are the predicted movements (wrist, shoulder, and ankle from the top). (B) Results of cross-decoding between contra- and ipsilateral movements. Left: the decoder trained on the data during ipsilateral movements was tested on the data from contralateral movements. Right: the decoder trained on the data during contralateral movements was tested on the data from ipsilateral movements. An asterisk indicates classifications significantly above the chance level (permutation test, p < 0.01). (C) Norms of decoder weights. The averaged norm across electrodes for each component in each ROI was plotted.
Figure 5. Decoding results within contra- and ipsilateral movements. The decoding accuracies were separately evaluated for the 4 components (64–120 Hz, 14–40 Hz, 2–8 Hz, and low-pass filtered signals: Low) in each area. In M1+PM and S1, decoding analysis was conducted for all 3 patients. In SMA and NMA, decoding analysis was conducted only for Patients 1 and 2 respectively. (A) Decoding results of contralateral movements. Top row: decoding accuracy (left, middle, and right bars correspond to Patients 1, 2, and 3 respectively, in each component). Horizontal lines are the chance level (50% for Patients 1 and 2, 33% for Patient 3). Middle row: the area under the ROC curve (AUC) of Patients 1 and 2. Bottom row: confusion matrix of Patient 3. Columns are the actual movements (wrist, shoulder, and ankle from the left), and rows are the predicted movements (wrist, shoulder, and ankle from the top). (B) Decoding
30
results of ipsilateral movements. An asterisk indicates classifications significantly above the chance level (permutation test, p < 0.01).
Figure 6. Results of cross-decoding between contra- and ipsilateral movements. The decoding accuracies were separately evaluated for the 4 components (64–120 Hz, 14–40 Hz, 2–8 Hz, and low-pass filtered signals: Low) in each area. In M1+PM and S1, decoding analysis was conducted for all 3 patients. In SMA and NMA, decoding analysis was conducted only for Patients 1 and 2 respectively. (A) The decoder trained on the data during ipsilateral movements was tested on the data from contralateral movements. (B) The decoder trained on the data during contralateral movements was tested on the data from ipsilateral movements. Horizontal lines are the chance level. An asterisk indicates classifications significantly above the chance level (permutation test, p < 0.01). The figure format is same as Fig. 5.
Figure 7. Spatial correlations of the 4 components (64–120 Hz, 14–40 Hz, 2–8 Hz, and low-pass filtered signal: Low) between contra- and ipsilateral movements during 0.5 s after movement onset. (A) The average spatial correlation (movement categories and patient-pooled, n = 7) for M1+PM. (B) The average spatial correlation (movement categories and patient-pooled, n = 7) for S1. Error bars indicate the 95% confidence interval. Significant difference of the average correlation coefficient above 0 was evaluated by t-test. *p < 0.01, **p < 0.001. The difference between the 4 components was tested by ANOVA in each area. A dagger indicates a significant difference between two components (paired t-test, p < 0.05, false discovery rate corrected for multiple comparisons).
Table 1. Number of electrodes in each area
31
P1
P2
P3
M1+PM
7
7
18
S1
5
7
9
SMA+M1 (lower limb)
4
0
0
NMA
0
8
2*
The asterisks indicate the electrodes not used in the decoding analysis.
Highlights
Ipsilateral movements can be decoded from the high-frequency band of ECoG.
The decoder is generalized across ipsi- and contralateral movements.
Similar activity patterns arise in both ipsi- and contralateral movements.
32