Network monitoring systems supervise the traffic in computer networks and ... traffic visualization also includes the application of a visualization tool for intrusion.
Neural Projection Techniques for the Visual Inspection of Network Traffic Álvaro Herrero1, Emilio Corchado1, Paolo Gastaldo2, and Rodolfo Zunino2 1
Civil Engineering Department University of Burgos C/ Francisco de Vitoria s/n, 09006, Burgos, Spain Email: {ahcosio, escorchado}@ubu.es 2
Department of Biophysical and Electronic Engineering (DIBE) Genoa University Via Opera Pia 11a, 16145 Genoa, Italy Email: {paolo.gastaldo, rodolfo.zunino}@unige.it
Abstract A crucial aspect in network monitoring for security purposes is the visual inspection of the traffic pattern, mainly aimed to provide the network manager with a synthetic and intuitive representation of the current situation. Toward that end, neural projection techniques can map high-dimensional data into a low-dimensional space adaptively, for the user-friendly visualization of monitored network traffic. This work proposes two projection methods, namely, Cooperative Maximum Likelihood Hebbian Learning and Auto-Associative Back-Propagation networks, for the visual inspection of network traffic. This set of methods may be seen as a complementary tool in network security as it allows the visual inspection and comprehension of the traffic data internal structure. The proposed methods have been evaluated in two complementary and practical networksecurity scenarios: the on-line processing of network traffic at packet level, and the offline processing of connection records, e.g. for post-mortem analysis or batch investigation. The empirical verification of the projection methods involved two experimental domains derived from the standard corpora for evaluation of computer network intrusion detection: the MIT Lincoln Laboratory DARPA dataset. 1.
Introduction
Network monitoring systems supervise the traffic in computer networks and generate alerts, or trigger defensive actions, when suspect activities are detected. The traditional approach to intrusion prevention mostly entails two paradigms, namely, misuse intrusion 1
detection (MID) [5] and anomaly intrusion detection (AID) [28], but scientific issues remain open in the deployment and operation of those technologies. MID systems rely on a base of rules to discriminate normal traffic from known attack patterns, hence they require continuous updating; AID systems generate alerts when detecting ‘abnormal’ events that deviate from normal traffic distribution, hence they can support time-zero detection of novel attack strategies but may suffer from a relatively high rate of false positives [31]. Visual inspection of traffic patterns is an alternative and crucial aspect in network monitoring [6]. Visualization is a critical issue in the computer network defence environment, as it mainly aims to provide the network manager with a synthetic and intuitive representation of the current situation; as a result, several researches have recently applied information visualization to this challenging task [4, 13, 20, 23, 30, 39, 55]. Visualization techniques typically aim to make the available statistics from trafficmonitoring systems (IDSs, IPS’s) understandable in an interactive way, thus focusing on traffic data and not only on the network topology. However implemented, such a technology requires mapping high-dimensional feature data into a low-dimensional space for presentation. The baseline of the research presented in this work is that connectionist models can prove quite adequate for that purpose of traffic visualization through dimensionality reduction. The statistical technique of Principal Component Analysis (PCA) [21, 44] was applied as a dimensionality-reduction tool for visualization of network traffic in some previous works by other authors [64, 66]. In [64], network traffic is visualized through PCA, but attacks can not be distinguished from normal traffic. Furthermore, an explanation of the projection obtained by this technique is not yielded. On the other hand, [66] proposes the PCA-based visualization as a complementary tool to interpret the results obtained by a different statistical analysis. This PCA visualization, employing 12 packet features, does not allow the identification of attacks on its own. Previous work on traffic visualization also includes the application of a visualization tool for intrusion detection [67]. Although some attacks are visually identified in that work by combining visualization and fuzzy feature extraction, explanations about the projection technique and the identification process are not provided.
2
Neural models have already been applied to the empirical development of network systems for traffic monitoring, by using both supervised [2, 19, 34, 35, 36, 38, 41, 43, 46, 51, 53, 56, 57, 60, 62] and unsupervised methods [14, 24, 27, 37, 45, 50, 58, 61] for automated detection. The present study shows that neural paradigms can also effectively support visualization tasks in the field of network security and provide a proper explanation of the obtained traffic data behaviour. In the proposed framework, unsupervised neural projection techniques operate on a feature-space representation of unlabeled network traffic, and learn the significant patterns that support the distribution of normal traffic, whereas outliers mark abnormal events. Hence, the framework can eventually help the network manager to understand the internal structure and behaviour of the traffic data, subsequently allowing the identification of anomalous situations. Therefore, the key role of the neural components is to support an effective, two/three-dimensional representation of network traffic in an adaptive fashion. A connectionist approach appears consistent with the anomaly-detection problem setting, mainly because the system can learn the relationship between raw traffic and subsequent interpretation empirically and based on different statistical features. The crucial advantage is that the outlier-detection method does not require any a-priori analytical formulation of the underlying dynamical phenomenon. This work analyzes the properties of two neural projection paradigms for the visualization task, namely Auto-Associative Back-Propagation (AABP) networks [29], and Cooperative Maximum Likelihood Hebbian Learning (CMLHL) networks [8], comparing their results with those obtained by PCA and Linear Discriminant Analysis (LDA) [15]. The AABP approach stems from an unsupervised variant of Multi-Layer Perceptrons (MLPs) and operates as a ‘smart compression’ operator by implementing universal nonlinear approximations. The CMLHL extends the Maximum Likelihood Hebbian Learning (MLHL) [11, 18], which represents a neural implementation of Exploratory Projection Pursuit (EPP) [17, 22]. The experimental domain adopted to compare the performance of those projection paradigms involves two typical and complementary scenarios in practical networkmonitoring applications. On-line processing supports a continuous inspection of network progress at packet level; hence, anomaly detection can be said successful when
3
significant deviations from normality are represented consistently in a visual manner. Offline processing takes into account connection records, e.g. for post-mortem analysis or batch investigation, and therefore helps the analyst identify abnormal patterns for further analysis and defence deployment. This research shows that the CMLHL model and the AABP model provide effective techniques to address the two different applicative scenarios. CMLHL represents a reliable tool to work out independent factors in a dataset while preserving a global ordering (such as the temporal order) in the patterns; thus, such model can be profitably applied to on-line processing of network traffic. On the other hand, AABP provides a powerful technique to tackle applicative domains characterized by large datasets involving non-linear correlations between variables, such as the off-line processing of connection records. This paper is organized as follows: Section 2 introduces the AABP model and the CMLHL model, while Section 3 presents the proposed framework for visualization of monitored network traffic. Section 4 describes the datasets used in the experimental session, which were both derived from the well-known 1998 DARPA/MIT Lincoln Laboratory evaluation benchmark [63]. Experimental results are presented in Section 5, whereas the final section winds up the discussion by providing the conclusions and a number of proposals for future work.
4
2. 2.1
Neural projection techniques Auto-associative back-propagation networks for dimensionality reduction
Auto-Associative Back-Propagation (AABP) networks constitute an unsupervised variant of the general Multi-Layer Perceptron (MLP) model, which belongs to the feedforward class of neural networks [48]. The MLP model implements a stimulus-response behaviour by combining several layers of elementary units (neurons), which involve a simple, non-linear transformation of weighted inputs. A conventional MLP includes three layers (input, ‘hidden’ and output), and associates an input vector, x∈ℜD, with an output vector, y∈ℜQ, computed as: Nh D ⎡ ⎛ ⎞⎤ yq (x ) = wq′ , 0 + ∑ ⎢ wu′ ,q ⋅ σ ⎜ wu , 0 + ∑ wu ,k xk ⎟⎥; q = 1,..., Q u =1 ⎣ k =1 ⎝ ⎠⎦
(1)
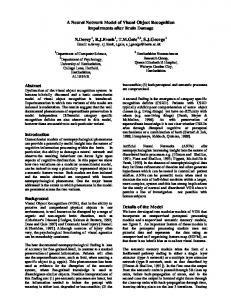
where σ() is the sigmoidal function, Nh is the depth of the sigmoid series expansion, and W represents the coefficients of the weights for the interconnections between the layers. Empirical fitting drives the weights, W, so that the network best reproduces (in a Euclidean sense) the desired mapping over a given training set. The network-training problem is tackled effectively by the Back-Propagation (BP) algorithm [48], which uses a stochastic gradient-descent strategy over the weight space. The AABP model changes the conventional MLP structure by forcing the desired outputs to coincide with the network inputs: t ≡ x (Figure 1). Forcing the network to replicate the training sample distribution mainly aims at a reduction in dimensionality, since the hidden layer is typically smaller than the input/output ones. At run-time, an AABP network is used to associate with each input vector the coding values computed by the hidden neurons; these ‘mapping outputs’ actually support the (lossy) transformation from the input space to a lower-dimensional representation. Theory proved [29] that a three-layer AABP network (Figure 1) supports a mapping that is affine (if not equivalent) to PCA [21, 44].
5
Fig. 1 A three-layer AABP network supports a lossy compression of input data.
Quite in view of this equivalence, it clearly appears that such a compression mapping might eventually suffer from the same drawbacks affecting PCA-like representations, the most prominent of which is a considerable sensitivity to the presence of outliers in the training set. It is indeed known that the eigenvectors induced by linear mappings can rotate significantly when the PCA-based training includes abnormal data points. That consideration, together with the ability of universal approximation theoretically ascribed to the Back-Propagation model [48], lead to a more sophisticated model of AABP networks, which anyway adhere to the basic principle of unsupervised training. The
Fig. 2 A NonLinear Auto-Associative Back-Propagation network includes five layers to reduce data dimensionality.
6
output layer still remaps the input vector values, and a hidden compression layer still supports a dimensionality reduction. The basic difference is in the compression and reconstruction sections, as both include an additional layer of neurons, thereby leading to a five-layer Auto-Associative network (Figure 2). The mapping supported by such architecture was called Non-Linear Principal Component Analysis (NLPCA) [29]. The run-time use of the resulting network, after training completion, is totally equivalent to the use of three-layer AABP networks: the output values of the coding layer (‘mapping outputs’) provide the low-dimensional representation of each input vector. The increase in representation power (and complexity) conveyed by the NLPCA augmentation is remarkable. The lower half of the network, also called the ‘compression section’, actually embeds a complete three-layer BP network, and therefore benefits from the universal capabilities predicted by theory [48]. The critical issue, of course, is that no one can know the proper target values that should be imposed to the compression layer of Nh units for a conventional BP training process. To work around that issue, NLPCA forces the network to reconstruct the original sample in the upper section, hence target values in the innermost layer are set implicitly. As a consequence, the ‘reconstruction’ section is symmetrical with respect to the compression section, in order to yield equivalent, universal (inverse) mapping capabilities. The crucial advantage is that the compressed representation is no longer linked to any linear model but stems from a universal internal representation, which is learned empirically. On the other hand, the complexity of the augmented model is apparent, and the weight-tuning process might turn out to be quite difficult due to the large number of free parameters. This possibly gives rise to the presence of local minima, especially when dealing with limited training sets, and optimized learning algorithms are often applied to tame training complexity [3]. In summary, NLPCA techniques seem to fit those domains for which 1) a nonlinear representation is required to best encompass the observed empirical phenomenon, and at the same time, 2) a considerable number of empirical samples is available. 2.2
Cooperative maximum likelihood hebbian learning model
7
The Cooperative Maximum Likelihood Hebbian Learning (CMLHL) model [8] extends the Maximum Likelihood Hebbian Learning (MLHL) [11, 18] model, which is based on Exploratory Projection Pursuit (EPP) [17, 22]. The statistical method of EPP was designed for solving the complex problem of identifying structure in high dimensional data by projecting it onto a lower dimensional subspace in which its structure is searched by eye. In order to do that, an “index” must be defined to measure the varying degrees of interest associated with each projection. Subsequently, the data is transformed by maximizing the index and the associated interest. From a statistical point of view the most interesting directions are those that are as non-Gaussian as possible. The MLHL model is based on the Negative Feedback Network and, as the AABP model; it associates an input vector, x∈ℜD, with an output vector, y∈ℜQ. In this case, the output of the network (y) is computed as: N
yi = ∑ Wij x j ,∀i
(2)
j =1
where W ij is the weight linking input j to output i . Once the output of the network has been calculated, the activation ( e j ) is fed back through the same weights and subtracted from the input: M
e j = x j − ∑ Wij yi , ∀j
(3)
i =1
Finally, the learning rule determines the way in which the weights are updated: ΔWij = η . yi .sign (e j ) | e j | p −1
(4)
where η is the learning rate and p is a parameter related to the energy function. The main difference between the basic MLHL model and its Cooperative version is the introduction of lateral connections. After the Feed forward step (Eq. 2) and before the Feed back step (Eq. 3), lateral connections between the output neurons are applied as follows: y i (t + 1) = [ y i (t) + τ (b − Ay )]
+
(5)
where τ is the “strength” of the lateral connections, b is the bias parameter and A is a symmetric matrix used to modify the response to the data [8]. Its effect is based on the relation between the distances among the output neurons.
8
3.
Neural projection techniques for network-traffic monitoring
3.1
A neural perspective for visual traffic monitoring
The visualization of traffic in computer networks typically aims to help network managers diagnose performance issues or understand communication patterns between nodes. The monitoring task for detecting intrusive or anomalous events can be achieved by visualizing data at different levels of abstraction: network topology, intrusion alerts, packet-level data, etc. The neural approach presented in this work applies projection techniques to the mapping of raw network-traffic data into a low-dimensional space for visual inspection. Network traffic is represented by a set of numerical features spanning a D-dimensional vector space. The neural component operates on such feature vectors and yields a two/three-dimensional representation of the observed traffic data. Eventually, the outcomes of this neural module are presented to the network manager in a “traffic display” device. Hence, the framework is designed to support integrated visualization systems for Computer Network Defense by providing an effective tool to analyze network traffic. The applicative domain involves two typical and complementary scenarios in network monitoring: on-line processing of network traffic proceeds at the packet level, and off-line processing takes into account traffic data summarized in connection records, e.g. for incident analysis. The former environment supports a continuous inspection of network progress by analyzing individual packets, which are intercepted by some network capture device. In this case, anomaly detection succeeds when significant deviations from normality are represented consistently in a visual manner in real (or almost real-) time. From a different perspective, the off-line processing approach performs intrusion detection in a batch environment to improve the accuracy and depth of the analysis. Information about the observed connections spans the space of network traffic representation and therefore helps the analyst to identify abnormal traffic patterns for further analysis and defence deployment.
9
3.2. AABP and CMLHL for dimensionality reduction Various dimensionality reduction techniques have been proposed in the literature [16]. Linear mapping methods do not yield satisfactory representations, as real data most often show nonlinear relationships that cannot be approximated accurately by linear methods [16]. Conversely, nonlinear methods for dimensionality reduction [12, 16, 25, 32, 40, 47, 49, 52, 54, 59] offer flexibility and effectiveness, although such techniques may bring about an additional complexity. In this regard, the present work exploits neural projection paradigms to achieve two crucial advantages. Firstly, a connectionist approach appears consistent with the anomaly-detection problem setting, mainly because it allows a system to empirically learn the input-output relationship between raw traffic and subsequent interpretation. The important advantage is that the eventual nonlinear mapping method does not require any a-priori analytical formulation of the underlying phenomenon. Secondly, neural projection models do not involve the complexity drawbacks that characterize the techniques based on the reliable Multidimensional Scaling (MDS) model [12], which in general require the computation of the complete distance matrix between pairs of data. This in turn represents a major issue when large datasets are involved.
Run-time operation algorithm of the CMLHL-based procedure 0. (Initialization) Inputs: random neural network weights (W) and parameters ( η , τ ,p) Time slot for visual update rate 1. For each time slot: a. Acquire traffic datum b. Extract numerical features from packet headers c. Associate with the packet datum a D-dimensional feature vector, x d. Feed the CMLHL network with vector x e. Register the mapping vector, y, spanned by the output-layer neurons f. Feed the visual interface to the network manager with vector y.
Fig. 3 The proposed on-line processing algorithm for packet-based data.
10
The CMLHL model and the AABP model represent two different implementations of the unsupervised neural projection paradigm. Indeed, they provide effective techniques to address the two applicative scenarios targeted by this research. CMLHL represents a reliable tool to work out independent factors in a dataset while preserving a global ordering in the patterns; thus, such model can be profitably applied to on-line processing of network traffic. The CMLHL model was initially applied to the field of artificial vision [8, 9] to identify local filters in space and time. It can also be successfully applied to a wide variety of problems as, by including lateral connections, it provides sparse projections that show the inner structure of datasets. As it is shown in Section 5, CMLHL successfully supports the on-line analysis of network data, identifying anomalies in a clearer way than any other of the tested and well-known projection techniques. Figure 3 gives an outline of the run-time operation of the CMLHL-based dimensionality reduction. On the other hand, the NLPCA architecture supported by AABP neural networks represents a nonlinear generalization of standard PCA. Thus, it provides a powerful technique to tackle applicative domains characterized by large datasets involving non-
Run-time operation algorithm of the AABP-based procedure 0. (Initialization) Inputs: neural network weights, W Time slot for visual update rate 1. For each time slot: a. Acquire traffic datum b. Extract numerical features c. Associate with the packet datum a D-dimensional feature vector, x d. Feed the AABP network with vector x e. Register the two-dimensional mapping vector, v, spanned by the middle-layer neurons f. Feed the visual interface to the network manager with vector v.
Fig. 4 The proposed run-time operation algorithm of the NLPCA-based dimensionality reduction.
11
linear correlations between variables, such as the off-line processing of connection records. According to the set-up discussed in Section 2.1, the dimensionality reduction module exploits NLPCA to generate a two-dimensional representation of the monitored traffic by starting from the D-dimensional space defined by the feature set. Thus, first a batch training phase uses the empirical dataset Ω = {x i ; i = 1,.., N Ω ; x i ∈ ℜ D } to set the configuration of weight quantities W for the neural network. Then, the eventual neural system is applied to process the feature vectors generated at run-time and to feed the visual display. Figure 4 gives an outline of the run-time operation of the NLPCA-based dimensionality reduction.
4.
Experimental domains
The experimental domains adopted to compare the performances of the two projection paradigms involved both of the scenarios discussed above in practical network monitoring applications, namely, on-line processing (packet level) and off-line processing (connection level). Additionally, PCA and LDA have been applied to these scenarios as a comparative study. The well-known DARPA intrusion detection dataset [63] provided the testbeds used in the experiments as it is still the reference network traffic dataset. The DARPA corpus was assembled in 1998 and 1999; it provided a standard to evaluate both false-alarm rates and detection rates of intrusion detection systems, including a variety of known and new attacks buried in a large amount of normal (‘background’) traffic. The corpus was collected from a simulation network that was used to automatically generate realistic traffic, including attempted attacks. The DARPA corpus provides a widely-used benchmark for intrusion detection evaluation on network traffic at the packet level. Furthermore, this corpus has been processed to generate a database of connection records, which was originally created for the Third International Knowledge Discovery and Data Mining Tools Competition [1] and widely known as the KDDCup’99 dataset. Hence, this research exploited the two databases to set up the experimental domains for the two different scenarios addressed in this work.
12
4.1
On-line processing of network traffic
Tests concerning on-line processing of traffic data involved a subset of the 1998 DARPA dataset. This subset contains 10 minutes of the traffic (3730 packets) captured on the Monday of the second week, including the portsweep attack generated on that day. In the DARPA documentation page [63], a portsweep attack is defined as a surveillance sweep through many ports to determine which services are supported on a single host. In this sample of portsweep attack, packets are sent from the host 192.168.1.10 to the 100 first port numbers of the host 172.16.114.50. As we are proposing an almost real-time processing of traffic for the on-line analysis, datasets longer than 10 minutes are not suitable due to the delay caused to the visualization of the traffic. In the present research, TCP (i.e. Transport Control Protocol) packets contained in this subset are characterized by using the set of features that already proved to be effective for the detection of anomalous SNMP traffic [10]. Only TCP traffic was selected from this dataset as most of the attacks (166 out of 174) contained in the 1998 DARPA corpus are based on this protocol. The set of five features that are extracted from the packet headers contribute to build up the neural-network input vector, x ∈ℜ5; these features can be listed as follows: •
Timestamp: the time when the packet was sent.
•
Source port: the port number of the device that sent the packet;
•
Destination port: the port number of the target host, i.e. the host to which the packet is sent;
•
Protocol ID: an integer number that identifies the protocol over TCP of the packet;
•
Size: the packet size (in Bytes); As such, the TCP network traffic is mapped in a five-dimensional feature space. By
summarizing packet information in this reduced set of features, the proposed framework is able to monitor high volume networks. On the other hand, as a result of using only packet header features, this framework is not able to identify attacks concerning the packet payload.
13
4.2
Off-line processing of network traffic
The experimental reference adopted for the off-line processing of connection records was originally created for the Third International Knowledge Discovery and Data Mining Tools Competition [1]. The KDDCup’99 dataset [1] originated from the 1998 DARPA Intrusion Detection Evaluation Program managed by MIT Lincoln Labs [33], with the objective to survey and evaluate research in intrusion detection. That work resulted in a reference set of data, including a wide variety of attacks, which had been simulated in a military network environment. The data spanned a 41-dimensional feature space; each pattern encompassed cumulative information about a connection session. In addition to “normal” traffic, attacks belonged to four principle macro-classes, namely, “DoS” (denial-of-service), “R2L” (unauthorized access from a remote machine), “U2R” (unauthorized access to local “super user” privileges), “probing” (surveillance and other probing such as port scanning). The complete training set contained about 5⋅106 patterns, covering 22 different types of attacks. Normal traffic represented about 20% of the whole dataset, while attack types were quite unbalanced, as just two classes (‘neptune’ and ‘smurf’) spanned 78% of the entire dataset. The pattern descriptors that took on categorical values, most notably “Protocol” and “Service”, were remapped into a numerical representation. “Protocol” could assume three different values (TCP, UDP, and ICMP) and was therefore encoded by a triplet of bits; each element of the triplet was associated to a protocol, and only one of those could be non-null. The “Service” descriptor took on eleven possible values, and was remapped accordingly into eleven mutually exclusive coordinates. In summary, the patterns forming the eventual dataset used in the experiments included 53-dimensional feature vectors. For simplicity, the experimental sessions in this research involved a smaller training set, provided by the KDDCup’99 benchmark, which had been obtained by subsampling original training data at a 10% rate. The resulting “10% training set” included 494,021 patterns and preserved the original proportions among the five principal macro-categories cited above. The test set provided by the KDD challenge contained 311,029 patterns, and featured 17 ‘novel’ attack schemes that were not covered by the training set.
14
5.
Experimental results
The experimental verification of the projection methods compared the performances of some projection models (CMLHL, NLPCA, PCA [21, 44] and LDA [15]) to analyse their response to the two datasets described above, fitting the proposed on-line/off-line analysis. This section contains some different projections, whose dimensions correspond to the outputs of the different applied projection models. Thus, the represented axes can be seen as combinations (linear or non-linear) of the features contained in the original datasets.
5.1
On-line traffic analysis
The CMLHL paradigm was tested by using the dataset described in Section 4.1. The dataset contained network packets captured from TCP traffic that were characterized by a feature set spanning a five-dimensional space, including time information plus Protocol ID, Source Port, Destination Port and Size.
Normal direction
Group 1
5.a Projection of the first two components of the whole dataset by CMLHL.
15
Normal direction
Group 1
5.b Zoomed portsweep attack (from Fig. 5.a). Fig. 5. CMLHL projections on the dataset involving on-line traffic analysis.
Figure 5 shows that the CMLHL projection manages to identify the anomalous situation contained in the dataset. The portsweep attack (Group 1 in Figures 5.a and 5.b) is identified due to their non-parallel evolution to the normal traffic. As it can be seen, normal traffic evolves in parallel straight lines (“normal direction” in Figures 5.a and 5.b), but the packets contained in these anomalous situation (Group 1) show a nonparallel evolution. This outcome shows the intrinsic robustness of CMLHL, which is able to respond properly to a complex dataset that includes time as a variable. For comparison purposes, well-known projection techniques, such as PCA [44, 21] and LDA [15], have been applied under the same framework. Figure 6 compares the projection obtained by PCA (Figure 6.a) and LDA (Figure 6.b).
16
Group 1
6.a PCA projection (through the 2 first principal components).
Group 1
6.b LDA projection Fig. 6 Comparative projections of PCA and LDA on the dataset involving on-line traffic analysis.
17
The PCA projection through the 2 first principal components (Figure 6.a) accounts for the 99.79% of the data variance and is not able to distinguish the portsweep attack (Group 1 in Figure 6.a) from normal traffic as some packets related to normal traffic are located in Group 1 as well. The “symmetry” of this projection is caused by the two-way (from source to destination and from destination to source) of most of the traffic. Figure 6.b presents the results obtained by applying LDA, which is a supervised statistical technique that maximizes the ratio of between-class variance to the within-class variance in the provided dataset, maximizing the separability of the data. Hence, class labels were assigned to packets contained in the analysed dataset in order to apply LDA. Figure 6.b shows that the LDA projection does not allow the identification of the portsweep attack, depicted in the same way as normal traffic. This validates the unsupervised approach for visual traffic inspection versus this supervised projection approach. Finally, a comparison between CMLHL and AABP is provided. It can be seen in Figure 5 how CMLHL is able to identify the anomalous situations included in the on-line dataset as it has been explained before. This outcome shows the intrinsic robustness of CMLHL, which is able to properly respond to a complex dataset that includes time as a variable. normal
attacks
800 600 400
v2
200 0 -200 -400 -600 -800
-600
-400
-200
0
v1 Fig. 7. AABP projection on the dataset involving on-line traffic analysis.
18
200
400
In the case of AABP (Figure 7), this issue is not clear at all when using the time as one of the input variables. Including a linear growing variable (time) forced the two inner neurons to learn a linear path. Furthermore, the projections do not allow to separate attacks from normal traffic. Thus, we can conclude that CMLHL performs better than the other 3 projection methods for the online analysis as it has managed to identify the anomalous situation existing in the analysed dataset based on the behaviour of the traffic data evolution. 5.2
Off-line traffic analysis
Connection-level traffic analysis tools (for example, in log-correlation applications) often aggregate statistical descriptions of the intervened exchanges but do not render the timing features of the completed traffic progression. Thus, a visualization tool for analyzing this data typically is expected to reproduce regular patterns in the traffic distribution and at the same time to highlight anomalies that can trigger peer investigations by the network manager. The AABP model can prove quite profitable toward that end, especially in view of its universal representation ability. In the experiments, the KDDCup’99 dataset was used to generate a reduced description of data, supported by 5 features of the original 53 descriptors explained in Section 4.2. These features were selected in accordance with previous results in the literature [27], which reported the best classification performance. The AABP network architecture featured a compression layer (and accordingly a reconstruction layer) including Nh = 5 neurons. These crucial values were set by using the classical, empirical criterion proposed in [48] in order to favour proper generalization performance. The actual projection test involved a two-/three-dimensional coding space in the middle layer of the AABP architecture.
19
The network was trained on the KDD 10% training dataset, then the trained networks were fed with the KDD test set, and weights were not allowed to change. The pair/triplet of output values from the coding layer were used for visualization in the two-/threedimensional graph. Figure 8 gives the obtained results for these two different projection configurations; the axes give the output values from the (innermost-layer) coding neurons. Each point in the graph represents a pattern of the KDD (test) dataset, whereas the marker at each point denotes whether the associate pattern originated from normal or malicious traffic. It is worth stressing that, in this case, using the macro-classes that characterized the original KDD datasets may not be very informative, as the test set included types and patterns of attacks that were not included in the training set, hence anomaly detection is more important than actual classification accuracy. This also seems consistent with the unsupervised nature of the overall approach. The graphs witness the intricate distribution of the KDD data, and also indirectly confirm the known complexity in the specific dataset; the original KDD statement reported that the test set was drawn from a different distribution with respect to the training set. Nevertheless, the projections allow assessing the effectiveness of the AABP unsupervised method: the two-dimensional graph (Figure 8.a) exhibits two main “patterns” (groups) of traffic, which are mostly consistent with the class distribution of
8.a two-dimensional projection
8.b three-dimensional projection
Fig. 8 AABP projections on the dataset involving off-line traffic analysis.
20
the patterns included in each group. A similar situation is obtained in Figure 8.b, where class separation (normal vs. attacks) is less evident. This can be possibly ascribed to the increased dimensionality in the projection space and the consequent increased complexity in separating patterns, also considering the unsupervised nature of the training process. However, the graph still confirms the existence of two main patterns of traffic data in the test set. The same datasets (both training and test) were mapped by using PCA and LDA projection methods. Figure 9.a gives a sample of a two-dimensional projection resulting from PCA; similar results were obtained with LDA and are reported in Figure 9.b.
9.a PCA projection of the offline analysis dataset
9.b LDA projection of the offline analysis dataset
Fig. 9 Comparative projections on the dataset involving off-line traffic analysis.
Finally, a comparison between AABP and CMLHL for off-line traffic analysis is provided. It can be seen in Figure 10 how CMLHL provides a more sparse projection than those obtained by PCA and LDA.
21
Fig. 10 CMLHL projection on the dataset involving off-line traffic analysis.
In all cases, the projection methods managed to indicate a two-tiered data distribution, although it seems that the associated groups did not render the underlying distributions of traffic classes, as normal and malicious traffic were mapped in an overlapped fashion. This seems to limit the effectiveness of those approaches detecting anomalies in a complex scenario.
6.
Conclusions
Traffic analysis in large networks is a complex task, mainly due to the intensity and the heterogeneous nature of the dynamic traffic phenomenon observed. Visualization tools can provide the network manager with automated support and motivate their effectiveness in the ability of the human eye to extrapolate normal traffic patterns and detect anomalies therein. Of course, the operational assumption of those approaches mainly consists in the ability to render the traffic distribution in a consistent yet lowdimensional
representation.
Hence,
visualization
tools
can
be
employed
as
complementary tools to other security mechanisms. The research presented in this paper shows that unsupervised models from Computational Intelligence enhance those compression and visualization tasks by their ability to learn empirical data distributions and perform pattern coding in a very efficient manner. Additionally, unsupervised learning does not require a labelled dataset as
22
supervised learning does. Thus, raw information extracted from the travelling packets is enough to train such models. This paper compared several methods for unsupervised adaptive compression toward that end, and distinguished the different operating scenarios that characterize a network manager’s reasoning, namely, on-line traffic inspection for early detection of anomalies, and off-line traffic pattern analysis for post-mortem or batch analysis. The basic scientific approach found two associated methods for implementation, i.e., Cooperative Maximum Likelihood Hebbian Learning and Auto-Associative BackPropagation networks. The presented results showed that those theoretical paradigms could support the compression (and subsequent visualization) task very effectively, as the methods managed to discriminate normal from anomalous traffic data with a satisfactory accuracy. The methods also compared favourably with respect to classical approaches to data compression such as Principal Component Analysis and Linear Discriminant Analysis. On the other hand, one cannot easily perform a fair comparison between the present framework and other visualization methods proposed in the literature. To the best of the authors’ knowledge, the projection on a two/three-dimensional space of the network traffic to support visualization has been slightly considered on previous works. Only PCA [64], [65] has been applied to this task, getting low-performance results. The experimental results contained in this work outperform the above mentioned, as the former are based on higher-order statistics. Furthermore, this work goes one step further, providing a detailed explanation about the way in which the anomalous situations are detected. Several researches have exploited connectionist paradigms to tackle the Intrusion-Detection task; however, those approaches did not target visualization. As a result, a proper comparison between the performance attained by the proposed research and those obtained by the IDS-oriented approaches cannot be provided. Then, this research line may be seen as an alternative and/or complementary tool under the frame of network security. Current lines of investigation in this area mainly address the implementation of the proposed neural models in embedded electronic systems for mission-critical appliances and the refinement of the proposed techniques to enhance accuracy and consistency in the
23
representation of the observed traffic. Additionally, the proposed framework is based on minimal traffic measurement [65]. Characterizing network packets by a reduced set of packet header features allows high-volume networks monitoring.
Acknowledgments. This research has been partially supported by the project BU006A08 of the JCyL.
References [1]
KDD Cup 1999 Intrusion detection dataset: http://kdd.ics.uci.edu/databases/kddcup99/kddcup99.html.
[2]
M.S. Abadeh, J. Habibi and C. Lucas, Intrusion detection using a fuzzy genetics-based learning algorithm, Journal of Network and Computer Applications 30(1) (2007) 414-428.
[3]
D. Anguita G.C. Parodi and R. Zunino, An efficient implementation of BP on RISC-based workstations, Neurocomputing 6 (1994) 57-65.
[4]
M. Ankerst, M. Ester and H.-P. Kriegel, Toward an effective cooperation of the user and the computer for classification, in: Proc. KDD 00, (ACM Press, 2000) 179-188.
[5]
R. Bace and P. Mell, Intrusion detection systems, NIST Special Publication on Intrusion Detection Systems, National Institute of Standards and Technology, 2001.
[6]
R.A. Becker, S.G. Eick and A.R. Wilks, Visualizing network data, IEEE Transactions on Visualization and Computer Graphics 1(1) (1995) 16-28.
[7]
Cisco Secure Consulting: Vulnerability statistics report, 2000.
[8]
E. Corchado and C. Fyfe, Connectionist techniques for the identification and suppression of interfering underlying factors, Int. Journal of Pattern Recognition and Artificial Intelligence 17(8) (2003) 1447-1466.
[9]
E. Corchado, Y. Han and C. Fyfe, Structuring global responses of local filters using lateral connections, Journal of Experimental and Theoretical Artificial Intelligence, 15(4) (2003) 473-487.
[10] E. Corchado, A. Herrero and J.M. Sáiz, Detecting compounded anomalous SNMP situations using cooperative unsupervised pattern recognition, in: Proc. ICANN 2005, Lecture Notes in Computer Science, Vol. 3697(2) (Springer, Berlin, 2005) 905-910. [11] E. Corchado, D. MacDonald and C. Fyfe, Maximum and minimum likelihood hebbian learning for exploratory projection pursuit, Data Mining and Knowledge Discovery 8(3) (2004) 203-225. [12] T. F. Cox and M.A.A. Cox, Multidimensional Scaling (Chapman & Hall, 1994). [13] A.D. D'Amico, J.R. Goodall, D.R. Tesone and J.K. Kopylec, Visual discovery in computer network defense, IEEE Computer Graphics and Applications 27(5) (2007) 20–27. [14] E. Eskin, A. Arnold and M. Prerau, A geometric framework for unsupervised anomaly detection: Detecting intrusions in unlabeled data, in: Applications of Data Mining in Computer Security (Kluwer, 2002).
24
[15] R.A. Fisher, The use of multiple measurements in taxonomic problems, Annals of Eugenics, 7(2) (1936) 179-188. [16] I.K. Fodor, A survey of dimension reduction techniques, Technical Report, U.S. Department of Energy, Lawrence Livermore National Laboratory, 2002. [17] J. Friedman and J. Tukey, A projection pursuit algorithm for exploratory data analysis, IEEE Transaction on Computers, 23 (1974) 881-890. [18] C. Fyfe and E. Corchado, Maximum likelihood hebbian rules, in: Proc. ESANN 2002 (2002) 143-148. [19] G. Giacinto, R. Perdisci, M. Del Rio and F. Roli, Intrusion detection in computer networks by a modular ensemble of one-class classifiers, Information Fusion 9(1) (2008) 69-82. [20] J.R. Goodall, W.G. Lutters, P. Rheingans and A. Komlodi, Focusing on context in network traffic analysis, IEEE Computer Graphics and Applications 26(2) (2006) 72-80. [21] H. Hotelling, Analysis of a complex of statistical variables into principal components, Journal of Education Psychology 24 (1933) 417-444. [22] A. Hyvärinen, Complexity pursuit: separating interesting components from time series, Neural Computation, 13 (2001) 883-898. [23] T. Itoh, H. Takakura, A. Sawada, and K. Koyamada, Hierarchical visualization of network intrusion detection data, IEEE Computer Graphics and Applications 26(2) (2006) 40-47. [24] S.Y. Jiang, X. Song, H. Wang, J.J. Han and Q.H. Li, A clustering-based method for unsupervised intrusion detections, Pattern Recognition Letters 27(7) (2006) 802-810. [25] J. Karhunen and J. Joutsensalo, Generalization of principal component analysis, optimization problems, and neural networks, Neural Networks 8(4) (1995) 549–562. [26] H.G. Kayacik, A.N. Zincir-Heywood and M.I. Heywood, Selecting features for intrusion detection: a feature relevance analysis on KDD 99 intrusion detection datasets, in: Proc. Annual Conference on Privacy, Security and Trust (2005). [27] H.G. Kayacik, A.N. Zincir-Heywood and M.I. Heywood, A hierarchical SOM-based intrusion detection system, Engineering Applications of Artificial Intelligence 20(4) (2007) 439-451. [28] R.A. Kemmerer and G. Vigna, Intrusion detection: a brief history and overview, Computer, 35(4) (2002) 27-30. [29] M.A. Kramer, Nonlinear principal component analysis using autoassociative neural networks, AIChE Journal 37(2) 1991. [30] A. Kulsoom, C. Lee, G. Conti and J.A. Copeland, Visualizing network data for intrusion detection, in: Proc. Sixth Annual IEEE Information Assurance Workshop - Systems, Man and Cybernetics 2005 (2005) 100-108. [31] P. Laskov, P. Dussel, C. Schafer and K. Rieck, Learning intrusion detection: supervised or unsupervised?, in: Proc. ICIAP 2005, (2005) 50-57. [32] M. LeBlanc and R.J. Tibshirani, Adaptive principal surfaces, Journal of the American Statistical Association 89(425) (1994) 53–64. [33] W. Lee and S.J. Stolfo, Data mining approaches for intrusion detection, in: Proc. of the 7th USENIX Security Symp. (1998).
25
[34] W. Lee, S.J. Stolfo and K.W. Mok, Adaptive intrusion detection: a data mining approach, Artificial Intelligence Review, 14(6) (2000) 533-567. [35] Y. Li and L. Guo, An active learning based TCM-KNN algorithm for supervised network intrusion detection, Computers & Security 26(7-8) (2007) 459-467. [36] Y. Liao and V.R. Vemuri, Use of k-nearest neighbor classifier for intrusion detection, Comput. Security, 21(5) (2002) 439-44. [37] Y. Liu, K. Chen, X. Liao and W. Zhang, A genetic clustering method for intrusion detection, Pattern Recognition 37(5) (2004) 927-942. [38] G. Liu, Z. Yi and S. Yang, A hierarchical intrusion detection model based on the PCA neural networks, Neurocomputing 70(7-9) (2007) 1561-1568. [39] Y. Livnat, J. Agutter, S. Moon, R.F. Erbacher and S. Foresti, A visualization paradigm for network intrusion detection, in: Proc. IAW '05 (2005) 92-99. [40] D. Lowe and M.E. Tipping, Feed-forward neural networks and topographic mappings for exploratory data analysis, Neural Computing & Applications 4(2) (1996) 83–95. [41] R.A. Maxion and K.M.C. Tan, Benchmarking anomaly-base detection systems, in: Proc. 1st Int Conf. Dependable System and Networks, 623-630. [42] J.M. Myerson, Identifying enterprise network vulnerabilities, International Journal of Network Management 12(3) (2002) 135-144. [43] V. Nikulin, Threshold-based clustering with merging and regularization in application to network intrusion detection, Computational Statistics & Data Analysis, 51(2), (2006) 11841196. [44] K. Pearson, On lines and planes of closest fit to systems of points in space, Philosophical Magazine 2(6) (1901) 559-572. [45] L. Portnoy, E. Eskin and S.J. Stolfo, Intrusion detection with unlabeled data using clustering, in: Proc. ACM CSS Workshop on Data Mining Applied to Security (2001) 123– 130. [46] Y. Qiao, X.W. Xin, Y. Bin and S. Ge, Anomaly intrusion detection method based on HMM, Elect. Letters, 38(13) (2002) 663-664. [47] S.T. Roweis and L.K. Saul, Nonlinear dimensionality reduction by locally linear embedding, Science 290 (2000) 2323–2326. [48] D.E. Rumelhart, J.L. McClelland, Parallel distributed processing (MIT Press, Cambridge, MA, 1986). [49] J. W. Sammon, A nonlinear mapping for data structure analysis, IEEE Transactions on Computer C-18(5) (1969) 401–409. [50] S.T. Sarasamma and Q.A. Zhu, Min-max hyperellipsoidal clustering for anomaly detection in network security, IEEE Trans. SMC Part B 36(4) (2006) 887–901. [51] S.T. Sarasamma, Q.A. Zhu and J. Huff, Hierarchical Kohonen net for anomaly detection in network security, IEEE Trans. on SMC – part B: cybernetics, 35(2) (2005) 302- 312. [52] B. Scholkopf, A. Smola and K.R. Müller, Nonlinear component analysis as a kernel eigenvalue problem, Neural Computation 10(5) (1998) 1299–1319.
26
[53] D. Song, M.I. Heywood, A.N. Zincir-Heywood, Training genetic programming on half a million patterns: an example from anomaly detection, IEEE Trans. Evolutionary Computation 9(3) (2005) 225–239. [54] J.B. Tenenbaum, V. de Silva and J.C. Langford, A global geometric framework for nonlinear dimensionality reduction, Science 290 (2000) 2319–2323. [55] S.T. Teoh, K.L. Ma, S.F. Wu and T.J. Jankun-Kelly, Detecting flaws and intruders with visual data analysis, IEEE Computer Graphics and Applications 24(5) (2004) 27–35. [56] A.N. Toosi and M. Kahani, A new approach to intrusion detection based on an evolutionary soft computing model using neuro-fuzzy classifiers, Computer Communications 30(10) (2007) 2201-2212. [57] C. Tsang, S. Kwong and H. Wang, Genetic-fuzzy rule mining approach and evaluation of feature selection techniques for anomaly intrusion detection, Pattern Recognition 40(9) (2007) 2373-2391. [58] N. Wu and J. Zhang, Factor-analysis based anomaly detection and clustering, Decision Support Systems 42(1) (2006) 375-389. [59] H. Yin, ViSOM - A novel method for multivariate data projection and structure visualization, IEEE Transactions on Neural Networks 13(1) (2002) 237–243. [60] C. Zhang, J. Jiang and M. Kamel, Intrusion detection using hierarchical neural networks, Pattern Recognition Letters 26(6) (2005) 779-791. [61] J. Zheng and M. Hu, An anomaly intrusion detection system based on vector quantization, IEICE Trans. Inf. & Syst. E89–D(1) (2006) 201-210. [62] Y. Zhenwei, J.J.P. Tsai and T. Weigert, An automatically tuning intrusion detection system, IEEE Transactions on Systems, Man and Cybernetics, Part B 37(2) (2007) 373– 384. [63] DARPA Intrusion Detection Evaluation, MIT Lincoln http://www.ll.mit.edu/mission/communications/ist/corpora/ideval/index.html
Laboratory.
[64] T., Goldring: Scatter (and Other) Plots for Visualizing User Profiling Data and Network Traffic. In: Proc. of the 2004 ACM Workshop on Visualization and Data Mining for Computer Security. ACM Press (2004) 119-123. [65] C., Taylor and J., Alves-Foss: NATE - Network Analysis of Anomalous Traffic Events, A Low-Cost Approach. New Security Paradigms Workshop. (2001) 89-96. [66] K., Labib and V. R., Vemuri: An Application of Principal Component Analysis to the Detection and Visualization of Computer Network Attacks. Annals of Telecommunications, Vol. 61(1-2), (2006) 218-234. [67] X., Jianqiang, J. E., Dickerson, and J. A. Dickerson: Fuzzy Feature Extraction and Visualization for Intrusion Detection. Proceedings of the 12th IEEE International Conference on Fuzzy Systems. Vol. 2, (2003) 1249-1254.
27