Tamkang University. Taipei, Taiwan. Taipei, Taiwan. Abstract. The ability to rapidly acquire synchronized phasor measurements from around the system open up ...
IEEE Transactions on Power Systems, Vol. 13, No. 2, May 1998
326
euro-Fuzzy Networks for Voltage Security Monitoring Based on Synchronized Phasor Measurements Chih-Wen Liu Chen-Sung Chang Department of Electrical Engineering National Taiwan University Taipei, Taiwan
Abstract
The ability to rapidly acquire synchronized phasor measurements from around the system open up new possibilities for power system operation and control. A novel neuro-fuzzy network, Fuzzy Hyperrectangular Composite Neural Network, is proposed for voltage security monitoring (VSM) using synchronized phasor measurements as input patterns. This paper demonstrates how neuro-fuzzy networks can be constructed off-line and then utilized on-line for monitoring voltage security. The neuro-fuzzy network is tested on 3000 simulated datas from randomly generated operating conditions on the IEEE 30bus system to indicate its high classification rate for voltage security monitoring.
1. Introduction In recent years an instability, usually termed a voltage instability, has been observed and been responsible for several major network collapses in many countries [I, 21. The phenomenon was not always in response to a contingency such as the loss of an important transmission line or a generator, but rather in response to an unexpected raise in the load level, sometimes in combination with an inadequate VAR support at critical network buses. Significant research efforts have been devoted to understanding voltage phenomena. A large portion of this research in focused on the steady-state aspects of voltage stability. Indeed, a lot of researchers have proposed the concept of voltage security margin which show how close the current operating point of a power system is to the voltage collapse point [3-151 as monitoring of voltage security. Specifically, Tiranuchit [ 3 ] proposed the minimum singular value of the Jacobian of the load flow equation as a voltage security index. The concept of multiple load flow solutions was proposed to deal with PE-879-PWRS-2-06-1997 A paper recommended and approved by the IEEE Power System Analysis, Computing and Economics Committee of the IEEE Power Engineering Society for publication in the IEEE Transactions on Power Systems. Manuscript submitted December 30, 1996; made available for printing June 11, 1997.
Mu-Chun Su Department of Electrical Engineering Tamkang University Taipei, Taiwan
voltage security problems [4, 51. Lof [6] presented a fast method to calculate the minimum singular value and the corresponding (left and right) singular vectors. Continuation methods were also applied to compute the exact collapse point and the voltage security margin in MW [7-91. Van Cutsem [lo] used the solution of a reactive power optimization problem as the voltage security. Gao [ll] used the modal analysis technique to compute the voltage security. One main disadvantage of aforementioned techniques is that they require large computations and are not efficient for on-line use in control center. For on-line applications there is a need for tool which can provide timely evaluation of voltage security such that operators may observe advance warning signals in order to steer the system away from a developing voltage collapse whenever possible. Except the above methods, there is another class of techniques applied to voltage security monitoring (VSM) which are artificial intelligence methods in nature. Specifically, there are Artificial Neural Network [ 12- 141, and Decision Tree [15] for VSM. The artificial intelligence methods can learn in off-line from training set and are used in on-line to classify new data much faster than would be possible by solving the model analytically. With the advent of systems capable of making synchronized phasor measurements, the on-line monitoring of the voltage security has become an possibility [16-181. Commercially available systems based on GPS (Global Positioning System) satellite time transmissions can provide synchronization to 1 microsecond accuracy. By communicating time-tagged phasor measurements to a central location, the state of the system can be tracked on-line. Utility experience indicates that communication bandwidths can handle 12 complete set of phasor measurements per second [19]. In this paper, we propose a two-layer Fuzzy Hyperrectangular Composite Neural Network (FHRCNN) using synchronized phasor measurements as input patterns for VSM. The FHRCNN first introduced in [20] has been proved to have several advantages over traditional Feed-forward Artificial Neural Network (ANN) in the context of pattern recognition. In particular, F'HRCNN can provide explanations of their responses, i.e., explicit IF-THEN rules or logical reasoning processes. This expert system like property makes FHRCNN especially suitable for VSM since a trained FHRCNN can explicitly provide the security range of input
0885-8950/98/$10.00
0 1997 IEEE
Authorized licensed use limited to: National Taiwan University. Downloaded on March 9, 2009 at 04:04 from IEEE Xplore. Restrictions apply.
327
patterns, which is useful for power system operator to identify the key influencing patterns. The minimum singular value and corresponding right singular vector are adopted to train and test FHRCNN. The paper is organized as follows. Section 2 briefly explains the measuring technique of synchronized phasor measurements. The FHRCNN is described in Sec. 3. The adopted voltage security index and weak bus identification are described in Sec. 4. In section 5, the proposed scheme is simulated on IEEE 30-bus system. Finally, a summary conclusion is given in Sec. 6.
(GPS) has made it possible to produce synchronizing pulses once every second with accuracy of 1 microsecond.
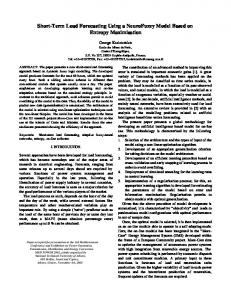
3. The Proposed FHRCNN A two-layer FHRCNN with hybrid training algorithm is developed to monitor voltage security in this section. A description of basic elements of two-layer FHRCNN (shown in Fig. 1) follows.
2. Synchronized Phasor Measurements A detailed description of phasor measurement units (PMUs) utilizing time synchronized sampling over an entire power system to simultaneously obtain the phasor measurements can be found in 116-181. Here a brief description of this technique is provided below for the case of reference. Let y(t) represent a voltage or current in sine-cosine form where E ( f ) represents noise like signals
Fuuy membership
y(t) = Yccosoot+ Y,sinwot+&(t)
ts
Estimates of the values pc and can be obtained with a Fourier calculation where there are N samples per cycle or half-cycle of the fundamental frequency W O (the nominal power system frequency, 50. or 60 Hz..
If y(t) is a pure sinusoid that equals cos(oot+ 6), the complex number ? computed from eqns. l a and lb has the angle 6 . If y(t) is a bus voltage the resulting complex voltage phasor can be thought as the state of the system for many applications. As the window of N samples moves in time [the sums in eqns. a and b taken from n=k to n=N+k-1] the angle of ? rotates. A reference angle can be established and the calculations made recursively by writing the equation with $ equal to WOATand fL as the phasor computed using N sample values ending at sample L. FL = YL-' + ( 6 ) I Y L -yL-Nexp(i"xp(-jL+) (2) The recursive calculation is computationally efficient since only one multiplication is performed in eqn.(2). Even more importantly, if the signal y(t) is a pure sinusoid at the nominal frequency W Othen , kL is stationary in phase with a phase angle equal to the angle 6 at the instant at which the recursion was begun. Currently, one limiting factor to this technology is the availability of an accurate sampling clock synchronism system. The use of a navigation broadcast system such as the global positioning system
I
output
Fig. 1 A two-layer FHRCNN
Input Vector ;(=[x, , x, ,... , x,,]) is an input vector and should be properiy chosen for the success of FHRCNN application in VSM. Since the GPS based synchronized voltage phasors provide the on-line information of system state, in this paper, we choose the set of voltage phasors of monitored buses as the input vector. Thus the input vector, 3, is of the following form:
Output variable The magnitude of output variable is employed to label the voltage security levels. Suppose the study power system voltage security levels are classified into 5 levels according to the magnitude of the minimum singular value, s,,: very secure level (s,,2 0.4450), secure level (0.4449 2 s,, 2 0.3600), alert level (0.35992 s,, 2 0.1950), dangerous level (0.1949 2 s,, 2 0. lOOO), very dangerous level (0.0999 2 s,, > 0.0). Of course, the determination of range of the minimum singular value depends heavily on the specific power system under operation. On possible way to do this is to extensively conduct simulations off-line for the study power system under various operating conditions to statistically determine the range. We use five integers ta label the 5 levels as output values like this : 5 -+very secure level 4 +secure level
3 +alert level 2 -+dangerous level
Authorized licensed use limited to: National Taiwan University. Downloaded on March 9, 2009 at 04:04 from IEEE Xplore. Restrictions apply.
328
1 +very dangerous level
4. The Adopted Voltage Security Index and Weak Bus Identification
ips between input vector and output can be described by the following equation.
where (4)
And, wI,8, s,, M,,, m,,: scalar parameters adjusted by hybrid training algorithm. Hybrid Training Algorithm The supervised decision-directed learning (SDDL) algorithm and back-propagation (BP) algorithm are combined to train FHRCNN. The SDDL is based on an approach that divides the input vector space into proper subsets (i.e. hyperrectangles). Each hyperrectangle, corresponding to a hidden node, is n-dimensional and defined by [m,l,Mjl]x +..x [mJn,MJ,]in R" space. Once the number of hyperrectangles and initial parameters, m,~,M,I, ... , m,,, MI,, are determined by SDDL. The BP algorithm is used to adjust parameters, w,, 8, s,, U,,, mjl, such that the following error function is minimized.
The goal of a static voltage security index is to measure how "close" a specific operating point is to the point of voltage collapse, i.e. to estimate the steady state voltage stability margin of the power system. One suggestion for a static voltage security index is to use the minimum singular value of the power flow jacobian matrix. The use of this index, obtained from a singular value decomposition of the power flow jacobian matrix, has been proposed and verified by Tiranuchit and Thomas in [3]. In this paper, the minimum singular value, sn, and its corresponding (righ and left) singular vector, R,, L n , are adopted to obtain the attributes of training and test patterns for FHRCNN. Consider the following well-known linear power flow equation,-
Where P and Q are the active and reactive power, respectively, 8 and V are the node angles and voltage magnitudes, respectively, and J is the Jacobian matrix of power flow equations. According to Eq. (6), The effect on the [ A 0 , AV* vector of a small change in the active and reactive power @jectio_ns can-be rewritten as (9)
The singular value decomposition is applied to the power flow Jacobian matrix, J . The matrix J n x , then has form J = LSRT = L,S,RT (10)
2
i=l
Error = C E P
- C :(Outp
p - P
-tp)
2
(7)
where tP : desired output value of the p-th input vector, Out, : output value from FHRCNN. A detailed description of the hybrid training algorithm is given in [20].
where L and R are n by n orthonormal matrices, the singular vector L, and R , are the columns of the matnces L and R, respectively, S is a diagonal matrix, and s, is a singular value of matrix J . As a result, Eq. (9) can be rewrittenras r ~
F-THEN Rules After sufficient training, the synaptic of a trained FHRCNN with hidden nodes can be utilized to extract the classification knowledge which are then represented as a set of IF-THEN rules such as the following examples:
IF (2 E HR ), THEN output is 5 . IF (2 E HR2),THEN output is 4. IF (2 E HR3), THEN output is 3. IF (2 E HR4),THEN output is 2. IF (2 E HR5),THEN output is 1. Where HR, represent an n-dimensional hyperrectangle defined by [rn,l , M,1] x [mj2 ,M121x . . . x[mjn,Mjnl, j=1,2, ... , 5 .
l o (11)
where SI 2 s2 2 s3 2 2 sn 2 0. From Eq. (11), if the minimum singular value, S n , is equal to zero then the Jacobian matrix is singular and no power flow solution can be obtained. At the point where sn = 0 is called a Static Bifurcation Point which is associated with voltage collapse phenomena [3]. Therefore, the smaller of the magnitude of s, is, the closer to voltage collapse of the operating point is. Ifwelet. - a
12
]=Ln where Ln is the last column of L, then from Eq. (11)
Authorized licensed use limited to: National Taiwan University. Downloaded on March 9, 2009 at 04:04 from IEEE Xplore. Restrictions apply.
329
where R, is the last column of R. A summary of the above analysis is : 1. The minimum singular value, S, , is an indicator of the proximity to the steady-state voltage stability limit; 2. The right singular vector, R,, corresponding to s, , indicates sensitive voltages (and angles). 3. The left singular vector, L , , corresponding to s, , indicates the most sensitive direction for changes of the active and the reactive power injections. In this paper, we focus on the right singular vector, R,, indicating sensitive voltages. Let R n = [r1,r2,...,rm, r m + I , * * * ,
r,lT
1.
J
(14)
where rr, i=l, 2, ... , m are the elements which correspond to bus angle changes in vector R, and r r ,i=m, m+l, ..., n are the elements which correspond to bus voltage magnitude change in vector R,. The weakest bus would imply the largest value of r l , i=m, m+l, ..., n, i.e. the largest change in voltage magnitudes. As a result, if bus k is the weakest node, then
where JL is a set of all load buses. Based on the value of (index) ri , the system buses may be arranged in order of weakness. Training and test patterns of FHRCNN for VSM have been designed according to the above analysis. The minimum singular value, s,, is employed to classify voltage security level. The right singular vector, R , , is used to identlfy weak buses, and the location and number of PMUs to be installed in power system is determined according to the ranking of weak buses under heavy load condition. That is, we install PMUs in weak buses to monitor voltage security. Moreover, the voltage phasor measurements from PMU form the input vector of FHRC”.
5. Numerical Example and Results The IEEE 30-bus system with PMUs (shown in Fig. 2) was used to test the effectiveness of FHRCNN for VSM. Fast calculations of the minimum singular value and corresponding singular vector based on [6] were adopted to prepare for the training patterns and test patterns. The 2500 training patterns and 500 test patterns were generated from a extensive power flows by considering random load changes (light load to critical load), effects of on-load tap changers (OLTCs), generator power limits (reactive power limits on generators), VAli compensators, and various contingencies. The simulation program were developed on a SUN SPARC I1 in C++ and MATLAB. The power flow results of critical load conditions is shown in Table 1. Under critical
m
1 28
1 2 2 2
29
30
Fig. 2 EEE 30-bus system with 10 PMUs load condition, all generator buses (PV)except the swing bus are converted to PQ buses. 10 phasor measurement units (?MUS) were installed on bus 30, 26, 29, 25, 27, 24, 23, 19, 18, 20 based on weak bus ranking of the test system under heavy load condition. The result of the weak bus ranking under heavy load condition is presented in Table 2. Table 1 power flow results under critical load condition (minimum singular value=0.0068)
Bus Type voltage angle Pg 0.000 -9.300 -13.980 -17.417 -30.020 -21.462 -26.298 -23.206 -30.853 -36.209 -30.853 -33.766 -33.766 -36.712 -37.064 -35.721 -36.753 -39.178
1 2 3 4 5 6 7 8 9 10 11 12 13 14 15 16 17 18 19
1 3 3 3 3 3 3 3 3 3 3 3 3 3 3 3 3 3
1.060 0.912 0.852 0.812 0.760 0.778 0.752 0.767 0.750 0.720 0.811 0.720 0.764 0.689 0.680 0.703 0.703 0.665
3
20
3 3 3
0.664 -39.759 0.671 -39.038
21 22
0.690 -37.693 0.691 -37.654
Qg
4.748 2.798 0.400 0.500 0.000 0.000 0.000 0.000 0.000 0.400 0.000 0.000 0.000 0.000 0.000 0.400 0.000 0.000 0.000 0.190 0.000 0.240 0.000 0.000 0.000 0.240 0.000 0.000 0.000 0.000 0.000 0.000 0.000 0.000 0.000 0.000 0.000 0.000 0.000 0.000 0.000 0.000 0.000 0.000
Authorized licensed use limited to: National Taiwan University. Downloaded on March 9, 2009 at 04:04 from IEEE Xplore. Restrictions apply.
Pa 0.000 0.394 0.036 0.114 1.507 0.000 0.344 0.462 0.000 0.087 0.000 0.169 0.000 0.093 0.124 0.052 0.136 0.048 0.143 0.033 0.264 0.000
Qa 0.000 0.230 0.018 0.024 0.304 0.000 0.164 0.456 0.000 0.030 0.000 0.113 0.000 0.024 0.037 0.027 0.087 0.013 0.051 0.010 0.169 0.000
330 23 24 25 26 27 28 29 30
0.661 -
3 3 3 3 3 3 3 3
-38.415 0.656 -38.990 0.648 -37.677 0 .603 -39.330 0.664 -35.908 0.761 -22.894 0.610 -40.619 0.579 -44.380 -
0.000 0.000 0.000 0.000 0.000 0.000 0.000 0.000
0.000 0.043 0.000 0.000
0.048 0.131 0.000 0.052
0.000 0.000 0.000 0.000
0.000 0.000 0.036 0.160
0.024 0.101 0.000 0.034 0.000 0.000 0.013 0.028
Table 3 Training parameters of FHRCNN for 30-bus system input data
No. of records of training data
io,ooa
No. of record of testing data
* type 1:swing bus, 2: PV bus, 3: PO bus
** PV buses change sequence: bus f 13,11,2,5,8)
*** -input variables from PMU
iteration
I value of learning rate 1
4.0000e-04
value of tolerance
1.0000e-04 weight
I bias
1
0.23-0.27) 0.1-0.21
Table 2 Weak buses ranking under heavy load condition
Rank
r, index
Bus 1 2 3
4 5
I
6 7 8 9 10 11 12 13 14 15 16 17 18 19 20 21 22 23 24 25 26 27 28 29
30 26 29 25 27 24 23 19 18 20 15 22 21 14 17 16 10 12 13 9 11 28 8 6 7 4 5 3 2
voltage angle
0.261 0.256 0.250 0.23 1 0.220 0.2 18 0.214 0.212 0.211 0.208 0.202 0.200 0.199 0.198 0.193 0.192 0.188 0.183 0.179 0.167 0.161 0.130 0.121 0.117 0.112 0.102 0.097 0.085 0.053
loaddemand Mw
ri 0.752 0.766 0.775 0.800 0.815 0.804 0.817 0.815 0.820 0.822 0.838 0.876 0.827 0.848 0.841 0.852 0.851 0.876 0.913 0.874 0.928 0.842 0.848 0.855 0.838 0.875 0.852 0.905 0.958
-34.979 -3 1.953 -32.717 -30.909 -29.719 -31.819 -31.672 -32.496 -32.200 -3 1.970 -30.959 -28.943 -30.936 -30.855 -30.391 -29.957 -29.904 -28.943 -28.943 -26.132 -26.132 -20.080 -20.225 -18.858 -22.297 -15.634 -24.557 -12.704 -8.460
15.9 5.3 3.6 0.0 0.0 13.1 4.8 14.3 4.8 3.3 12.3 0.0 26.2 9.3 13.5 5.3 8.7 16.8 0.0 0.0 0.0 0.0 42.0 0.0 34.2 11.4 131.9 3.6 32.6
PMU
WAR 2.8 3.6 1.4 0.0 0.0 10.1 2.4 5.1 1.4 1.0 3.8 0.0 16.8 2.4 8.7 2.7 3.0 11.3 0.0 0.0 0.0 0.0 42.0 0.0 16.3 2.4 26.6 1.8 19.0
+ + +
+ +
+ + + + f
The voltage security level is divided into 5 levels based on the magnitude of the minimum singular value : very secure level ( sn 2 0.4450), secure level (0.4449 l s n 2 0.3600), alert level (0.3599 2 s n 2 0.1950), dangerous level (0.1949 2 s n 2 O.lOOO), and very dangerous level (0.0999 2 Sn 2 0.0). Therefore, the training patterns were divided into five clusters according to the learning characteristics of hybrid training algorithm of W C N N to train the FHRCNN. Training parameters of the network are shown in Table 3. After training, FHRCNN extracted 21 IF-THEN rules for VSM, which were represented as hyperrectangulars (i.e. hidden nodes) in input vector space. These IF-THEN rules can provide utility operators with an expert-system like tool to analyze bus voltage phasor sensitivity to the minimum singular value. Table 4 shows the lower and upper bounds of hyperrectangles (IF-THEN rules) for various voltage security levels. A look of Table 4 reveals that the lower
6. Conclusions In this paper, we have demonstrated the success of properly trained FHRCNN for voltage security monitoring based on synchronized phasor measurements. Extensive
Authorized licensed use limited to: National Taiwan University. Downloaded on March 9, 2009 at 04:04 from IEEE Xplore. Restrictions apply.
Table 4
The upper(u) and lower(L) bounds of
Very dangerous level Rule 1-3
Alert level Rule 9-14
Dangerous level Rule 4-8
hyperrectangles
Secure level Rule 15-18
Very secure level Rule 19-2 1 voltage
0.6091 0.831~-0..708
I
-0.4591
0.6561
0.8731
-0.681 -0.4531
0.6611
0.8711
-0.671 -0.4471
06641
08741 -06931
0665
0873
-0683
-0454 -0461
0676
0883
-0681
-0444
0.7231
0.751
0758
I
-0.332
-0.2
0.925
I
-0.332
-0.2
0.951
1
-0.324
-0.2
0.9441 -0.5961 -0.321
0.981 -0.5661 -0.321
(l i (l;Ji -0 1 410: 0.756)
voltage
0.9751 -0.5861 -0.316
0987
-0605
-0321
0.993
0.834
-0.561
-0.27
0.932
0.995
-0.406
-0.213
0.837
0.996 -0.579
-0.277
0.936
I
-0.414
-0.217
0.835
0.993
-0.571
-0.273
0.933
0.997
-0.41
-0.215
0.851
0.999
-0.57
-0.274
0.944
1.007
-0.426
-0.146
Table 5 The classification rates of FHRCNN and ANN far IEEE 30-bus system Voltage
1 1
FHRC"
A"
Vervsecure 100% 97.72% 93.18% 84.21%
Training set Test set Training set Testset
I
secure 100% 98.17% 95.61% 88.78%
I
Security Allert 100% 98.30% 94.75% 89.00%
I
Level Dangerous 100% 98.54% 97.13% 87.27%
I Verv Dangerous 100% 98.02% 95.08% 87.32%
Table 6 The classification rates of FHRCNN input vector selected based on synchronized phasor measurements (PMUs) and SCADA systems
I
Input Vector Device (20 dimensions)
Pattern
Very Secure
Voltage Security Level Secure Alert Dangerous Very Dangerous
V, , e n n= 30,26, Training set 29,25,27,24,23, Test set 19,18,20
100%
100%
100%
100%
100%
97.72%
98.17%
98.30%
98.54%
98.02%
,P ,Q, ,n=30,26, Training set
94.18%
95.30%
92.75%
93.53%
92.42%
29,25,27,24,23, 19, 18,20
76.24%
78.78%
75.60%
77.27%
77.02%
99.10%
98.25%
97.06%
95.13%
95 .OS%
90.72%
89.98%
87.27%
86.45%
85.83%
.
Test set
P, ,Q,i=2,5,8,13 Training set P, ,Q, , k=30,29, 26,24,20,19
Test set
testing was performed on the IEEE 30-bus system under various operating conditions. Accuracies in excess of 97% were also obtained for these testings. The FHRCNN was constructed off-line from simulated data. The computational burden proved to be quite reasonable, and
larger system could be handled. Once the FHRCNN 1s constructed in off-line, the on-line VSM response is extremely fast. We suggest that a FHRCNN methodology can automate the process of transforming off-line simulation studies into on-line decision rules.
Authorized licensed use limited to: National Taiwan University. Downloaded on March 9, 2009 at 04:04 from IEEE Xplore. Restrictions apply.
332
Acknowledgment We are thankful to Chi-Wei Chang and Huo-Chiao Yu for their progrommimg assistance.
References IEEE Publication 9OTHO358-2-PWR , Voltage Stability of Power Systems: Concepts, Anahtical Tools, and Industry Experience, IEEE Service Center, New Jersey, 1990. C. W. Taylor, Power System Voltage Stability, McGraw-Hill, Inc., 1994. A. Tiranuckt and R. J. Thomas, "A Posturing Strategy Against Voltage Instabilities in Electric Power Systems", IEEE Trans. on Power Systems, Vol. 3, No. 1, pp. 87-93, February 1988. Y. Tamura, H. Mori and S. Iwamoto, "Relationshipbetween Voltage Instability and Multiple Load Flow Solutions in electric Power Systems", IEEE Trans. on PAS, Vol. 102, No. 5, pp. 1115-1125, May 1983. C. L. DeMarco and T. J. Overbye, "An Energy Based stability Measure for Assessing Vulnerability to Voltage Collapse," IEEE Trans. on power systems, Vol. 5, NO.2, May 1990. P.-A. Lbf, T. Semed, G. Andersson, and D.J.Hil1, "Fast calculation of a voltage stability index", ZEEE Trans. on Power Systems, Vol. 7, No. 1, pp. 54-64, February 1922. K. Iba, H. Suzuli, M Egawa and T. Watanabe, "Calculation of the Critical Loading with Nose Curve Using Homotopy Continuation Method", IEEE/PES I990 Summer Meeting, Minneapolis, Minnesota, pp. 15-19, July 1990. V. Ajjarapu and C. Christy, "The Continuation Power Flow: a Tool for Steady State Voltage Stability Analysis", ZEEE Trans. on power systems, Vol. 7, No. 1, pp. 416-423, February 1992. IC. A. CGizares and F. L. Alvarado, "Point of Collapse and Continuation Methods for Large AC/DC Systems, I' IEEE Trans. on paver systems, Vol. 8, No. 1, pp. 1-8, February 1993. T. Van Cutsem, "A method to compute Reactive Power Margins with respect to Voltage Collapse", IEEE Trans. on powersystems, Vol. 6 , No 1, pp 145-156, February 1991. B. Gao, 6.K.Morison and P. Kundur, "Voltage stability evaluation using Modal analysis", IEEE Trans. on Power Systems, Vol. 7, No. 4, pp. 1529-1542, Nov. 1992. A. A. El-Keib and X. Ma, "Application of Artificial Neural Networks in Voltage Stability monitoring", IEEE Trans. on Power Systems, Vol. 10, No. 4, pp. 1890-1896, November 1995. B. Jeyasurya, "Artifical neural networks for power system steady-state voltage instability evaluation", Electric Power Systems Research, Vol. 29, pp. 85-90, 1994. M. L. Scala, M. Trovato and F. Torelli, "A Neural Network -Based Method for Voltage Security monitoring", IEEE Trans. on Power Systems, Vol. 11, No. 3, pp. 1332-1341, August 1996. r. Van Cutsem, L. Wehenkel, M. Pavella, E. Heilbronn, M. Goubin, "Decision tree approaches to Voltage stability monitoring", LEE Proceedings-C, Vol. 140, No. 3 May 1993. A. G. Phadke and J. S. Thorp, "Improved Control and Protection of Power System through Synchronized Phasor
Measurements", Control and Dynamic system, Vol, 43, pp. 335-376, Academic Press, 1991. A. G. Phadke, "Synchronized Phasor Measurements in Power SystendJEEE Computer Applications in Power, Vol. 6,No. 2, pp. 10-15, May 1993. A. G. Phadke and J. S. Thorp, "Computer Relay for Power Systems",John Wiley and Sons Inc., New York, 1988. R. P. Schulz, L. S. Vanslyck, and S. H. Horowitz, "Applications of Fast Phasor Measurements on Utility Systems",PICA Proc. , pp. 49-55, Seattle, May 1989. M. C. Su and C. J. Kao, "Time Series Prediction Based on a Novel Neuro-Fuzzy System", Fourth Golden West Conference on Intelligent Systems, pp.229-232, San Francisco, USA, 1995.
Biographies Chih-Wen Liu received the B.S. degree in electrical engineering from National Taiwan University in 1987, Ph.D. degree in electrical engineering from Come11 University in 1994. Since 1994, he has been wlth NaQonal Taiwan University, where he is associate professor of electrical engineering. His research interests include power system computer applications. Chen-Sung Chang received the diploma in Electrical Engineering from National Taipei Institute of Technology. He is currently working toward his Ph.D. degree at National Taiwan University. His research interests include power system voltage stability and applications of artificial intelligence in power system. Mu-Chun Su received the B. S. degree in electronics engineering from National Chiao Tung University, Taiwan, Republic of China, in 1986, and the M. S. and Ph.D degree in electrical engineering from Umversity of Maryland, College Park, MD, in 1990 and 1993, respectively. He was the 1992 IEEE Franklin V. Talor Award recipient for the most outstanding paper co-authored with Dr. N. DeClaris. He is an Associate Professor of Electrical Engineenng at Tamkang University, Taiwan, Republic of China. His cment interests include neural networks, fuzzy systems, computer-aided medical systems, pattern recognition and speech processing.
Authorized licensed use limited to: National Taiwan University. Downloaded on March 9, 2009 at 04:04 from IEEE Xplore. Restrictions apply.