The Journal of Neuroscience, February 27, 2008 • 28(9):2075–2088 • 2075
Neurobiology of Disease
Neuron-Specific Expression of Mutant Superoxide Dismutase Is Sufficient to Induce Amyotrophic Lateral Sclerosis in Transgenic Mice Dick Jaarsma,1 Eva Teuling,1 Elize D. Haasdijk,1 Chris I. De Zeeuw,1,2 and Casper C. Hoogenraad1 1
Department of Neuroscience, Erasmus Medical Center, 3000 CA Rotterdam, The Netherlands, and 2Netherlands Institute for Neuroscience, 1105 BA Amsterdam, The Netherlands
Mutations in superoxide dismutase (SOD1) cause amyotrophic lateral sclerosis (ALS), an adult-onset progressive paralytic disease characterized by loss of motor neurons, and cause an ALS-like disease when expressed in mice. Recent data have suggested that motor neuron degeneration results from toxic actions of mutant SOD1 operating in both motor neurons and their neighboring glia, raising the question whether mutant SOD1 expression selectively in neurons is sufficient to induce disease. Here we show that neuronal expression of mutant SOD1 is sufficient to cause motor neuron degeneration and paralysis in transgenic mice with cytosolic dendritic ubiquitinated SOD1 aggregates as the dominant pathological feature. In addition, we show that crossing our neuron-specific mutant SOD1 mice with ubiquitously wild-type SOD1-expressing mice leads to dramatic wild-type SOD1 aggregation in oligodendroglia after the onset of neuronal degeneration. Together, our findings support a pathogenic scenario in which mutant SOD1 in neurons triggers neuronal degeneration, which in turn may facilitate aggregate formation in surrounding glial cells. Key words: amyotrophic lateral sclerosis (ALS); protein aggregation; oligodendrocyte; astrocyte; motor neuron disease; mouse model
Introduction Amyotrophic lateral sclerosis (ALS) is a clinically and genetically heterogeneous late-onset neurodegenerative disease of motor neurons causing progressive paralysis. In a subset of patients, the disease is caused by mutations in the cytosolic CuZn superoxide dismutase (SOD1) gene (Rosen et al., 1993; Boillee et al., 2006a; Pasinelli and Brown, 2006). More than 100 different SOD1 mutations have been identified that all cause a rather similar disease phenotype (Andersen et al., 2003). All mutants show reduced conformational stability and cause the accumulation of hydrophobic and aggregation-prone SOD1 subfractions when expressed in cellular and transgenic mouse models (Durham et al., 1997; Johnston et al., 2000; Jonsson et al., 2006b; Shaw and Valentine, 2007; Zetterstrom et al., 2007). Aggregates as well as other pathological abnormalities do not exclusively occur in neurons but also in glial cells surrounding the motor neurons (Bruijn et al., 1997; Dal Canto and Gurney, 1997; Kato et al., 1997). Hence, mutant SOD1 also can cause damage in glial cells, raising the question to what extent these non-motor neuron abnormalities Received Oct. 12, 2007; revised Jan. 7, 2008; accepted Jan. 8, 2008. This work was supported by the European Union, Prinses Beatrix Fonds, ZonMW, and Neuro-Bsik (C.I.D.Z.), and The Netherlands Organization for Scientific Research, European Science Foundation (European Young Investigators Award), and Amyotrophic Lateral Sclerosis Association (C.C.H.). We thank Dr. H. W. Verspaget, Dr. P. Caroni, and Dr. N. J. Maragakis for reagents, and K. Staats, S. Cardona, and A. Houssaini for technical help. D.J. is supported by the Prinses Beatrix Fonds, Hersenstichting Nederland, and Erasmus Medical Center. Correspondence should be addressed to either Dick Jaarsma or Casper C. Hoogenraad, Department of Neuroscience, Erasmus Medical Center, P.O. Box 2040, 3000 CA, Rotterdam, The Netherlands. E-mail:
[email protected] or
[email protected]. DOI:10.1523/JNEUROSCI.5258-07.2008 Copyright © 2008 Society for Neuroscience 0270-6474/08/282075-14$15.00/0
contribute to motor neuron degeneration and disease progression in SOD1–ALS (Lobsiger and Cleveland, 2007). This question is also relevant for SOD1-unrelated forms of ALS because most of these patients have TAR DNA binding protein-43immunoreactive inclusions in both neurons and glial cells (Arai et al., 2006; Neumann et al., 2006). The role of glia cells in SOD1–ALS pathogenesis has been examined in chimeric mice that were mixtures of normal cells and mutant SOD1-expressing cells (Clement et al., 2003). This study indicated that degeneration of motor neurons expressing mutant SOD1 was delayed or prevented when they were surrounded by wild-type non-neuronal cells, whereas wild-type motor neurons could develop degenerative changes when surrounded by mutant SOD1-expressing neuronal cells (Clement et al., 2003). Similar results were obtained in previous studies with spinal primary and embryonic mouse stem cell-derived motor neurons cocultured with mutant SOD1-expressing astrocytes, which showed that mutant SOD1 in astrocytes may cause degenerative changes in wild-type motor neurons and exacerbate toxic effects of mutant SOD1 in motor neurons (Di Giorgio et al., 2007; Nagai et al., 2007). In addition, studies with mutant SOD1 transgenic mice constructed to express no (Beers et al., 2006) or reduced levels of (Boillee et al., 2006b) mutant SOD1 in microglia have suggested non-cell autonomous toxic effects of mutant SOD1 operating in microglia. Because previous studies had reported the lack of motor neuron degeneration in transgenic mice expressing mutant SOD1 selectively in neurons (Pramatarova et al., 2001; Lino et al., 2002) or astrocytes (Gong et al., 2000), it has been proposed that mutant SOD1 cause the degeneration of mo-
2076 • J. Neurosci., February 27, 2008 • 28(9):2075–2088
tor neurons by a combination of cell-autonomous and non-cellautonomous processes, requiring the presence of mutant SOD1 in both neurons and glia, and raising the question whether mutant SOD1 expression in neurons is sufficient to induce disease. In contrast to this notion, in this study, we show that mutant SOD1 expression in neurons is sufficient to induce motor neuron degeneration and paralysis in transgenic mice.
Materials and Methods Transgenic mice. Experiments were performed in accordance with the Principles of Laboratory Animal Care (National Institutes of Health publication number 86-23) and the guidelines approved by the Erasmus University animal care committee. To generate Thy1.2–G93A mice, a cDNA of human SOD1 (hSOD1) carrying the G93A mutation was cloned into the Thy1.2 expression cassette (Caroni, 1997; Feng et al., 2000) and injected into fertilized oocytes, using standard techniques. Embryos for injection were obtained from FVB mice. Transgenic lines (T1–T10) were screened immunohistochemically for G93A–SOD1 expression in the spinal cord using human SOD1-specific antibody. Two lines (T1 and T3) were used for additional studies. Transgenic lines were maintained into BCBA background by crossing hemizygote males with nontransgenic females. Transgenic offspring was genotyped by PCR. Homozygote T3T3 and double transgenic T1T3 were obtained by crossing T3 males with T3 and T1 females, respectively. Double transgenic offspring were distinguished from hemizygotes by Southern blot. Other mice used in this study were G1del mice, which carry a genomic hSOD1 construct with the G93A mutation, and hSOD1 mice, i.e., transgenic mice carrying a genomic construct of wild-type hSOD1. G1del mice are descendent from the Gurney G1 mice but show a reduced transgene copy number (8 instead of 24 transgene copy numbers per haploid genome) and show a delayed onset of disease compared with the original Gurney G1mice (Gurney, 1997). hSOD1 mice are derived from the Gurney N29 line (Gurney et al., 1994) and have been extensively characterized in our laboratory in previous studies (Jaarsma et al., 2000). Double transgenic T3hSOD1 mice were generated by crossing T3 and hSOD1 hemizygotes. Routinely, transgenic mice were weighed and inspected for signs of muscle weakness once (Thy1.2–G93A mice) or twice (G1del mice) a week, using a set of simple tests: mice were examined for their ability to extend their hindlimbs when suspended in the air by their tail and their ability to hang upside down on a grid for 60 s. In addition, at specific ages, grip strength was measured using a grid attached to a force gauge (Bioseb, Chaville, France). Mice reached end-stage disease when they could not right themselves within 5 s when placed on their back, lost ⬎30% of their maximal weight, or developed infection of one of the eyes. Mice selected for analysis of the clinical course of disease were killed at end-stage disease or when they reached 2 years of age. After the experiment, all mice were analyzed for neuromuscular denervation and pathological abnormalities in the spinal cord (e.g., ubiquitin pathology, motor neuron loss, gliosis, and argyrophylic neuronal debris). Mice developing tumors before end-stage disease or 2 years of age were excluded from the study. Antibodies. Primary antibodies [immunohistochemistry (IHC), immunofluorescence (IF), Western blot (WB)] reported in this study are as follows: mouse anti-␣B-crystallin (Stressgen Biotechnologies, San Diego, CA; IHC and IF, 1:1000; WB, 1:2000), rabbit anti-activating transcription factor 3 (ATF3; Santa Cruz Biotechnology, Santa Cruz, CA; IHC and IF, 1:1000); anti-cleaved caspase 3 (Asp175; Cell Signaling Technology, Beverly, MA; IHC, 1:200), rabbit anti-calcitonin gene-related peptide (CGRP; Calbiochem, La Jolla, CA; IHC and IF, 1:10000); goat anticholine acetyltransferase (ChAT; Millipore, Billerica, MA; IHC and IF, 1:500); rat anti-complement receptor 3 (CR3) receptor (clone 5C6; Serotec, Oxford, UK; IHC, 1:500; IF, 1:100); rabbit anti-GFAP (Dako, Carpinteria, CA; IHC, 1:10,000; IF, 1:5000; WB, 1:5000); rabbit antiglutamate transporter 1 (GLT1; from Dr. N. J. Maragakis, Johns Hopkins University, Baltimore, MD; WB, 1:10,000); anti-GM130 (Transduction Laboratories, Lexington, KY; IF, 1:1000); rabbit anti-heat shock protein 25 (Hsp25; Stressgen; IF, 1:2000); mouse anti-microtubule-associated protein 2 (MAP2; Sigma, St. Louis, MO; IF, 1:1000); neuron-specific
Jaarsma et al. • Neuron-Specific SOD1 Mice
nuclear protein (NeuN; Millipore; IF, 1:1000) chicken antineurofilament-M (NFM; Millipore; IF, 1:2000); mouse anti-RIP antigen (from Dr. B. Friedman, Yale University School of Medicine, New Haven, CT; IF, 1:200); sheep anti-hSOD1 (Calbiochem; IHC, 1:5000 –1:20,000; IF, 1:5000); rabbit anti-SOD1 (from Dr. H. W. Verspaget, Leiden University Medical Center, Leiden, The Netherlands; IHC and IF, 1:5000); rabbit anti-SOD1 (SOD100; Stressgen; WB, 1:5000); rabbit anti-murine SOD1 (SOD101; Stressgen; WB, 1:8000); rabbit anti-ubiquitin (Dako; IHC and IF, 1:2000); mouse anti-ubiquitin (clone FK2; Affinity BioReagents, Golden, CO; IF, 1:2000); and goat anti-vesicular acetylcholine transporter (VAChT; Millipore; IF, 1:1000). Secondary antibodies. For avidin– biotin–peroxidase immunocytochemistry biotinylated secondary antibodies from Vector Laboratories (Burlingame, CA) diluted 1:200 were used. FITC-, cyanine 3 (Cy3)-, and Cy5-conjugated secondary antibodies raised in donkey (Jackson ImmunoResearch, West Grove, PA) diluted at 1:200 were used for immunofluorescence. Western blot. Tissue specimens were homogenized and sonicated in 10 vol of PBS containing 0.5% Nonidet P-40 (NP-40) and 1⫻ protease inhibitors cocktail (Sigma) and centrifuged at 800 ⫻ g for 5 min at 4°C, and protein concentrations of the supernatants (S1) were determined using the BCA method (Pierce, Rockford, IL). To obtain the detergentinsoluble fraction P2, S1 fractions were centrifuged at 15,000 ⫻ g for 15 min. P2 pellets were thoroughly washed five times with PBS– 0.5% NP-40 and then resuspended in sample buffer for SDS-PAGE and Western blotting. Two to 30 g of protein of S1 and P2 were electrophoresed on 10 –15% SDS-PAGE gels and blotted on polyvinylidene difluoride membranes (Millipore). For quantitative analysis of hSOD1 immunoreactivity, recombinant hSOD1 protein (0.5–50 ng; from H. W. Verspaget) was electrophoresed and blotted together with the tissue samples. The membranes were blocked with 5% nonfat dry milk (Bio-Rad, Hercules, CA) in PBS with 0.05% Tween 20 (PBST), incubated in primary antibody, diluted in PBST with 1% dry milk followed by an incubation in secondary antibody, incubated in chemiluminescence reagent (ECL; GE Healthcare, Little Chalfont, UK), exposed to film or a Kodak Image station (Eastman Kodak, Rochester, NY), and analyzed with Kodak Image analysis and ImageQuant 2.2 software (Molecular Dynamics, Sunnyvale, CA). Immunohistochemical and histopathological procedures. For immunocytochemistry and immunofluorescence, mice were anesthetized with pentobarbital and perfused transcardially with 4% paraformaldehyde. The lumbar and cervical spinal cord were carefully dissected out and postfixed overnight in 4% paraformaldehyde. Routinely, spinal cord tissue was embedded in gelatin blocks (Jaarsma et al., 2000) and sectioned at 40 m with a freezing microtome, and sections were processed, free floating, using a standard avidin– biotin–immunoperoxidase complex method (ABC; Vector Laboratories) with diaminobenzidine (0.05%) as the chromogen, or single-, double-, and triple-labeling immunofluorescence (Jaarsma et al., 2000, 2001; Maatkamp et al., 2004). In addition, a selected number of frozen sections were processed for a silver staining procedure that selectively labels dying neurons and their processes (Jaarsma et al., 2000). Immunoperoxidase-stained sections were analyzed and photographed using a Leica (Nussloch, Germany) DM-RB microscope and a Leica DC300 digital camera. Sections stained for immunofluorescence were analyzed with a Zeiss (Oberkochen, Germany) LSM 510 confocal laser scanning microscope using 40⫻/1.3 and 63⫻/1.4 oil-immersion objectives. Quantitative analyses of motor neurons was performed as described previously (Vlug et al., 2005) on serial lumbar 4 (L4) sections immunoperoxidase stained for ChAT or CGRP. For analysis of neuromuscular denervation, medial gastrocnemius muscle from 4% paraformaldehyde-fixed mice were dissected, embedded into gelatin blocks, and sectioned at 80 m with a freezing microtome. Sections were immunolabeled, free floating, for goat-antiVAChT and rabbit anti-hSOD1 or goat-anti-VAChT and chicken-antiNFM, followed by Cy3 anti-goat and Cy5 anti-chicken or anti-rabbit secondaries, and motor endplates were labeled with FITC– bungarotoxin (1:500; Invitrogen, Carlsbad, CA). For quantitative analyses, muscle sections were examined under a Leica DM-RB fluorescence microscope,
Jaarsma et al. • Neuron-Specific SOD1 Mice
J. Neurosci., February 27, 2008 • 28(9):2075–2088 • 2077
Table 1. Clinical disease in neuron-specific and ubiquitous G93A–SOD1 mice
G1del (n ⫽ 10) T3G1del (n ⫽ 8) T3T3 (n ⫽ 10) T1T3 (n ⫽ 5) T3hSOD1 (n ⫽ 10)
Onset (days)
End stage (days)
Duration (days) (mean ⫾ SE)
162 to 249 168 to 197 378 to ⬎730 539 to ⬎730 273 to 385
201 to 290 210 to 248 432 to ⬎730 591 to ⬎730 434 to 546
37 ⫾ 7 37 ⫾ 6 54 ⫾ 4 (n ⫽ 8) 51 ⫾ 3 (n ⫽ 3) 155 ⫾ 13 (n ⫽ 10)*
Asymmetric hindlimb onset (% of mice)
Fully immobilized hindlimbs at end stage (%)
60 75 0 0 0
70 88 0 0 0
Onset of symptoms was determined on the basis of weight, the ability to extend the hindlimbs, and the ability to hang upside down on a grid for 1 min. In G1del and T3G1del mice, disease onset usually is asymmetric, characterized by the inability to extend one of the hindlimbs. Subsequently, symptoms in these mice ⬙spread⬙ to the contralateral hindlimb and the forelimbs. Typically, ⬙hindlimb onset⬙ mice at end-stage disease (i.e., when they could not right themselves, showed ⬎30% weight loss, or developed severe eye infection) show complete paralysis of the hindlimbs. Notably, impaired hindlimb function does not necessarily result in impaired performance in the hanging test because mice are able of performing this test for one 1 min using solely their forelimbs. A subset of G1del and T3G1del mice was characterized as ⬙forelimb-onset mice⬙ because a failure to execute the hanging test was the first symptom. These ⬙forelimb-onset mice⬙ showed short disease duration and reached end-stage disease with relatively preserved hindlimb function. In contrast to G1del mice, T1T3, T3T3, nor T3hSOD1 mice showed asymmetric onset of disease. Typically, in these mice, disease onset was characterized by the coincident onset of weight loss, failure to extend their hindlimbs, and failure to perform normally in the hanging test. Furthermore, all Thy1.2–G93A mice retained some ability to move their hindlimbs at end-stage disease. T3hSOD1 mice differed in some aspects from T1T3 and T3T3 mice: T3hSOD1 mice showed earlier disease onset and a reduced variability of onset age than T1T3 and T3T3 mice. In addition, disease duration was significantly longer than in T3T3 and T1T3 mice (*p ⬍ 0.001, unpaired two-tailed Student’s t test). Interestingly, most end-stage disease T3hSOD1 mice (8 of 10) showed a distended urinary bladder, suggestive of micturition problems, a feature that we never observed in T3T3, T1T3, or G1del mice but that recently has been reported for transgenic mice expressing the wild-type-like D90A mutation (Jonsson et al., 2006a).
endplates being scored as “innervated” in the case of complete overlap between bungarotoxin and VAChT labeling, “partially denervated” in the case of partial overlap, and “denervated” in the case of the absence of VAChT labeling at the endplate. Per muscle, all endplates within three sections were analyzed. In addition, muscle sections were analyzed with a Zeiss LSM 510 confocal laser scanning to examine neurofilament-M and hSOD1 labeling. In Thy1.2–G93A mice, the disappearance of VAChT labeling always was associated with loss of hSOD1 labeling (Fig. 1i). Electron microscopy. For electron microscopy, mice were perfused transcardially with 4% paraformaldehyde with 0.1% (preembedding immunoperoxidase and postembedding immunogold electron microscopy) or 1% glutaraldehyde (standard postembedding and immunogold labeling electron microscopy). Specimens were sectioned with a vibratome and further processed using standard methods as described previously (Jaarsma et al., 2001; Kushner et al., 2005; Vlug et al., 2005). For standard electron microscopy, vibratome sections (150 m thick) were postfixed in 1% osmium, dehydrated, and embedded in Durcupan. Ultrathin (50 –70 nm) sections were contrasted with uranyl acetate and lead citrate and analyzed in a Phillips (Aachen, Germany) CM100 electron microscope at 80 kV. Preembedding immunoperoxidase electron microscopy was performed to examine the subcellular distribution of ubiquitin and ␣B-crystallin. Vibratome sections (50 – 60 m thick) were immunoperoxidase stained as described previously (Jaarsma et al., 2001), postfixed in 1% osmium, and further processed as described for standard electron microscopy. For postembedding electron microscopy, vibratome sections (150 –300 m thick) were dehydrated and embedded in Lowicryl HM20 using a freeze substitution procedure (Jaarsma et al., 2001) or embedded in Durcupan using an osmium-free method (Kushner et al., 2005). Ultrathin (50 –70 nm) sections were processed for postembedding immunogold labeling of ubiquitin and hSOD1 as described previously (Jaarsma et al., 2001). mRNA in situ hybridization. In situ hybridization was performed on 30-m-thick free-floating sections using standard methods with digoxigenin-labeled cRNA probes (Hossaini et al., 2007). Sense and antisense digoxigenin-labeled cRNAs were transcribed from linearized plasmids containing hSOD1 cDNA. Statistical analysis. Statistical analyses were done with GraphPad Software (San Diego, CA) Prism software. Means from different age groups and different transgenic mouse lines were compared using one-way ANOVA and Tukey’s post hoc test.
Results Neuron-specific G93A–mutant SOD1 expression induces motor neuron disease in mice Neuron-specific transgenic SOD1–ALS mice were generated using a construct of human SOD1 cDNA with the G93A mutation cloned into the Thy1.2 expression cassette (Fig. 1a) that drives transgene expression in neurons throughout the CNS, including spinal motor neurons (Feng et al., 2000). Two Thy1.2–G93A lines
(T1 and T3) showed transgenic expression throughout the brain and spinal cord as determined by Western blot analysis (Fig. 1b) and immunoperoxidase histochemistry with antibodies specific for human SOD1 (Fig. 1c). No transgenic human SOD1 occurred in other tissues (Fig. 1b). Double-labeling immunofluorescence on spinal cord sections showed that mutant SOD1 was expressed in all motor neurons (ChAT and NeuN positive) as well as in other populations of spinal neurons (ChAT negative and NeuN positive) but did not codistribute with glial markers, i.e., GFAP (astrocytes), ␣B-crystallin (oligodendrocytes), and CR3 (microglia) (Fig. 1d) (see Fig. 4f,g). Immunocytochemical analysis of skeletal muscle showed that mutant SOD1 immunoreactivity in T3 and T1 mice is selectively distributed in axons and nerve endings at the neuromuscular junctions consistent with a neuron-specific expression (Fig. 1i). Quantitative Western blot showed that mutant SOD1 expression in the spinal cord of T3 Thy1.2–G93A mice was ⬃15-fold lower compared with G1del mice, i.e., a line of ubiquitously mutant SOD1-expressing mice carrying a genomic hSOD1 construct with the G93A mutation that is derived from the G93A Gurney G1 line (Gurney et al., 1994) (Fig. 1e). Confocal immunofluorescence and in situ hybridization showed that mutant SOD1 protein and mRNA expression in T1 and T3 mice also was lower at the level of individual motor neurons (supplemental Fig. 1, available at www.jneurosci.org as supplemental material). Hemizygote Thy1.2–G93A mice from either line T1 or T3 did not show clinical and pathological signs of motor abnormalities up to 2 years of age. Furthermore, the T3 transgene did not significantly influence disease phenotype of G1del mice (supplemental Fig. 2, available at www.jneurosci.org as supplemental material). Because the propensity of mutant SOD1 to induce disease is proportional to its expression level (Gurney et al., 1994; Wong et al., 1995; Bruijn et al., 1997; Jonsson et al., 2006b), the lack of disease phenotype in our T1 and T3 mice can be explained by insufficient mutant SOD1 expression. We therefore next generated T3T3 homozygotes that expressed twofold mutant SOD1 compared with T3 mice (Figs. 1e, 2b,c), as well as mice hemizygous for both the T1 and T3 insertion sites. Most of the T3T3 (8 of 12) and T1T3 (3 of 5) mice developed an ALS-like motor neuron disease before the age of 2 years (i.e., the oldest age examined), showing progressive muscle weakness and paralysis (Fig. 1f, Table 1). All the 2-year-old T3T3 and T1T3 mice that did not develop motor abnormalities showed ubiquitinated neurites in the spinal cord (see Fig. 6d, Table 2), suggestive of an early presymptomatic stage of disease. End-stage T1T3 and T3T3 mice showed most of the clin-
2078 • J. Neurosci., February 27, 2008 • 28(9):2075–2088
Jaarsma et al. • Neuron-Specific SOD1 Mice
Jaarsma et al. • Neuron-Specific SOD1 Mice
J. Neurosci., February 27, 2008 • 28(9):2075–2088 • 2079
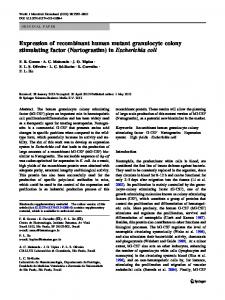
Figure 2. End-stage neuron-specific G93A–SOD1 mice show reduced total mutant SOD1 expression and the accumulation of detergent-insoluble and multimeric SOD1 species. a– e, hSOD1immunoperoxidase staining showing distribution and relative intensity of hSOD1 in the C7 spinal cord sections from hemizygote and homozygote T3 mice as well as G1del mice. Note that, spinal cord specimens were embedded in a single gelatin block and sectioned and stained together to avoid variability in staining. Antibody concentration (sheep anti-SOD1; 1:10,000) and staining conditions were chosen to maximize differences between hemizygote and homozygote T3 mice (compare b with c) showing a twofold difference in hSOD1 expression as determined by Western blot (Fig. 1e). Under these conditions, staining of G1del spinal cord is saturated (e), consistent with higher mutant SOD1 expressions levels (Fig. 1e). Note that end-stage T3T3 mice (d) compared with young presymptomatic T3T3 mice show reduced hSOD1 immunoreactivity in the ventral horn (VH) and the intermediate zone (IZ), but equal amounts of hSOD1 immunoreactivity in the dorsal horn (DH), consistent with the occurrence of neuronal degeneration in the ventral horn and the intermediate zone. f, Western blot analysis of G93A–SOD1 expression in NP-40-insoluble fraction (P2), showing the accumulation of insoluble G93A–SOD1 in spinal cord of both neuron-specific and ubiquitous G93A–SOD1 mice (f1). Prolonged exposure revealed the presence of multimeric SOD1 species in the insoluble fraction (arrows in f2). Note in f2 that the lanes of T3T3 mice were exposed longer than the other lanes to obtain comparable signal of multimeric SOD1 species.
ical and pathological features of end-stage G1del mice, including severe weight loss (⬎30% of maximal weight), inability to hang in a hanging wire test (Table 1), loss of grip strength (supplemental Fig. 3, available at www.jneurosci.org as supplemental material), severe locomotor deficits (supplemental Movie 1, available at www.jneurosci.org as supplemental material), loss of motor neurons (Fig. 1h), denervation of neuromuscular synapses (Fig. 1i), and accumulation of insoluble and multimeric mutant SOD1
species (Fig. 2f ). In addition, end-stage T1T3 and T3T3 mice, like end-stage G1del mice, showed the accumulation of argyrophylic neuronal debris not only in the ventral spinal cord (Figs. 1h, 3b) but also throughout the medullary, pontine, and mesencephalic reticular formation up to the zona incerta (Fig. 3c,d). Silver staining showed that no degenerative changes did occur in cortex, hippocampus, and striatum despite high levels of neuronal mutant SOD1 expression in these brain areas. Furthermore, T1T3
4 Figure 1. Neuron-specific G93A–SOD1 expression is sufficient to cause motor neuron disease in transgenic mice. a, b, Pronuclear injections of the Thy1.2 expression cassette with G93A–mutant hSOD1 cDNA (a) yielded two mouse lines (T1, T3) with high G93A–SOD1 expression in the spinal cord as determined by immunoperoxidase histochemistry with an hSOD1-specific antibody (b). c, Western blot with human SOD1-preferring antibody (SOD100) shows that T1 and T3 mice express G93A–SOD1 throughout the CNS but not in other tissues. d, Confocal immunofluorescence of T1T3 mouse spinal cord section shows that hSOD1 immunoreactivity does not codistribute with astroglial (GFAP) and oligodendroglial (␣B-crystallin) staining. e, Representative blot (e1) and bar graph (e2) of quantitative Western blot analysis of mutant SOD1 expression in spinal cord of hemizygote and homozygote T3 mice compared with the ubiquitous G93A–SOD1-expressing G1del mice. Values represent means ⫾ SE; n ⫽ 3. f, Age of disease onset and end stage of T1T3 (f1) and T3T3 (f2) neuron-specific G93A–SOD1 mice. g, Age of disease onset and end stage of neuron-specific G93A–SOD1 mice crossed into ubiquitously wild-type hSOD1-expressing mice. h, End-stage T3T3 and G1del mice show similar loss of motor neurons, accumulation of argyrophylic neuronal debris (Ag staining, h1), and astroglial expression of Hsp25 in ventral spinal cord. Motor neurons were counted in lumbar L4 sections immunoperoxidase stained for ChAT, which is present in all motor neurons, or CGRP, which is expressed in a subset of large motor neurons (h2). Values in the bar graphs represent means ⫾ SE; n ⫽ 3. ***p ⬍ 0.001 compared with nontransgenic mice and presymptomatic transgenic mice, one-way ANOVA with Tukey’s multiple comparison test. i, Analysis of neuromuscular denervation in sections of medial gastrocnemius muscle stained with ␣-bungarotoxin (␣-BTX, motor endplates), anti-VAChT (motor nerve endings), and ␣-hSOD1 (axons and nerve ending). Data are shown as percentage of endplates classified as innervated, denervated, or partially denervated. Scale bars: d, 10 m; h1, 250 m.
Jaarsma et al. • Neuron-Specific SOD1 Mice
2080 • J. Neurosci., February 27, 2008 • 28(9):2075–2088
Table 2. Cellular distribution of ubiquitinated and non-ubiquitinated SOD1 aggregates in neuron-specific and ubiquitous G93A mutant and wild-type hSOD1 transgenic mice Ubiquitinated
G1del Presymptomatic (15–20 weeks) Onset (⬎25 weeks) End (⬎30 weeks) Thy1.2–G93A T1 (104 weeks) T3 (104 weeks) T1T3 Presymptomatic (104 weeks) Symptomatic and end (⬎77 weeks) T3T3 Presymptomatic (40 –70 weeks) Presymptomatic (70 –104 weeks) Onset (⬎60 weeks) End (⬎60 weeks) T3hSOD1 20 weeks Presymptomatic (30 – 40 weeks) Onset (⬎45 weeks) End (62–78 weeks) hSOD1 40 weeks 70 weeks 104 weeks
Non-ubiquitinated
Neurons
Glia
Swollen and vacuolated mitochondria
Somatodendritic (MAP2)
Axon (NFM)
Astrocytes (␣ B-crystallin⫹; GFAP⫹)
Oligodendrocyte (␣ B-crystallin⫹; Rip⫹; GFAP⫺)
⫹⫹⫹ ⫹⫹⫹ ⫹⫹
⫹⫹ ⫹⫹⫹ ⫹⫹
⫺/⫹ ⫹ ⫹
⫺ ⫺/⫹ ⫹⫹
⫺ ⫹ ⫹⫹⫹
⫺ ⫺
⫺ ⫺
⫺ ⫺
⫺ ⫺
⫺ ⫺
⫺ ⫺
⫹ ⫹⫹
⫺ ⫹
⫺ ⫺
⫺ ⫺
⫺ ⫺ ⫺ ⫺
⫺/⫹ ⫹ ⫹⫹ ⫹⫹
⫺ ⫺/⫹ ⫹ ⫹
⫺ ⫺ ⫺ ⫺
⫺ ⫺ ⫺ ⫺
⫹⫹ ⫹⫹⫹ ⫹⫹⫹⫹ ⫹⫹⫹⫹
⫹ ⫹⫹ ⫹⫹ ⫹⫹
⫹ ⫹ ⫹ ⫹
⫺ ⫺ ⫺ ⫺
⫺ ⫹ ⫹⫹⫹⫹ ⫹⫹⫹⫹
⫹⫹ ⫹⫹⫹⫹ ⫹⫹⫹⫹
⫺ ⫺ ⫺
⫺ ⫺/⫹ ⫺/⫹
⫺ ⫺ ⫺
⫺ ⫹ ⫹
Using light and electron microscopic immunoperoxidase histochemistry, confocal immunofluorescence, and postembedding immunogold electron microscopy, we have characterized several intensely hSOD1-immunoreactive structures in G1del mouse spinal cord that appear at different time points. Non-ubiquitinated hSOD1-immunoreactive structures were also immunoreactive for cytochrome c and corresponded to swollen and vacuolated mitochondria (Jaarsma et al., 2001). Ubiquitinated hSOD1 aggregates were either neuronal localized to the dendrites, the soma, or the axon, or glial localized to astrocytes or oligodendrocytes that always are immunoreactive for ␣ B-crystallin. Neuronal aggregates occur before glial aggregates in G1del mice. T1T3 and T3T3 mice only develop neuronal ubiquitinated SOD1 aggregates that are ultrastructurally similar to those in G1del mice. hSOD1 mice develop mitochondrial pathology as well as axonal and oligodendrocytic ubiquitinated SOD1 aggregates, indicating that wild-type hSOD1 may form aggregates in specific structures when expressed at high levels. T3hSOD1 mice develop pathology of both hSOD1 and T3T3 and T1T3 mice, but oligodendrocyte pathology is dramatically increased. ⫺, Absent; ⫹, ⫹⫹, ⫹⫹⫹, ⫹⫹⫹⫹, infrequent, moderate, frequent, and very frequent occurrence, respectively.
and T3T3, similar to G1del mice and other lines of SOD1–ALS mice (Wong et al., 1995; Bruijn et al., 1997), developed signs of reactive gliosis, including the appearance of activated microglial cells (Fig. 4c), as well as increased expression of GFAP (Figs. 4g, 5d) and heat shock protein Hsp25 (Figs. 1h, 5d) in astrocytes and reduced expression of the astrocytic glutamate transporter GLT1 (Fig. 5d). No astrocytic and microglial changes were observed in the cortex, hippocampus, and striatum, consistent with the absence of argyrophillic degeneration in these brain areas and supporting the notion that neuronal degeneration was restricted to the brainstem and spinal cord. Together, these data show that specific neuronal expression of G93A mutant SOD1 is sufficient to trigger an ALS-like motor neuron disease strongly resembling disease phenotypes described in ubiquitous expressing mutant SOD1 mice. Importantly, consistent with neuron-specific expression of mutant SOD1, end-stage Thy1.2–G93A mice show considerable loss of transgenic human SOD1 immunoreactivity in the spinal cord ventral horn (Figs. 1e, 2d, 4g). Differences between neuron-specific and ubiquitous G93A mice Additional analysis revealed a number of differences between Thy1.2–G93A and G1del mice. First, T3T3 and T1T3 mice not only showed a late onset of motor symptoms but also a large variability of symptom onset age (Fig. 1f ). Second, rather than a focal asymmetric onset of motor symptoms as occurring in most G1del mice (Table 1) (supplemental Movie 2, available at www. jneurosci.org as supplemental material) and SOD1–ALS patients
(Sato et al., 2005), T3T3 and T1T3 mice showed relatively diffuse symptom onset, characterized by the coincident onset of weight loss, failure to extend the hindlimbs, and failure to perform normally in a hanging wire test, i.e., a test that strongly depends on normal function of the forelimbs (Table 1). In accord with a nonfocal onset and progression of disease, all Thy1.2–G93A mice showed similar amounts of argyrophylic neuronal debris between left and right, and lumbar and cervical segments (Fig. 3b), whereas G1del mice in many occasions showed significant differences in argyrophylic staining between different parts of the spinal cord (Fig. 3a). Third, electron microscopy revealed that T3T3 and T1T3 mice did not develop mitochondrial swelling and vacuolization (Table 2), which is a dominant pathological feature in G1 and G1del mice (Dal Canto and Gurney, 1995; Jaarsma et al., 2001), as well as in G37R and D90A mutant SOD1 mice (Wong et al., 1995; Bergemalm et al., 2006). Fourth, electron microscopy and confocal immunofluorescence showed that Thy1.2–G93A mice did not develop SOD1 aggregates in glia (Table 2), whereas G1del mice, in accord with previous reports (Dal Canto and Gurney, 1997; Stieber et al., 2000), developed ubiquitinated SOD1 aggregates in both astrocytes and oligodendrocytes (Table 2). We showed that, in G1del mice, both astroglial and oligodendroglial aggregates were strongly immunoreactive for ␣B-crystallin (Figs. 4, 5), a small heat shock protein that in control spinal cord is selectively associated with oligodendrocytes but in G1del mice also was expressed in some astrocytes (Figs. 4h,i, 5c, Table 2). In addition, G1del mice showed a large increase of the level of detergent-insoluble ␣B-crystallin (Fig. 5d). In contrast, Thy1.2–
Jaarsma et al. • Neuron-Specific SOD1 Mice
J. Neurosci., February 27, 2008 • 28(9):2075–2088 • 2081
Figure 3. Distribution of argyrophylic degeneration in neuron-specific and ubiquitous G93A–SOD1 mice correlate with symptoms. Silver degeneration staining visualizing the distribution of neuronal degeneration in ubiquitous (G1del) and neuron-specific (T3T3, T1T3, T3hSOD1) G93A–SOD1 mouse models. Presymptomatic mice show no or very little argyrophylic staining (a1, b1, b2, c1), but levels of argyrophylic staining increase in parallel with the severity of symptoms. Argyrophylic staining accumulates in the spinal cord ventral horn as well in supraspinal CNS regions, including the medullary (MedRF in c2, c3), pontine and mesencephalic reticular formation (MesRF in D1), and the zona incerta (ZI in d1– d3). In mice with focal asymmetric symptoms, also argyrophylic staining is distributed focally in the part of the spinal cord corresponding to the affected limb. For instance, a G1del mouse killed shortly after the onset of motor problems in its left hindlimb selectively shows a high level of argyrophylic degeneration in the left lumbar spinal cord and low staining levels in the right lumbar and cervical cord (a2). Animals killed in later phases of disease also show staining in the contralateral side and at cervical levels (a3, a4 ). Mice with forelimb onset may reach end-stage disease with relatively preserved hindlimb function and concomitant low levels of neuronal degeneration at lumbar levels (a5). T1T3, T3T3, and T3hSOD1 mice never showed focal symptom onset and progression of disease and accordingly show similar amounts of argyrophylic staining between left and right, and lumbar and cervical segments (b2– b5). Section in c and d correspond to plates 89 (c1, c3), 85 (c2), 54 (d1), 48 (d2), and 44 (d3) of the mouse brain atlas of Paxinos and Franklin (2001). CA3, CA3 hippocampal subfield; Cb, cerebellum; DG, dentate gyrus; Po, posterior thalamic nuclei; Sol, nucleus of the solitary tract; Sp5, spinal trigeminal nucleus; VPM, ventral posteromedial thalamic nucleus. Scale bars: b1, c1, 500 m.
2082 • J. Neurosci., February 27, 2008 • 28(9):2075–2088
Jaarsma et al. • Neuron-Specific SOD1 Mice
(Fig. 5d), indicating that changes in ␣Bcrystallin localization in G1del mice depend on glial mutant SOD1 expression. Dendritic ubiquitinated SOD1 aggregates represent the dominant pathological structure in neuronspecific G93A mice We have shown previously in G1del mice that the appearance of cytosolic ubiquitinated SOD1 aggregates in dendrites precedes subsequent degeneration of motor neurons (Vlug et al., 2005). Because dendritic ubiquitination also has been identified as an early feature in other ubiquitous SOD1–ALS mouse and rat models carrying different mutations (Bruijn et al., 1997; Wang et al., 2005; Jonsson et al., 2006b), it may represent a dominant pathological feature in SOD1–ALS. Accordingly, immunohistochemistry with antibodies to polyubiquitinated epitopes showed that all symptomatic Thy1.2–G93A and the majority (six of eight) of presymptomatic Thy1.2–G93A mice older than 40 weeks showed ubiquitin-immunoreactive neuritic profiles (Fig. 6, Table 2). Doublelabeling confocal immunofluorescence showed that ubiquitin immunoreactivity mostly codistributed with the somatodendritic microtubule-associated protein MAP2 (Fig. 6, Table 2), infrequently with neurofilament-M, which outlines axonal profiles (Table 2), and, as stated before, never with ␣B-crystallin and glial markers (Fig. 5b). In presymptomatic Thy1.2– G93A mice, ubiquitin immunoreactivity was predominantly associated with thin dendritic processes (Fig. 6g), whereas in symptomatic mice labeling also occurred Figure 4. Neuron-specific G93A–SOD1 mice, like ubiquitous G93A mice, show signs of microgliosis and astrogliosis, but do not in thicker proximal dendritic profiles that, develop glial SOD1 aggregates. a– d, Murine CR3 staining of resting and activated microglia (brown) in thionin counterstained in many occasions, could be traced back to (blue) lumbar L4 –ventral horn showing the presence of activated microglia (arrows in c, d) in spinal cord of end-stage neuron- the neuronal cell bodies (Fig. 6h). Signifispecific (T3T3) and ubiquitous (G1del) G93A–SOD1 mice. e– h, Triple-labeling confocal immunofluorescence of GFAP, ␣B- cantly, as in G1del mice (Vlug et al., 2005), crystallin, and hSOD1 in lumbar spinal cord sections showing that end-stage T3T3 mice (g), like end-stage G1del mice (h), show motor neurons with ubiquitin staining in increased GFAP immunoreactivity indicative of astrogliosis (g1, h1) but, unlike G1del mice, do not show increased ␣B-crystallin proximal dendrites also showed multiple immunoreactivity (g2, h2). Intensely ␣B-crystallin labeled structures in G1del mice usually are strongly immunoreactive for features of ill health, including a flattened transgenic human mutant SOD1 (arrows and arrowheads in h) and occasionally codistribute for GFAP (arrows in h). ␣B-Crystallinand hSOD1-positive, but GFAP-negative, structures (arrowheads in h) represent SOD1 aggregates in oligodendrocytes (see also eccentric nucleus (Fig. 6h), fragmented Figs. 5, 7). Asterisks in c3 indicate a vacuolated mitochondrion, which is outlined by a halo of intense hSOD1 immunoreactivity (see Golgi apparatus (data not shown), and also Jaarsma et al., 2001). Note in g that end-stage T3T3 mice show loss of hSOD1 in parallel with increased GFAP staining, ATF3 expression (data not shown). Postembedding immunogold electron consistent with neuronal degeneration and neuron-specific expression of mutant SOD1. Also note that, because of higher hSOD1 levels in G1del mice, the hSOD1 signal in h3 has been scanned at lower detector sensitivity compared with e3– g3 to avoid microscopy showed that the dendritic agsaturation of the image. i, ␣B-Crystallin immunoperoxidase electron micrograph of an astroglial SOD1 aggregate in end-stage gregates in Thy1.2–G93A mice as in G1del G1del mouse. The astrocyte with the aggregate is outlined by color coding the surrounding neuropil (Nu). Astroglial SOD1 mice (Vlug et al., 2005) always were aggregates consist of disorganized filamentous material, which, in accord with confocal immunofluorescent images (arrow in h), strongly immunoreactive for both ubiqare immunoreactive for ␣B-crystallin (arrow in i2). Note GFAP filaments right from dashed line in i2. Scale bars: a, 20 m; e4, 10 uitin and human SOD1 and consisted of m; i1, 3 m. disorganized ensembles of filamentous material, frequently contained vesicular structures, and often were surrounded by G93A mice did not show astroglial ␣B-crystallin expression (Fig. mitochondria (Fig. 6i– k). Aggregates in distal dendrites in gen4g), codistribution of ␣B-crystallin and ubiquitin (Fig. 5b, Table eral were loosely packed (Fig. 6i,j), whereas larger aggregates in 2), (supplemental Table 1, available at www.jneurosci.org as supproximal dendrites were more densely packed, showing cores plemental material), or increased levels of insoluble ␣B-crystallin with high levels of electron-dense proteinaceous material as well
Jaarsma et al. • Neuron-Specific SOD1 Mice
J. Neurosci., February 27, 2008 • 28(9):2075–2088 • 2083
Wild-type hSOD1 overexpression facilitates the formation of dendritic ubiquitinated SOD1 aggregates in neuron-specific G93A mice It has been shown that high-level expression of wild-type SOD1 facilitates the development of motor neuron degeneration in ubiquitous mutant SOD1-expressing mice (Jaarsma et al., 2000; Deng et al., 2006). To examine whether this facilitating effect operates on mutant SOD1 in neurons, hemizygote T3 mice were crossed with transgenic mice ubiquitously expressing high levels of wild-type human SOD1 (hSOD1 mice). All T3hSOD1 mice developed signs of muscle weakness at ⬃1 year of the age and reached end-stage disease, characterized by motor neuron loss and muscle denervation before 80 weeks of age (Fig. 1g–i, Table 1). T3hSOD1 mice developed ubiquitinated dendritic SOD1 aggregates that were ultrastructurally similar to those in G1del and Thy1.2–G93A mice (data not shown). These aggregates were present at a remarkably early age, i.e., 15–20 weeks (Fig. 6f, Table 2), which is around the same age of appearance as dendritic aggregates in G1del mice expressing higher levels of G93A–SOD1 and much earlier than in T1T3 and T3T3 mice. Importantly, hSOD1 mice never show dendritic ubiquitinated SOD1 aggregates (Table 2) (Jaarsma et al., 2000), indicating that the formation of dendritic ubiquitinated SOD1 aggregates in T3hSOD1 mice depends on the presence of mutant SOD1. In summary, these data indicate that highlevel wild-type hSOD1 overexpression also facilitates motor neuron degeneration when mutated SOD1 expression is restricted to neurons. Figure 5. Neuron-specific G93A–SOD1 mice do not show increased levels of insoluble ␣B-crystallin and ␣B-crystallin-positive ubiquitinated structures. a– c, Double-labeling confocal immunofluorescence shows that ubiquitin immunoreactivity in endstage neuron-specific G93A–SOD1 mice (T3T3) never codistributes with ␣B-crystallin (arrowheads in b). In contrast, ubiquitous G93A–SOD1 (G1del) mice frequently show intense ␣B-crystallin labeling of ubiquitinated structures (arrows in c). These ␣Bcrystallin-positive ubiquitinated structures represent glial ubiquitinated SOD1 aggregates (see also Figs. 4, 7). d, Western blot analysis of the small heat shock proteins ␣B-crystallin and Hsp25 and the astroglial proteins GFAP and GLT1 in total spinal cord homogenate (S1) and 0.5% NP-P40-insoluble pellet (P2) of nontransgenic, T3, T3T3, and G1del mice. Note that insoluble ␣Bcrystallin levels are strongly increased in symptomatic G1del mice. End-stage T3T3 show a small increase of insoluble ␣B-crystallin levels, which was similar to increased insoluble ␣B-crystallin levels in aged nontransgenic and T3 mice. Large increases of total and insoluble Hsp25 occurred in both end-stage G1del and T3T3 mice, consistent with astroglial induction of Hsp25 expression as shown in Figure 1 h. End-stage G1del and T3T3 mice also showed increased GFAP and a trend (nonsignificant; one-way ANOVA) of reduced GLT-1 expression. Values represent means ⫾ SE; n ⫽ 3. *p ⬍ 0.05, **p ⬍ 0.01, ***p ⬍ 0.001 compared with 20-week-old nontransgenic mice; #p ⬍ 0.05 compared with 104-week-old nontransgenic mice (one-way ANOVA, Tukey’s multiple comparison test).
as high levels of vesicular structures (Fig. 6k). Notably, in addition to these heterogeneous dendritic aggregates, in some neurons of symptomatic T3T3 mice, we also identified homogenous compact filamentous ubiquitinated SOD1 aggregates that were not associated with vesicular structures (supplemental Fig. 4, available at www.jneurosci.org as supplemental material).
Massive wild-type hSOD1 aggregation in oligodendrocytes of neuron-specific G93A mice crossed with hSOD1overexpressing mice Surprisingly, T3hSOD1 mice in addition to dendritic aggregates also showed a very high level of ubiquitinated SOD1 aggregates in oligodendrocytes, appearing from symptom onset (Fig. 6f, Table 2). These aggregates showed the same characteristics as oligodendrocytic aggregates in G1del, i.e., they were intensely immunoreactive for ␣B-crystallin, enclosed by the oligodendroglial marker RIP but immunonegative for astrocyte (GFAP), microglial (CR3), and neuronal (MAP2, NFM) markers (Fig. 7c–i, Table 2). The aggregates were localized to the cell body or processes of the oligodendrocytes and ultrastructurally consisted of 11- to 14nm-thick randomly oriented filaments, (Fig. 7j–l ). Importantly, these oligodendrocyte aggregates also were present in the spinal cord of aged hSOD1 mice (⬎70 weeks) (Table 2), albeit at a
Jaarsma et al. • Neuron-Specific SOD1 Mice
2084 • J. Neurosci., February 27, 2008 • 28(9):2075–2088
considerably lower number (Figs. 6c, 7b). This indicates that high-level expression of wild-type SOD1 by it self is sufficient to induce ubiquitinated SOD1 aggregates in oligodendrocytes but that this process is facilitated in T3 hSOD1 mice. Of note, the presence of oligodendrocyte aggregates in T3hSOD1 mice (as well as in hSOD1 and G1del mice) always was accompanied by the occurrence of axonal degeneration, indicating a link between axonal degeneration and oligodendrocyte aggregates. As indicated in Table 2, neither T3hSOD1 mice nor hSOD1 mice did develop SOD1 aggregates in astrocytes, indicating that aggregate formation in these cells cannot be mimicked by high wild-type SOD1 concentrations and, like the dendritic aggregates in motor neurons, depend on the presence of mutant SOD1 (Table 2).
Discussion In this study, we show that transgenic mice expressing G93A-mutant SOD1 specifically in neurons develop an ALS-like disease characterized by the loss of motor neurons and muscle denervation. Our data conclusively show that mutant SOD1 expression in neurons is sufficient to cause motor neuron disease in vivo. Previous studies with ubiquitous mutant SOD1 transgenic mice have shown that downregulation of mutant SOD1 specifically in neurons by either RNA interference (Ralph et al., 2005) or Cre/Lox (Boillee et al., 2006b) delays symptom onset and prolongs survival. In accord with our data, these studies provide in vivo evidence that toxic actions of mutant SOD1 in neurons are important in SOD1–ALS pathogenesis, but, because the mice in these studies continue to express high levels of mutant SOD1 in glia, these studies leave open the question whether the presence of mutant 4
Figure 6. Dendritic ubiquitinated SOD1 aggregates are the dominant pathological feature preceding motor neuron degeneration in neuron-specific G93A–SOD1 mice. a–f, Immunoperoxidase labeling of ubiquitin immunoreactivity in the ventral horn (VH) of L4 spinal cord sections of neuron-specific G93A–SOD1 mice (d, T3T3), ubiquitous G93A–SOD1 mice (e, G1del), wild-type hSOD1-overexpressing mice (c), and double-transgenic T3hSOD1 mice (f). In T3T3 mice, ubiquitin immunoreactivity is associated with neurite-like structures (arrowheadsind)andneuronalsomatawitharelativelymodestincreaseinthenumberoflabeledstructuresthroughoutdiseaseprogression. In G1del mice, ubiquitin immunoreactivity is predominantly associated with neurite-like structures in early stages of disease (arrowheads in e1, e2), but the amount of ubiquitin-immunoreactive structures increases progressively in late phases of disease attributable to theappearanceofglialubiquitinatedSOD1aggregates(smallarrowine3)(seealsoFigs.4,5).AlsoT3hSOD1miceshowneuriticubiquitin immunoreactivity in presymptomatic stages, but, from symptom onset, T3hSOD1 mice show dramatic high levels of ubiquitin immunoreactivity resulting from oligodendrocytic SOD1 aggregates, which have a dot-like appearance in immunoperoxidase-stained sections (small arrows in f2, f3) (see also Fig. 7). In old hSOD1 mice, ubiquitin labeling was exclusively associated with these dot-like oligodendrocyte aggregates (arrows in c) and never occurred in neuronal profiles. Ubiquitinated structures were never observed in 2-year-old nontransgenicandhemizygoteT3mice.vlfu,Ventrolateralfuniculus.g,h,Double-labelingconfocalimmunofluorescenceshowsthatneuritic ubiquitinimmunoreactivityinT3T3micecodistributeswithMAP2immunoreactivityconsistentwithadendriticlocalization.Noteinhthat
the motor neuron with ubiquitin immunoreactivity in the proximal dendrite has a flattened eccentric nucleus suggestive of compromised health. i– k, Postembedding immunogold electron microscopy of ubiquitin and transgenic human SOD1 in aggregates in distal (h, i) and proximal (j) dendrites. Dendritic aggregates predominantly consisted of disorganized filaments (arrowheads in i2, j, k3). Note the presence of mitochondria (m) in close proximity of the aggregates in i and j. Aggregates in proximal dendrites show a higher level of aggregated material in the center (k1, k2) and often contain high levels of vesicular structures at the periphery (j). Note that the postembedding immunogold procedure is relatively inefficient compared with immunoperoxidase histochemistry and immunofluorescence methods producing labeling only in areaswithhighhSOD1andubiquitinconcentrations.Alsonotethat synapses(arrowsini1,j,k1)andmitochondria(m)haveanormal appearanceinthedendriticprofileswithaggregates.Scalebars:c, 50 m; g1, h1, 10 m; i1, j, k1, 500 nm.
Jaarsma et al. • Neuron-Specific SOD1 Mice
J. Neurosci., February 27, 2008 • 28(9):2075–2088 • 2085
duce mutant transgenic SOD1 in spinal cord homogenates at a concentration of ⬃0.2 ng/g protein (Pramatarova et al., 2001), which is lower than in our Thy1.2– G93A mice (0.5 and 1 ng/g for hemizygotes and homozygotes, respectively) and considerably lower than ubiquitous G37R mice generated using genomic constructs (Wong et al., 1995) or a cDNA construct controlled by the prion protein promotor (Wang et al., 2005). Mutant SOD1 concentrations have not been reported for the mice of Lino et al. (2002), which, as in our study, were generated using the Thy1.2 expression construct to drive either G93A or G85R mutant hSOD1 expression. However, Lino et al. (2002) showed that their highest expressing G93A–SOD1 line (line 13) did not influence symptom onset and survival of high-copy Gurney G1 mice (Lino et al., 2002). These results are consistent with our data demonstrating that the T3 transgene had a minimal effect on survival of G1del mice (supplemental Fig. 2, available at www.jneurosci.org as supplemental material). Because other studies have shown that altering neuronal mutant SOD1 levels in ubiquitous mutant SOD1expressing mice has a significant impact on symptom onset (Ralph et al., 2005; Boillee et al., 2006b), these data indirectly indicate that neuronal mutant SOD1 expression levels in their line 13 mice is much lower than in their G1 mice. In summary, the data from previous studies with neuron-specific mutant SOD1 mouse models are consistent with our results with hemizygote T1 and T3 mouse and indicate that mutant SOD1 has to be expressed at sufficiently high levels to trigger motor neuron disease within the normal lifespan of a mouse. Accordingly, the lack of a disFigure 7. Neuron-specific expression of G93A–SOD1 in ubiquitous wild-type hSOD1-overexpressing transgenic mice triggers ease phenotype of some ubiquitous mumassive wild-type hSOD1 aggregation in oligodendrocytes. a–i, Double-labeling confocal immunofluorescence showing high- tant SOD1-expressing lines has been level ubiquitinated structures with a diameter up to 10 m in the spinal cord of symptomatic T3hSOD1 mice. These ubiquitinated linked to insufficient mutant SOD1 exstructures are immunoreactive for ␣B-crystallin (arrow in c, d) and hSOD1 (arrow in i) and surrounded by the oligodendrocyte pression (Deng et al., 2006; Jonsson et al., marker RIP (f ) and do not codistribute with astroglial (GFAP), microglial (CR3), and somatodendritic neuronal (MAP2, e) markers. 2006b). In addition to these oligodendrocyte aggregates, T3hSOD1 show infrequent ␣B-crystallin-negative ubiquitinated structures Neuropathological analysis of our (arrowhead in c) that are immunoreactive for MAP2 (arrowhead in e) consistent with a somatodendritic distribution. Also wildneuron-specific G93A mice point to a sintype hSOD1 mice that do not express the T3 transgene also develop oligodendrocyte aggregates albeit at advanced age (⬎70 gle intracellular defect preceding other deweeks) and at much lower numbers (arrow in b) (see also Fig. 6c,f ). j–l, Standard (j) and postembedding immunogold electron microscopy of oligodendrocyte aggregates (k, l) showing that oligodendrocyte aggregates consist of 11- to 14-nm-thick ran- generative changes, which is the formation of dendritic SOD1 aggregates. Our ultradomly oriented filaments. Scale bars: a1, g1, 20 m; d1, f1, 10 m; j–l, 500 nm. structural data show that these dendritic SOD1 aggregates are associated with disSOD1 in neurons is sufficient to develop disease (Ralph et al., organized filaments and high levels of vesicular structures, sug2005; Boillee et al., 2006b). Two previous studies reported on gesting that aggregates disrupt the cytoskeleton and organelle transgenic mice expressing mutant SOD1 selectively in neurons trafficking within motor neuron dendrites. Because we did not that did not develop signs of motor neuron degeneration (Praobserve evidence for other previously reported cellular abnormatarova et al., 2001; Lino et al., 2002). The absence of a disease malities (e.g., mitochondrial abnormalities, early axonal abnorphenotype in these mice may be explained by insufficient mutant malities), we hypothesize that disruption of dendritic trafficking SOD1 expression. For instance, the mice generated by Pramaby SOD1 aggregates may be the major event triggering motor tarova et al. (2001) constructed to express G37R–mutant hSOD1 neuron degeneration. Accordingly, somatodendritic ubiquitinamice under the control of the neurofilament-L promotor protion has been reported for all SOD1–ALS mouse models in the
Jaarsma et al. • Neuron-Specific SOD1 Mice
2086 • J. Neurosci., February 27, 2008 • 28(9):2075–2088
literature (Bruijn et al., 1997; Dal Canto and Gurney, 1997; Stieber et al., 2000; Jonsson et al., 2004; Wang et al., 2005), and aggregates ultrastructurally resembling dendritic aggregates have been documented for human ALS material (Arima et al., 1998; Kato et al., 2000). The precise mechanisms causing their formation and the composition of these aggregates remain to be determined. As shown in the present study, dendritic aggregate formation is facilitated in the context of high wild-type hSOD1 levels, and identifying the mechanism underlying this facilitation may provide novel clues about SOD1–ALS pathogenesis (Furukawa et al., 2006). Several lines of evidence have indicated a pathogenic role of mutant SOD1 in astrocytes (Clement et al., 2003; Di Giorgio et al., 2007; Nagai et al., 2007) and microglia (Beers et al., 2006; Boillee et al., 2006b). Furthermore, the ability of mutant SOD1 to form micrometer scale aggregates in astrocytes, afflict their function, and trigger their degeneration has been demonstrated in SOD1–ALS patients (Kato et al., 1997) and SOD1– ALS transgenic mice (Bruijn et al., 1997; Dal Canto and Gurney, 1997; Pasinelli et al., 2000; Vlug et al., 2005). Having an intimate metabolic relationship with neurons, the malfunction or degeneration of astroglia is likely to facilitate the degeneration of neurons (Faulkner et al., 2004; Maragakis and Rothstein, 2006). Our data demonstrating that neuronspecific expression of mutant SOD1 is sufficient to cause disease do not exclude a role for mutant SOD1 in glia. We have identified a number of differences between our Thy1.2–G93A mice and G1del mice that express G93A–SOD1 ubiquitously. Part of these differences, like the absence of mitochondrial vacuolar pathology, may follow from low-level mutant SOD1 expression because this phenomenon is linked to high SOD1 protein concentrations (Bergemalm et al., 2006) and occurs at low levels in low-expressing ubiquitous G93A–SOD1 lines (lines G20 and G5/G5) (Dal Canto and Gurney, 1995, 1997). Also, the late and highly variable age of motor symptom onset can, at least in part, be explained by relatively low G93A– SOD1 expression levels, because this is also observed in the low-copy ubiquitous G93A–SOD1 lines (Dal Canto and Gurney, 1995, 1997). In contrast, the absence of glial ubiquitinated SOD1 aggregates and the lack of accumulation of ␣Bcrystallin in the detergent-insoluble fraction in our neuronspecific G93A–SOD1 mice can be readily explained by the absence of mutant SOD1 in glia. Also, the diffuse rather than focal onset of motor symptoms in our neuron-specific G93A– SOD1 mice might follow from the absence of mutant SOD1 in glial, which could imply that mutant SOD1 in glia plays a role in the brushfire-like spreading of disease throughout the spinal cord and brainstem. Analysis of the spatiotemporal distribution of astroglial SOD1 aggregates in our G1del mice indicated that these astroglial aggregates appear in a relatively late phase of disease (Table 2), selectively in regions with high levels of neuronal degeneration and prominent astrogliosis. This raises the possibility that astroglial aggregate formation is triggered or facilitated in the context of neuronal degeneration and hence that the disease may spread from neurons to glia. According to such a scenario, astrocytes are able to cope with the presence of mutant SOD1 in normal conditions, but, under stressful conditions such as the context of neuronal degeneration that triggers multiple changes in astrocytes, they become vulnerable to mutant SOD1. Such a scenario is supported by our findings in neuron-specific G93A mice crossed with wild-type hSOD1overexpressing mice, which show massive wild-type hSOD1
aggregation in oligodendrocytes after the onset of neuronal degeneration. As shown in the present study, these oligodendrocyte aggregates also occur at low frequency in old hSOD1 mice (age ⬎70 weeks) (Table 2) and at moderate frequency in symptomatic G1del mice. Because the oligodendrocyte aggregates only occur after the onset of neuronal or axonal degeneration and a dramatic difference is seen in the number of oligodendrocyte aggregates between T3hSOD1 compared with hSOD1 mice despite equal hSOD1 expression, we propose that the formation of oligodendrocyte aggregates depend on both the presence of high levels of SOD1 protein and the context of neuronal degeneration. The reduced levels of oligodendrocyte aggregates in G1del mice compared with T3hSOD1 double-transgenic mice, despite the equal occurrence of axonal and neuronal degeneration, can be explained by reduced transgenic SOD1 protein levels in G1del mice compared with hSOD1 mice (Jaarsma et al., 2000) and may indicate that the formation of oligodendrocyte aggregates depend on high levels of SOD1 protein rather than the presence of mutant SOD1. In summary, our data favor a scenario in which the oligodendrocytes in T3hSOD1 mice in the context of neuronal degeneration show a reduced ability to prevent wildtype hSOD1 from forming aggregates. In summary, on the basis of our data, we propose a pathogenic model in which mutant SOD1 triggers neuronal degeneration, which in turn facilitates aggregate formation and functional deficits in surrounding glia. Such a pathological interplay between neurons and glia could facilitate additional degeneration of neurons and underlie the focal onset and brushfire-like spreading of disease in SOD1–ALS.
References Andersen PM, Sims KB, Xin WW, Kiely R, O’Neill G, Ravits J, Pioro E, Harati Y, Brower RD, Levine JS, Heinicke HU, Seltzer W, Boss M, Brown Jr RH (2003) Sixteen novel mutations in the Cu/Zn superoxide dismutase gene in amyotrophic lateral sclerosis: a decade of discoveries, defects and disputes. Amyotroph Lateral Scler Other Motor Neuron Disord 4:62–73. Arai T, Hasegawa M, Akiyama H, Ikeda K, Nonaka T, Mori H, Mann D, Tsuchiya K, Yoshida M, Hashizume Y, Oda T (2006) TDP-43 is a component of ubiquitin-positive tau-negative inclusions in frontotemporal lobar degeneration and amyotrophic lateral sclerosis. Biochem Biophys Res Commun 351:602– 611. Arima K, Ogawa M, Sunohara N, Nishio T, Shimomura Y, Hirai S, Eto K (1998) Immunohistochemical and ultrastructural characterization of ubiquitinated eosinophilic fibrillary neuronal inclusions in sporadic amyotrophic lateral sclerosis. Acta Neuropathol (Berl) 96:75– 85. Beers DR, Henkel JS, Xiao Q, Zhao W, Wang J, Yen AA, Siklos L, McKercher SR, Appel SH (2006) Wild-type microglia extend survival in PU. 1 knockout mice with familial amyotrophic lateral sclerosis. Proc Natl Acad Sci USA 103:16021–16026. Bergemalm D, Jonsson PA, Graffmo KS, Andersen PM, Brannstrom T, Rehnmark A, Marklund SL (2006) Overloading of stable and exclusion of unstable human superoxide dismutase-1 variants in mitochondria of murine amyotrophic lateral sclerosis models. J Neurosci 26:4147– 4154. Boillee S, Vande Velde C, Cleveland DW (2006a) ALS: a disease of motor neurons and their nonneuronal neighbors. Neuron 52:39 –59. Boillee S, Yamanaka K, Lobsiger CS, Copeland NG, Jenkins NA, Kassiotis G, Kollias G, Cleveland DW (2006b) Onset and progression in inherited ALS determined by motor neurons and microglia. Science 312:1389 –1392. Bruijn LI, Becher MW, Lee MK, Anderson KL, Jemkins NA, Copeland NG, Sisodia SS, Rothstein JD, Borchelt DR, Price DL, Cleveland DW (1997) ALS-linked SOD1 mutant G85R mediates damage to astrocytes and promotes rapidly progressive disease with SOD1-containing inclusions. Neuron 18:327–338.
Jaarsma et al. • Neuron-Specific SOD1 Mice Caroni P (1997) Overexpression of growth-associated proteins in the neurons of adult transgenic mice. J Neurosci Methods 71:3–9. Clement AM, Nguyen MD, Roberts EA, Garcia ML, Boillee S, Rule M, McMahon AP, Doucette W, Siwek D, Ferrante RJ, Brown Jr RH, Julien JP, Goldstein LS, Cleveland DW (2003) Wild-type nonneuronal cells extend survival of SOD1 mutant motor neurons in ALS mice. Science 302:113–117. Dal Canto MC, Gurney ME (1995) Neuropathological changes in two lines of mice carrying a transgene for mutant human Cu,Zn SOD, and in mice overexpressing wild type human SOD: a model of familial amyotrophic lateral sclerosis (FALS). Brain Res 676:25– 40. Dal Canto MC, Gurney ME (1997) A low expressor line of transgenic mice carrying a mutant human Cu,Zn superoxide dismutase (SOD1) gene develops pathological changes that most closely resemble those in human amyotrophic lateral sclerosis. Acta Neuropathol (Berl) 93:537–550. Deng HX, Shi Y, Furukawa Y, Zhai H, Fu R, Liu E, Gorrie GH, Khan MS, Hung WY, Bigio EH, Lukas T, Dal Canto MC, O’Halloran TV, Siddique T (2006) Conversion to the amyotrophic lateral sclerosis phenotype is associated with intermolecular linked insoluble aggregates of SOD1 in mitochondria. Proc Natl Acad Sci USA 103:7142–7147. Di Giorgio FP, Carrasco MA, Siao MC, Maniatis T, Eggan K (2007) Non-cell autonomous effect of glia on motor neurons in an embryonic stem cellbased ALS model. Nat Neurosci 10:608 – 614. Durham HD, Roy J, Dong L, Figlewicz DA (1997) Aggregation of mutant cu/zn superoxide dismutase proteins in a culture model of ALS. J Neuropathol Exp Neurol 56:523–530. Faulkner JR, Herrmann JE, Woo MJ, Tansey KE, Doan NB, Sofroniew MV (2004) Reactive astrocytes protect tissue and preserve function after spinal cord injury. J Neurosci 24:2143–2155. Feng G, Mellor RH, Bernstein M, Keller-Peck C, Nguyen QT, Wallace M, Nerbonne JM, Lichtman JW, Sanes JR (2000) Imaging neuronal subsets in transgenic mice expressing multiple spectral variants of GFP. Neuron 28:41–51. Furukawa Y, Fu R, Deng HX, Siddique T, O’Halloran TV (2006) Disulfide cross-linked protein represents a significant fraction of ALS-associated Cu, Zn-superoxide dismutase aggregates in spinal cords of model mice. Proc Natl Acad Sci USA 103:7148 –7153. Gong YH, Parsadanian AS, Andreeva A, Snider WD, Elliott JL (2000) Restricted expression of G86R Cu/Zn superoxide dismutase in astrocytes results in astrocytosis but does not cause motoneuron degeneration. J Neurosci 20:660 – 665. Gurney ME (1997) The use of transgenic mouse models of amyotrophic lateral sclerosis in preclinical drug studies. J Neurol Sci 152:S67–S73. Gurney ME, Pu H, Chiu AY, Dal Canto MC, Polchow CY, Alexander DD, Caliendo J, Hentati A, Kwon YW, Deng HX, Chen W, Zhai P, Sufit RL, Siddique T (1994) Motor neuron degeneration in mice that express a human Cu,Zn superoxide dismutase mutation. Science 264:1772–1775. Hossaini M, French PJ, Holstege JC (2007) Distribution of glycinergic neuronal somata in the rat spinal cord. Brain Res 1142:61– 69. Jaarsma D, Haasdijk E, Grashorn JAC, Van Duijn W, Verspaget H, London J, Holstege JC (2000) Cu/Zn superoxide dismutase (SOD1) overexpression in mice causes mitochondrial degeneration, axonal degeneration and premature motoneuron death, and accelerates the development of motoneuron disease in mice expressing fALS-mutant SOD1. Neurobiol Dis 7:623– 643. Jaarsma D, Rognoni F, Van Duijn W, Verspaget H, Haasdijk ED, Holstege JC (2001) CuZn superoxide dismutase (SOD1) accumulate in vacuolated mitochondria in transgenic mice expressing amyotrophic lateral sclerosis (ALS)-linked SOD1 mutations. Acta Neuropathol 102:293–305. Johnston JA, Dalton MJ, Gurney ME, Kopito RR (2000) Formation of high molecular weight complexes of mutant Cu, Zn- superoxide dismutase in a mouse model for familial amyotrophic lateral sclerosis. Proc Natl Acad Sci USA 97:12571–12576. Jonsson PA, Ernhill K, Andersen PM, Bergemalm D, Brannstrom T, Gredal O, Nilsson P, Marklund SL (2004) Minute quantities of misfolded mutant superoxide dismutase-1 cause amyotrophic lateral sclerosis. Brain 127:73– 88. Jonsson PA, Graffmo KS, Brannstrom T, Nilsson P, Andersen PM, Marklund SL (2006a) Motor neuron disease in mice expressing the wild type-like
J. Neurosci., February 27, 2008 • 28(9):2075–2088 • 2087 D90A mutant superoxide dismutase-1. J Neuropathol Exp Neurol 65:1126 –1136. Jonsson PA, Graffmo KS, Andersen PM, Brannstrom T, Lindberg M, Oliveberg M, Marklund SL (2006b) Disulphide-reduced superoxide dismutase-1 in CNS of transgenic amyotrophic lateral sclerosis models. Brain 129:451– 464. Kato S, Hayashi H, Nakashima K, Nanba E, Kato M, Hirano A, Nakano I, Asayama K, Ohama E (1997) Pathological characterization of astrocytic hyaline inclusions in familial amyotrophic lateral sclerosis. Am J Pathol 151:611– 620. Kato S, Takikawa M, Nakashima K, Hirano A, Cleveland DW, Kusaka H, Shibata N, Kato M, Nakano I, Ohama E (2000) New consensus research on neuropathological aspects of familial amyotrophic lateral sclerosis with superoxide dismutase 1 (SOD1) gene mutations: inclusions containing SOD1 in neurons and astrocytes. Amyotroph Lateral Scler Other Motor Neuron Disord 1:163–184. Kushner SA, Elgersma Y, Murphy GG, Jaarsma D, van Woerden GM, Hojjati MR, Cui Y, LeBoutillier JC, Marrone DF, Choi ES, De Zeeuw CI, Petit TL, Pozzo-Miller L, Silva AJ (2005) Modulation of presynaptic plasticity and learning by the H-ras/extracellular signal-regulated kinase/synapsin I signaling pathway. J Neurosci 25:9721–9734. Lino MM, Schneider C, Caroni P (2002) Accumulation of SOD1 mutants in postnatal motoneurons does not cause motoneuron pathology or motoneuron disease. J Neurosci 22:4825– 4832. Lobsiger CS, Cleveland DW (2007) Glial cells as intrinsic components of non-cell-autonomous neurodegenerative disease. Nat Neurosci 10:1355–1360. Maatkamp A, Vlug A, Haasdijk E, Troost D, French PJ, Jaarsma D (2004) Decrease of Hsp25 protein expression precedes degeneration of motoneurons in ALS-SOD1 mice. Eur J Neurosci 20:14 –28. Maragakis NJ, Rothstein JD (2006) Mechanisms of disease: astrocytes in neurodegenerative disease. Nat Clin Pract Neurol 2:679 – 689. Nagai M, Re DB, Nagata T, Chalazonitis A, Jessell TM, Wichterle H, Przedborski S (2007) Astrocytes expressing ALS-linked mutated SOD1 release factors selectively toxic to motor neurons. Nat Neurosci 10:615– 622. Neumann M, Sampathu DM, Kwong LK, Truax AC, Micsenyi MC, Chou TT, Bruce J, Schuck T, Grossman M, Clark CM, McCluskey LF, Miller BL, Masliah E, Mackenzie IR, Feldman H, Feiden W, Kretzschmar HA, Trojanowski JQ, Lee VM (2006) Ubiquitinated TDP-43 in frontotemporal lobar degeneration and amyotrophic lateral sclerosis. Science 314:130 –133. Pasinelli P, Brown RH (2006) Molecular biology of amyotrophic lateral sclerosis: insights from genetics. Nat Rev Neurosci 7:710 –723. Pasinelli P, Houseweart MK, Brown Jr RH, Cleveland DW (2000) Caspase-1 and -3 are sequentially activated in motor neuron death in Cu,Zn superoxide dismutase-mediated familial amyotrophic lateral sclerosis. Proc Natl Acad Sci USA 97:13901–13906. Paxinos G, Franklin KBJ (2001) The mouse brain in stereotaxic coordinates. London: Academic. Pramatarova A, Laganiere J, Roussel J, Brisebois K, Rouleau GA (2001) Neuron-specific expression of mutant superoxide dismutase 1 in transgenic mice does not lead to motor impairment. J Neurosci 21:3369 –3374. Ralph GS, Radcliffe PA, Day DM, Carthy JM, Leroux MA, Lee DC, Wong LF, Bilsland LG, Greensmith L, Kingsman SM, Mitrophanous KA, Mazarakis ND, Azzouz M (2005) Silencing mutant SOD1 using RNAi protects against neurodegeneration and extends survival in an ALS model. Nat Med 11:429 – 433. Rosen DR, Siddique T, Patterson D, Figlewicz DA, Sapp P, Hentati A, Donaldson D, Goto J (1993) Mutations in Cu/Zn superoxide dismutase gene are associated with familial amyotrophic lateral sclerosis. Nature 362:59 – 62. Sato T, Nakanishi T, Yamamoto Y, Andersen PM, Ogawa Y, Fukada K, Zhou Z, Aoike F, Sugai F, Nagano S, Hirata S, Ogawa M, Nakano R, Ohi T, Kato T, Nakagawa M, Hamasaki T, Shimizu A, Sakoda S (2005) Rapid disease progression correlates with instability of mutant SOD1 in familial ALS. Neurology 65:1954 –1957. Shaw BF, Valentine JS (2007) How do ALS-associated mutations in superoxide dismutase 1 promote aggregation of the protein? Trends Biochem Sci 32:78 – 85. Stieber A, Gonatas JO, Gonatas NK (2000) Aggregates of mutant protein
2088 • J. Neurosci., February 27, 2008 • 28(9):2075–2088 appear progressively in dendrites, in periaxonal processes of oligodendrocytes, and in neuronal and astrocytic perikarya of mice expressing the SOD1(G93A) mutation of familial amyotrophic lateral sclerosis. J Neurol Sci 177:114 –123. Vlug AS, Teuling E, Haasdijk ED, French P, Hoogenraad CC, Jaarsma D (2005) ATF3 expression precedes death of spinal motoneurons in amyotrophic lateral sclerosis-SOD1 transgenic mice and correlates with c-Jun phosphorylation, CHOP expression, somato-dendritic ubiquitination and Golgi fragmentation. Eur J Neurosci 22:1881–1894. Wang J, Xu G, Slunt HH, Gonzales V, Coonfield M, Fromholt D, Copeland NG, Jenkins NA, Borchelt DR (2005) Coincident thresholds of mutant protein for paralytic disease and protein aggregation caused by
Jaarsma et al. • Neuron-Specific SOD1 Mice restrictively expressed superoxide dismutase cDNA. Neurobiol Dis 20:943–952. Wong PC, Pardo CA, Borchelt DR, Lee MK, Copeland NG, Jenkins NA, Sisodia SS, Cleveland DW, Price DL (1995) An adverse property of a familial ALS-linked SOD1 mutation causes motor neuron disease characterized by vacuolar degeneration of mitochondria. Neuron 14:1105–1116. Zetterstrom P, Stewart HG, Bergemalm D, Jonsson PA, Graffmo KS, Andersen PM, Brannstrom T, Oliveberg M, Marklund SL (2007) Soluble misfolded subfractions of mutant superoxide dismutase-1s are enriched in spinal cords throughout life in murine ALS models. Proc Natl Acad Sci USA 104:14157–14162.