The Journal of Neuroscience, August 13, 2014 • 34(33):10975–10981 • 10975
Systems/Circuits
Neurovascular Coupling and Decoupling in the Cortex during Voluntary Locomotion Bing-Xing Huo (霍冰星),1 Jared B. Smith,1 and Patrick J. Drew1,2 1Center for Neural Engineering, Department of Engineering Science and Mechanics, and 2Department of Neurosurgery, Pennsylvania State University, University Park, Pennsylvania 16802
Hemodynamic signals are widely used to infer neural activity in the brain. We tested the hypothesis that hemodynamic signals faithfully report neural activity during voluntary behaviors by measuring cerebral blood volume (CBV) and neural activity in the somatosensory cortex and frontal cortex of head-fixed mice during locomotion. Locomotion induced a large and robust increase in firing rate and gamma-band (40 –100 Hz) power in the local field potential in the limb representations in somatosensory cortex, and was accompanied by increases in CBV, demonstrating that hemodynamic signals are coupled with neural activity in this region. However, in the frontal cortex, CBV did not change during locomotion, but firing rate and gamma-band power both increased, indicating a decoupling of neural activity from the hemodynamic signal. These results show that hemodynamic signals are not faithful indicators of the mean neural activity in the frontal cortex during locomotion; thus, the results from fMRI and other hemodynamic imaging methodologies for studying neural processes must be interpreted with caution. Key words: frontal cortex; hemodynamic; imaging; locomotion; neurovascular coupling; somatosensory cortex
Introduction Increases in cortical neural activity are thought to drive a corresponding hemodynamic response, consisting of increased blood flow, oxygenation, and volume (Kim and Ogawa, 2012). This correlation between changes in neural activity and hemodynamic signals is known as neurovascular coupling. Despite the fact that interpreting the results of fMRI and other hemodynamic imaging methods critically depends on having a detailed understanding of neurovascular coupling, our knowledge of the relationship between neural activity and hemodynamic signals is still limited (Logothetis, 2008). Studies have shown that the hemodynamic response is most correlated with gamma-band power in the local field potential (LFP) and, to a lesser extent, the multiunit activity (MUA) (Logothetis et al., 2001; Niessing et al., 2005; Scho¨lvinck et al., 2010). Several recent studies have challenged the linkage between neural activity and subsequent cerebral hemodynamic response. Electrical stimulation of the forepaw in anesthetized rodents produces a slight increase in the ipsilateral cortical spiking activity, along with a small decrease in total cerebral blood volume (CBV; Received March 10, 2014; revised June 19, 2014; accepted July 4, 2014. Author contributions: B.-X.H., J.B.S., and P.J.D. designed research; B.-X.H. and J.B.S. performed research; B.-X.H. contributed unpublished reagents/analytic tools; B.-X.H. and P.J.D. analyzed data; B.-X.H., J.B.S., and P.J.D. wrote the paper. This work was supported by an award from the American Heart Association; a Scholar award from the McKnight Endowment Fund for Neuroscience; and National Institutes of Health (NIH) Grants R01NS078168 and R01NS079737 to P.J.D., and American Recovery and Reinvestment Act stimulus funds through NIH Grant NS070701. The authors declare no competing financial interests. Correspondence should be addressed to Patrick J. Drew, Department of Engineering Science & Mechanics, Department of Neurosurgery, W-317 Millennium Science Complex, Pennsylvania State University, University Park, PA 16802. E-mail:
[email protected]. DOI:10.1523/JNEUROSCI.1369-14.2014 Copyright © 2014 the authors 0270-6474/14/3410975-07$15.00/0
Devor et al., 2008). Monkeys trained on a fixation task showed an increase in anticipatory blood flow without corresponding changes in neural activity in the visual cortex (Sirotin and Das, 2009), although this result is controversial (Kleinschmidt and Mu¨ller, 2010; Handwerker and Bandettini, 2011). Other studies have also found disconnections between neural activity and hemodynamic signals in the brain (Norup Nielsen and Lauritzen, 2001; Ceasar et al., 2003; Jukovskaya et al., 2011; Mishra et al., 2011). These results call for a revisiting of the assumption that cerebral hemodynamic signals reliably report local neural activity. Knowing whether neurovascular coupling is consistent across different brain regions is especially important for understanding the signals obtained from human fMRI experiments, where most studies target regions outside sensory cortex and frequently involve volitional behaviors. In particular, task-related decreases in hemodynamic signals in frontal cortex (FC) and other nonprimary sensory areas have been interpreted as decreased neural activity in human fMRI experiments (Fox and Raichle, 2007; Buckner et al., 2008). The anticorrelation between hemodynamic signals in frontal areas and other brain regions has been used to argue that the brain is organized into anticorrelated networks (Fox et al., 2005). The interpretation of these experiments hinges on whether cerebral hemodynamic signals in the frontal cortex report local neural activity accurately. Here, we tested the hypothesis that the cerebral hemodynamic signal faithfully reports local cortical neural activity during voluntary behavior. Locomotion drives robust increases in neural activity in the limb representations in the somatosensory cortex (Chapin and Woodward, 1981; Dombeck et al., 2007) and the motor cortex (Armstrong and Drew, 1984; Dombeck et al., 2009). We measured neural activity and CBV in the somatosen-
10976 • J. Neurosci., August 13, 2014 • 34(33):10975–10981
Huo et al. • Neural Activity Without a Hemodynamic Response
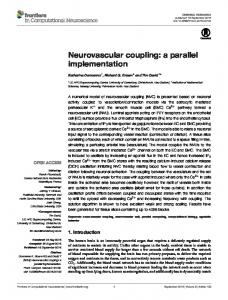
Figure 1. A, Experimental setup for CBV imaging. B, Cytochrome oxidase processing of layer IV of cortex was used to reveal the body representation in SI (left) and to identify surrounding cortical areas in the thinned-skull windows (right). Red dot shows the position of bregma. FC, Frontal cortex; FL, forelimb; HL, hindlimb; Lj, lower jaw; N, nose; V, vibrissae. FC was defined as the blue area. C, Images were normalized by a baseline image (left). SI FL/HL area is enclosed by the green polygons, and FC is enclosed by the blue polygons. Darkening indicates an increase in CBV. During locomotion (at 21 s), the averaged fractional change of reflectance, ⌬R/R0, in the SI FL/HL area (green) was larger than in FC (blue). There was no change of CBV in either area when the animal was at rest (at 40 s). Scale bars, 1 mm.
sory cortex and frontal cortex of head-fixed mice during voluntary locomotion. We found robust locomotion-driven increases in neural activity in both areas. But only in the somatosensory cortex was the increase in neural activity accompanied by a change in CBV. These results suggest caution when interpreting hemodynamic signals, or lack thereof, in frontal cortex.
Materials and Methods Animals. All experimental procedures were approved by the Pennsylvania State University Institutional Animal Care and Use Committee. Twenty-one male C57BL/6J mice (The Jackson Laboratory) that were 4 –10 months old were used. Brains were processed for cytochrome oxidase staining (Drew and Feldman, 2009), and the location of somatosensory cortex was then aligned with the imaging windows (Fig. 1B). Surgical procedures. All surgeries were performed under isoflurane anesthesia. One self-tapping 3/32 inch #000 screw (J.I. Morris) was implanted into the skull over the olfactory bulb or frontal lobe and connected to the head-bolt via a midline suture using clear cyanoacrylate cement (catalog #32002, Vibra-Tite) and black dental acrylic resin (catalog #1530, Lang Dental Manufacturing Co.) to minimize skull movements. A titanium head bolt was attached to the skull. For intrinsic imaging, large reinforced thinned-skull windows that spanned frontal and parietal cortices were made either bilaterally (N ⫽ 6) or unilaterally (N ⫽ 2). Detailed window-making procedures are described by Drew et al. (2010). For electrophysiology recordings in a separate set of mice, tungsten stereotrodes were implanted into the FC [N ⫽ 10; 0.5 to ⫹2.3 mm anteroposterior (AP) and 0.0 to ⫹2.0 mm mediolateral (ML)] and/or the forelimb (FL)/hindlimb (HL) representation in primary somatosensory cortex (SI; N ⫽ 6; ⫺1.0 to ⫹0.5 mm AP and ⫹1.0 to ⫹2.5 mm ML), between 800 and 1000 m below the pia, targeting the source of the sustained LFP response (Maier et al., 2011). Experiment setup. The treadmill had 1° of rotational freedom, and was covered with nonabrasive antislip tape (McMaster-Carr). A rotary encoder (catalog #E7PD-720-118, US Digital) quantified the velocity of the mouse (Fig. 1A; Gao and Drew, 2014). Data were collected using custom software written in LabView, version 8.6 (National Instruments). LEDs (530 nm; catalog #M530L2-C1, Thorlabs) with a ⫾10 nm filter (catalog #FB530-10, Thorlabs) were used to illuminate the thinned-skull windows (Bouchard et al., 2009). A CCD camera (Pantera 1M60, Teledyne Dalsa) acquired 256 ⫻ 256 pixel images, with a resolution of 27–37 m/pixel. After habituation, intrinsic data were collected at 3 Hz (for
⬃33 min/trial) or 30 Hz (for ⬃3 min/trial). Movement-related reflectance changes, measured by covering the thinned-skull window with a piece of clay, were ⬍0.3% peak to peak. Stereotrodes (50 –150 k⍀ impedance at 1 kHz) were made from a pair of Teflon-coated tungsten microwires (catalog #795500, A-M Systems). Differential electrical signals were amplified (DAM80, World Precision Instruments), bandpass filtered between 1 Hz and 10 kHz (model 440, Brownlee Precision), and digitized at 30 kHz for 10 min/trial. LFP signals were obtained by bandpass filtering the data between 1 Hz and 300 Hz. MUA was obtained by bandpass filtering the data between 300 Hz and 5 kHz. One electrode in FC did not have an MUA signal and was excluded from the MUA analysis. Data analysis. All data analyses were performed in Matlab (MathWorks). All summary data were reported as the mean ⫾ SD. All statistical tests using “ANOVA” referred to one-way ANOVA, unless otherwise specified. All p values were Bonferroni corrected for multiple comparisons. To identify locomotion events, velocity was first low-pass filtered at 10 Hz. Acceleration was calculated as the first derivative. The absolute value of acceleration was then binarized according to the following equation:
␦ 关 t 兴 ⫽ H 共 a t ⫺ a c兲 ⫽
if a ⱖ a ; , 再 1,0, otherwise t
c
where the threshold acceleration ac was 1 ⫻ 10 ⫺6 m/s 2, at was the instantaneous acceleration at time t, and H(●) was the Heavyside function. We then converted the binarized acceleration signal ␦[t] to binary locomotion events, s(t⬘), which had the same temporal resolution as the simultaneous intrinsic imaging signal. We set s(t⬘) to 1, representing a locomotion event, if at least 10% of ␦[t] within the time spanned by a single intrinsic imaging frame was 1. Otherwise s(t⬘) ⫽ 0, representing a resting event. If two consecutive locomotion events occurred within 1 s, the time elapsed in between was considered as a continuous locomotion period. For intrinsic images, a 10 s period of rest was used to calculate the baseline image R0 for all trials on the same day (Fig. 1C). Each movie frame was divided by the corresponding pixel in the baseline image to calculate fractional change from the baseline: ⌬R/R0 ⫽ (R ⫺ R0)/R0. ⌬R/R0 values were then mean subtracted and low-pass filtered at 1 Hz. Regions of interest (ROIs) were selected to enclose either the FL/HL representation in SI or the FC (Fig. 1 B, C). The fractional reflectance change of each ROI was calculated as the average ⌬R/R0 of all pixels.
Huo et al. • Neural Activity Without a Hemodynamic Response
J. Neurosci., August 13, 2014 • 34(33):10975–10981 • 10977
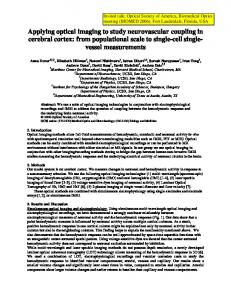
Figure 2. A, Locations of recording sites corresponding to SI FL/HL representation (green, N ⫽ 6) and FC (blue, N ⫽ 10). Red dot represents bregma. Scale bar, 1 mm. B, Power spectrogram of LFP recordings over a sample of 60 s in FC. The electrode site is shown as blue dot with black outline in A. Locomotion events are plotted as gray dots above the spectrogram. Gamma-band boundaries are shown in white dotted lines at 40 and 100 Hz, respectively. C, For the same electrode position and recording trial in B, the average power spectra of 5 s bouts of locomotion (dark blue) and rest (light blue) from 0 to 150 Hz. Within the gamma band (gray area), the power during locomotion was significantly higher than during rest. D, For the same electrode position in B, the normalized firing rate for 2 s immediately before and after locomotion initiation (black vertical line). A rate of 1 indicates no change in firing rate from baseline. Locomotion events are shown in gray dots. E, Power spectrogram of LFP recorded from the electrode in SI HL area, shown as a green dot with black outline in A. F, For the same electrode position and recording trial in E, the average power spectra of 5 s bouts of locomotion (dark green) and rest (light green) plotted from 0 to 150 Hz. Within the gamma band (gray area), the power during locomotion was significantly higher than that during rest. G, For the same electrode position in E, the normalized firing rate for 2 s immediately before and after locomotion initiation (black vertical line).
When comparing ⌬R/R0 values at different durations of locomotion, the baseline was subtracted so that ⌬R/R0 ⫽ 0 at the initiation of locomotion. Multitaper power spectra and spectrograms were calculated using the Chronux toolbox (Mitra and Bokil, 2008) with a frequency resolution of 2 Hz. Power spectrograms used a 2 s window (Fig. 2 B, E). Locomotioninduced power gain, AP, was calculated from the ratio between the power spectrum density (PSD) during locomotion, P␥,motion, and the PSD during a same duration of rest, P␥,rest (Fig. 2C,F ), such that AP␥ ⫽ 10 ⫻ log10(P␥,motion/P␥,rest) dB. Gamma-band power gain, AP␥, was then averaged from 40 to 100 Hz, excluding 55– 65 Hz. MUA data were thresholded at 3 SDs, with at least 1 ms of refractory period between consecutive spikes (Drew and Feldman, 2007). The spike train was then convolved with a Gaussian function with a 100 ms SD. To compare behavioral state-dependent neural activity, we selected bouts of locomotion of ⬎2 s, and with at least 3 s of rest immediately beforehand. The firing rate during each bout of locomotion was normalized against the average firing rate between 1 and 3 s before locomotion initiation.
Results Region-specific hemodynamic responses during locomotion We imaged the intrinsic optical signal of mice that were head fixed on a spherical treadmill (Fig. 1A) through a thinned-skull window that spanned frontal and parietal cortices (Fig. 1B). Decreases in fractional reflectance from baseline (⌬R/R0) corresponded to increases in CBV. During periods when the mouse was stationary, we observed global, low-frequency (⬍1 Hz) fluctuations in reflectance (Fig. 1C), which is consistent with previous reports of fluctuations in hemodynamic signals in rodents (Mayhew et al., 1996; Drew et al., 2011) and humans (Biswal et al., 1995). During locomotion, we observed regionally specific decreases in ⌬R/R0. When the mouse initiated voluntary locomotion, we observed a large and fast decrease in ⌬R/R0 in the FL/HL representation in the SI (Fig. 1C). The nominal locomotion-induced reflectance decreases in FL/HL areas (approximately ⫺5%) were substantially stronger than spontaneous oscillations (⬍2% peak
to peak), heart rate modulations (⬍1% peak to peak), or changes in reflectance due to motion (⬍0.3% peak to peak). However, there was little to no change in reflectance in the FC (Fig. 1C). Neural activity increases in both sensory and frontal cortices during locomotion To test whether this region-specific ⌬R/R0 response was correlated with local neural activity, we recorded the electrical signals in FC and the FL/HL representations (Fig. 2A). During locomotion, we observed a strong increase in gamma-band power in LFP at both sample electrode sites in FC (Fig. 2B) and the HL area (Fig. 2E). We quantified the behavioral state-dependent gammaband activity by calculating the PSD during 5 s periods of locomotion or rest (Fig. 2C,F ). In both the HL area and FC, the gamma-band power during locomotion was significantly higher than the power during rest (two-way ANOVA: F(1,124) ⫽ 152.37, p ⫽ 2.5 ⫻ 10 ⫺23), although the broadband power was significantly higher in the HL area than in FC during locomotion and at rest (two-way ANOVA: F(1,124) ⫽ 58.36, p ⫽ 5 ⫻ 10 ⫺12). There was no significant correlation between gamma-band power and caudal-rostral position (regression coefficient, b ⫽ 0.07 mm; 95% CI ⫽ ⫺0.26 to 0.84; N ⫽ 10), which is consistent with the LFP signal being of local origin. The MUA increased in the FL/HL area and FC during locomotion. At the example site in FC (Fig. 2A), the average firing rate increased by fivefold within 200 ms of locomotion initiation, and remained at 4.3 ⫾ 1.5 times the baseline in the following 2 s of locomotion (ANOVA: F(1,106) ⫽ 267.96, p ⫽ 8 ⫻ 10 ⫺31; Fig. 2D). At the example site in the HL area (Fig. 2A), the average firing rate increased by eightfold within 200 ms of locomotion initiation, and remained at 5.5 ⫾ 1.6 times the baseline in the following 2 s of locomotion (ANOVA: F(1,132) ⫽ 809.89, p ⫽ 3.5 ⫻ 10 ⫺58; Fig. 2G).
Huo et al. • Neural Activity Without a Hemodynamic Response
10978 • J. Neurosci., August 13, 2014 • 34(33):10975–10981
Figure 3. A, Average ⌬R/R0 in SI FL/HL area (green circles) and FC (blue squares) from 0 to 10 s of locomotion. The shaded area showed the SD from the mean across all animals. After Bonferroni correction, ⌬R/R0 in SI FL/HL area was significantly ⬍0 at all durations, while no ⌬R/R0 in FC was significantly different from 0. B, Average AP␥ in SI FL/HL area (green circles) and FC (blue squares) across all animals from 0 to 10 s of locomotion. AP␥ in SI FL/HL area (N ⫽ 6) and FC (N ⫽ 10) was significantly ⬎0 at all durations. C, Average normalized firing rate in SI FL/HL area (N ⫽ 6, green) and FC (N ⫽ 9, blue) within 2 s before and after locomotion initiation (black vertical line).
Coupling and decoupling of neural activity to hemodynamic response We quantified the fractional changes in the intrinsic optical signal, ⌬R/R0, and AP␥ as well as the normalized firing rate immediately before and after locomotion initiation, for different durations of locomotion (Fig. 3). In the FL/HL area, ⌬R/R0 decreased by 4.8 ⫾ 1.8% at 3 s of locomotion, and fluctuated approximately ⫺4.5 ⫾ 1.3% at longer locomotion durations (Fig. 3A). At all locomotion durations, ⌬R/R0 responses were significantly ⬍0 (t test: maximal p ⫽ 4.5 ⫻ 10 ⫺4; N ⫽ 8, from 1 to 10 s), representing a strong Figure 4. A, Fractional change in the intrinsic signal, ⌬R/R , after 5 s of locomotion plotted against A after 5 s of locomotion 0 P␥ CBV increase in response to locomotion. in SI FL/HL area (green ellipse) and FC (blue ellipse). For each ellipse, the radius along the vertical axis is the SD of ⌬R/R0 across all Correspondingly, AP␥ in the FL/HL area animals (N ⫽ 8); the radius along the horizontal axis is the SD of AP␥ across all animals (N ⫽ 6 for SI FL/HL, N ⫽ 10 for FC). The black rapidly reached 2.6 ⫾ 1.1 dB by 1 s of dot in the center of each ellipse represents the average value of ⌬R/R0 and AP␥. B, ⌬R/R0 after 5 s of locomotion (N ⫽ 8) plotted locomotion, and further increased and against the normalized MUA firing rate after 5 s of locomotion in SI FL/HL area (N ⫽ 6, green ellipse) and FC (N ⫽ 9, blue ellipse). fluctuated ⬃4.1 ⫾ 1.6 dB at longer loco- The radii correspond to the SDs across animals. The black dots represent the average values. motion durations (Fig. 3B). At all locoactivity versus the mean change in CBV after 5 s of locomotion motion durations, AP␥ in the FL/HL area was always significantly (Fig. 4). Both the CBV response and neural activity reach a steady ⬎0 (t test: maximal p ⫽ 0.032; N ⫽ 6, from 1 to 10 s). Similarly, state after ⬃5 s of locomotion. Although the average AP␥ in FC the normalized firing rate in the FL/HL area increased to a peak of and SI FL/HL area are significantly different (ANOVA: F(1,13) ⫽ 3.2 ⫾ 1.4 times the baseline within 300 ms of locomotion initia11.88, p ⫽ 0.0043), the distribution of AP␥ in FC across animals tion, and remained at 2.5 ⫾ 1.0 times the baseline for the 2 s of overlaps the distribution of AP␥ in SI FL/HL areas (Fig. 4A). Howlocomotion, significantly ⬎1 (t test: p ⫽ 0.016; N ⫽ 6; Fig. 3C). A ever, the distributions of ⌬R/R0 in FC and SI FL/HL area do not strong increase in local neural activity paired with a strong local overlap (Fig. 4A). Similarly, comparing the average ⌬R/R0 and increase in CBV indicates that during locomotion the hemodynormalized MUA firing rate, while the distributions of normalnamic response is coupled to neural activity in the SI FL/HL area. ized firing rate overlap in FC and SI FL/HL area (Fig. 4B), the In the FC, ⌬R/R0 did not change with any duration of locodistributions of ⌬R/R0 do not overlap (Fig. 4B). The difference of motion (0.2 ⫾ 0.6%, t test: minimal p ⫽ 0.27; N ⫽ 8, from 1 to normalized firing rate between SI FL/HL area and FC is insignif10 s; Fig. 3A). Nevertheless, at all locomotion durations, AP␥ icant after 5 s of locomotion (ANOVA: F(1,12) ⫽ 3.85, p ⫽ responses in the FC were significantly ⬎0 (t test: maximal p ⫽ 0.0735), although they both are significantly ⬎1, as stated above. 0.024; N ⫽ 10, from 1 to 10 s). The average AP␥ increased to 1.4 ⫾ These results show that similar neural activity in FC and SI FL/HL 1.1 dB by 1 s of locomotion, and further increased and fluctuated area trigger very different CBV responses, and a simple linear fit at ⬃2.3 ⫾ 1.6 dB at longer durations (Fig. 3B). The normalized cannot capture the response in both FC and sensory cortex. firing rate in the FC increased to a peak of 2 ⫾ 1.2 times the baseline within 300 ms of locomotion initiation, and remained at 1.6 ⫾ 0.7 times the baseline for 2 s of locomotion, also significantly ⬎1 (t test: p ⫽ 1 ⫻ 10 ⫺4; N ⫽ 9; Fig. 3C). A significant increase of neural activity without a colocalized CBV increase demonstrates neurovascular decoupling in the frontal cortex during locomotion. To visualize the relationship between neural activity and the hemodynamic response, we plotted the mean change in neural
Discussion Previous work has shown widespread increases in neural activity during locomotion (Niell and Stryker, 2010; Polack et al., 2013). We observed a significant increase of gamma-band power and firing rate in both the SI FL/HL representations and frontal cortex (Figs. 2, 3 B, C). The frontal cortex contains limb-related motor areas (Tennant et al., 2011), which is consistent with the increase
Huo et al. • Neural Activity Without a Hemodynamic Response
in neural activity that we observed. We saw a strong decrease of ⌬R/R0 in the FL/HL area, consistent with typical neurovascular coupling. If the hemodynamic signals were proportionally coupled with gamma-band power (Martin et al., 2006; Siero et al., 2013), we would expect to see a decrease in ⌬R/R0 of ⬎1% in the frontal cortex, as the gamma-band power increase during running between the FL/HL area and FC differed by a factor of ⬃3, and there was a ⬎4% decrease in ⌬R/R0 in the FL/HL area. Because we could easily detect spontaneous changes in the ⌬R/R0 in the frontal cortex of ⬍1% (Fig. 1C), our failure to see a hemodynamic signal in the frontal cortex is not due to low sensitivity. In addition, CBV has been shown to correlate more closely with neural activity than oxygenation signal (Duong and Kim, 2000; Sheth et al., 2004a; Birn et al., 2009; Moon et al., 2013), so it is unlikely that the decoupling we observed is due to the use of CBV as a metric. We measured neural activity at infragranular depths, which shows a sustained response in both SI FL/HL and FC, whereas the CBV was measured from the top layer of cortex. Thus, it is possible that the increased neural activity was separate from the hemodynamic changes observed. However, several lines of evidence argue that neural and vascular responses to stimuli increase in parallel across all layers of a cortical column. Multiple studies have shown that stimulus-evoked LFP and MUA responses in sensory cortex show increases across all layers in somatosensory (Di et al., 1990; Einevoll et al., 2007; Herman et al., 2013), auditory (Szymanski et al., 2011), and visual (Xing et al., 2012) cortices. In the frontal cortex, increases in LFP power and neuronal firing rate to vibrissal stimulation in whisker motor cortex have been shown to occur in all layers (Chakrabarti et al., 2008; Quairiaux et al., 2011). Finally, ascending and descending interlaminar excitatory processes have been shown for the motor cortex (Weiler et al., 2008; Shepherd, 2009; Hooks et al., 2011), indicating that our infragranular activity is likely accompanied by an increase in neural activity in the superficial layers of FC. Measures of CBV with MRI, which does not have the depth limitations of optical imaging, have consistently found that CBV increases in deep layers and surface vessels occur in parallel (Jin and Kim, 2008; Hirano et al., 2011; Kim and Kim, 2011; Herman et al., 2013; Huber et al., 2014). There is a report of increases in CBV in deep layers without an increase in superficial vessels in anesthetized monkeys (Goense et al., 2012), but this effect is associated with strong decreases in neural activity (Shmuel et al., 2006), unlike the increases we see in frontal cortex, and this disassociation of the responses of surface and deep vessels does not take place in awake humans (Huber et al., 2014), suggesting that it might be an artifact of anesthesia. Since cerebral arterioles are electrically coupled, with dilations propagating over millimeters (Iadecola et al., 1997; Chen et al., 2011), and arterial dilation rapidly propagates from the deeper layers of cortex to the surface (Tian et al., 2010), it is unlikely that a dilation of deep vessels would not be reflected in the more superficial vessels that we imaged. Last, optogenetic stimulation of layer V pyramidal neurons in somatosensory cortex evokes a robust increase in CBV in the superficial layers and increases in neural activity across all layers (Vazquez et al., 2013), indicating that neural activity in layer V is sufficient to drive dilation of superficial vessels. These studies support the idea that neural activity in the deep and superficial layers of a cortical region increase together, and that this increase leads to an increase in blood volume throughout the depth of the cortex. Thus, the lack of an observable hemodynamic signal in FC during locomotion is not likely due to methodological issues.
J. Neurosci., August 13, 2014 • 34(33):10975–10981 • 10979
There are several nonexclusive possibilities that could account for the observed decoupling of neural activity from the CBV signal in FC. There could be a threshold relationship, where neural activity below some level has no effect on CBV (Sheth et al., 2004b; Martin et al., 2006), and this level is not reached in the FC during this task. However, because neural activity in FC can reach levels comparable to those seen in the FL/HL regions, this threshold would have to be higher in FC than in the FL/HL representation. A difference in threshold is plausible, as different brain regions have different neurovascular coupling relationships (Devonshire et al., 2012). The vasodilation could depend on signaling from astrocytes (Attwell et al., 2010), which are electrically silent. The actual regulation of blood flow could be performed by projections onto the blood vessels from modulatory nuclei (Hamel, 2006; Drew et al., 2008), whose activity varies during locomotion (Polack et al., 2013), changing the neuromodulatory state of the brain. Though neural and vascular densities covary in the brain (Tsai et al., 2009), there are metabolic and neural density differences between different brain regions (Gusnard and Raichle, 2001) that could impact the regulation of blood flow (Gordon et al., 2008). Another possibility could be that vasoconstrictor input overwhelms any vasodilatory effects of neural activity in FC. Potential sources of vasoconstrictive input include the locus ceruleus (Bekar et al., 2012), or vasoconstrictive, somatostatinpositive interneurons (Cauli et al., 2004) that are highly excited by moderate increases in local neural activity (Adesnik et al., 2012), preventing any arterial dilation in FC. Neither of these potential vasoconstrictive mechanisms would be readily discernable in the LFP or MUA. This is not an exhaustive list of possibilities, but many of the proposed mechanisms entail the idea that cerebral blood flow is controlled by cells whose activity is not reflected in population measures. While the detailed mechanisms linking neural activity to changes in cerebral perfusion require further investigation, our results provide evidence that hemodynamic signals in the frontal cortex of mice do not necessarily follow measures of mean neural activity (LFP and MUA) during locomotion.
References Adesnik H, Bruns W, Taniguchi H, Huang ZJ, Scanziani M (2012) A neural circuit for spatial summation in visual cortex. Nature 490:226 –231. CrossRef Medline Armstrong DM, Drew T (1984) Discharges of pyramidal tract and other motor cortical neurones during locomotion in the cat. J Physiol 346:471– 495. Medline Attwell D, Buchan AM, Charpak S, Lauritzen M, Macvicar BA, Newman EA (2010) Glial and neuronal control of brain blood flow. Nature 468:232– 243. CrossRef Medline Bekar LK, Wei HS, Nedergaard M (2012) The locus coeruleusnorepinephrine network optimizes coupling of cerebral blood volume with oxygen demand. J Cereb Blood Flow Metab 32:2135–2145. CrossRef Medline Birn RM, Murphy K, Handwerker DA, Bandettini PA (2009) fMRI in the presence of task-correlated breathing variations. Neuroimage 47:1092– 1104. CrossRef Medline Biswal B, Yetkin FZ, Haughton VM, Hyde JS (1995) Functional connectivity in the motor cortex of resting human brain using echo-planar MRI. Magn Reson Med 34:537–541. CrossRef Medline Bouchard MB, Chen BR, Burgess SA, Hillman EM (2009) Ultra-fast multispectral optical imaging of cortical oxygenation, blood flow, and intracellular calcium dynamics. Opt Express 17:15670 –15678. CrossRef Medline Buckner RL, Andrews-Hanna JR, Schacter DL (2008) The brain’s default network: anatomy, function, and relevance to disease. Ann N Y Acad Sci 1124:1–38. CrossRef Medline Caesar K, Thomsen K, Lauritzen M (2003) Dissociation of spikes, synaptic activity, and activity-dependent increments in rat cerebellar blood flow by
10980 • J. Neurosci., August 13, 2014 • 34(33):10975–10981 tonic synaptic inhibition. Proc Natl Acad Sci U S A 100:16000 –16005. CrossRef Medline Cauli B, Tong XK, Rancillac A, Serluca N, Lambolez B, Rossier J, Hamel E (2004) Cortical GABA interneurons in neurovascular coupling: relays for subcortical vasoactive pathways. J Neurosci 24:8940 – 8949. CrossRef Medline Chakrabarti S, Zhang M, Alloway KD (2008) MI neuronal responses to peripheral whisker stimulation: relationship to neuronal activity in si barrels and septa. J Neurophysiol 100:50 – 63. CrossRef Medline Chapin JK, Woodward DJ (1981) Modulation of sensory responsiveness of single somatosensory cortical cells during movement and arousal behaviors. Exp Neurol 72:164 –178. CrossRef Medline Chen BR, Bouchard MB, McCaslin AF, Burgess SA, Hillman EM (2011) High-speed vascular dynamics of the hemodynamic response. Neuroimage 54:1021–1030. CrossRef Medline Devonshire IM, Papadakis NG, Port M, Berwick J, Kennerley AJ, Mayhew JE, Overton PG (2012) Neurovascular coupling is brain region-dependent. Neuroimage 59:1997–2006. CrossRef Medline Devor A, Hillman EM, Tian P, Waeber C, Teng IC, Ruvinskaya L, Shalinsky MH, Zhu H, Haslinger RH, Narayanan SN, Ulbert I, Dunn AK, Lo EH, Rosen BR, Dale AM, Kleinfeld D, Boas DA (2008) Stimulus-induced changes in blood flow and 2-deoxyglucose uptake dissociate in ipsilateral somatosensory cortex. J Neurosci 28:14347–14357. CrossRef Medline Di S, Baumgartner C, Barth DS (1990) Laminar analysis of extracellular field potentials in rat vibrissa/barrel cortex. J Neurophysiol 63:832– 840. Medline Dombeck DA, Khabbaz AN, Collman F, Adelman TL, Tank DW (2007) Imaging large-scale neural activity with cellular resolution in awake, mobile mice. Neuron 56:43–57. CrossRef Medline Dombeck DA, Graziano MS, Tank DW (2009) Functional clustering of neurons in motor cortex determined by cellular resolution imaging in awake behaving mice. J Neurosci 29:13751–13760. CrossRef Medline Drew PJ, Feldman DE (2007) Representation of moving wavefronts of whisker deflection in rat somatosensory cortex. J Neurophysiol 98:1566 –1580. CrossRef Medline Drew PJ, Feldman DE (2009) Intrinsic signal imaging of deprivationinduced contraction of whisker representations in rat somatosensory cortex. Cereb Cortex 19:331–348. CrossRef Medline Drew PJ, Duyn JH, Golanov E, Kleinfeld D (2008) Finding coherence in spontaneous oscillations. Nat Neurosci 11:991–993. CrossRef Medline Drew PJ, Shih AY, Driscoll JD, Knutsen PM, Blinder P, Davalos D, Akassoglou K, Tsai PS, Kleinfeld D (2010) Chronic optical access through a polished and reinforced thinned skull. Nat Methods 7:981–984. CrossRef Medline Drew PJ, Shih AY, Kleinfeld D (2011) Fluctuating and sensory-induced vasodynamics in rodent cortex extend arteriole capacity. Proc Natl Acad Sci U S A 108:8473– 8478. CrossRef Medline Duong TQ, Kim SG (2000) In vivo MR measurements of regional arterial and venous blood volume fractions in intact rat brain. Magn Reson Med 43:393– 402. CrossRef Medline Einevoll GT, Pettersen KH, Devor A, Ulbert I, Halgren E, Dale AM (2007) Laminar population analysis: estimating firing rates and evoked synaptic activity from multielectrode recordings in rat barrel cortex. J Neurophysiol 97:2174 –2190. CrossRef Medline Fox MD, Raichle ME (2007) Spontaneous fluctuations in brain activity observed with functional magnetic resonance imaging. Nat Rev Neurosci 8:700 –711. CrossRef Medline Fox MD, Snyder AZ, Vincent JL, Corbetta M, Van Essen DC, Raichle ME (2005) The human brain is intrinsically organized into dynamic, anticorrelated functional networks. Proc Natl Acad Sci U S A 102:9673–9678. CrossRef Medline Gao YR, Drew PJ (2014) Determination of vessel cross-sectional area by thresholding in radon space. J Cereb Blood Flow Metab 34:1180 –1187. CrossRef Medline Goense J, Merkle H, Logothetis NK (2012) High-resolution fMRI reveals laminar differences in neurovascular coupling between positive and negative BOLD responses. Neuron 76:629 – 639. CrossRef Medline Gordon GR, Choi HB, Rungta RL, Ellis-Davies GC, MacVicar BA (2008) Brain metabolism dictates the polarity of astrocyte control over arterioles. Nature 456:745–749. CrossRef Medline Gusnard DA, Raichle ME (2001) Searching for a baseline: functional imag-
Huo et al. • Neural Activity Without a Hemodynamic Response ing and the resting human brain. Nat Rev Neurosci 2:685– 694. CrossRef Medline Hamel E (2006) Perivascular nerves and the regulation of cerebrovascular tone J Appl Physiol (1985). 100:1059 –1064. CrossRef Medline Handwerker DA, Bandettini PA (2011) Hemodynamic signals not predicted? Not so: a comment on Sirotin and Das (2009). Neuroimage 55: 1409 –1412. CrossRef Medline Herman P, Sanganahalli BG, Blumenfeld H, Rothman DL, Hyder F (2013) Quantitative basis for neuroimaging of cortical laminae with calibrated functional MRI. Proc Natl Acad Sci U S A 110:15115–15120. CrossRef Medline Hirano Y, Stefanovic B, Silva AC (2011) Spatiotemporal evolution of the functional magnetic resonance imaging response to ultrashort stimuli. J Neurosci 31:1440 –1447. CrossRef Medline Hooks BM, Hires SA, Zhang YX, Huber D, Petreanu L, Svoboda K, Shepherd GM (2011) Laminar analysis of excitatory local circuits in vibrissal motor and sensory cortical areas. PLoS Biol 9:e1000572. CrossRef Medline Huber L, Goense J, Kennerley AJ, Ivanov D, Krieger SN, Lepsien J, Trampel R, Turner R, Mo¨ller HE (2014) Investigation of the neurovascular coupling in positive and negative BOLD responses in human brain at 7T. Neuroimage 97:349 –362. CrossRef Medline Iadecola C, Yang G, Ebner TJ, Chen G (1997) Local and propagated vascular responses evoked by focal synaptic activity in cerebellar cortex. J Neurophysiol 78:651– 659. Medline Jin T, Kim SG (2008) Cortical layer-dependent dynamic blood oxygenation, cerebral blood flow and cerebral blood volume responses during visual stimulation. Neuroimage 43:1–9. CrossRef Medline Jukovskaya N, Tiret P, Lecoq J, Charpak S (2011) What does local functional hyperemia tell about local neuronal activation? J Neurosci 31:1579 –1582. CrossRef Medline Kim SG, Ogawa S (2012) Biophysical and physiological origins of blood oxygenation level-dependent fMRI signals. J Cereb Blood Flow Metab 32:1188 –1206. CrossRef Medline Kim T, Kim SG (2011) Temporal dynamics and spatial specificity of arterial and venous blood volume changes during visual stimulation: implication for BOLD quantification. J Cereb Blood Flow Metab 31:1211–1222. CrossRef Medline Kleinschmidt A, Mu¨ller NG (2010) The blind, the lame, and the poor signals of brain function—a comment on Sirotin and Das (2009). Neuroimage 50:622– 625. CrossRef Logothetis NK (2008) What we can do and what we cannot do with fMRI. Nature 453:869 – 878. CrossRef Medline Logothetis NK, Pauls J, Augath M, Trinath T, Oeltermann A (2001) Neurophysiological investigation of the basis of the fMRI signal. Nature 412: 150 –157. CrossRef Medline Maier A, Aura CJ, Leopold DA (2011) Infragranular sources of sustained local field potential responses in macaque primary visual cortex. J Neurosci 31:1971–1980. CrossRef Medline Martin C, Martindale J, Berwick J, Mayhew J (2006) Investigating neuralhemodynamic coupling and the hemodynamic response function in the awake rat. Neuroimage 32:33– 48. CrossRef Medline Mayhew JE, Askew S, Zheng Y, Porrill J, Westby GW, Redgrave P, Rector DM, Harper RM (1996) Cerebral vasomotion: a 0.1-Hz oscillation in reflected light imaging of neural activity. Neuroimage 4:183–193. CrossRef Medline Mishra AM, Ellens DJ, Schridde U, Motelow JE, Purcaro MJ, DeSalvo MN, Enev M, Sanganahalli BG, Hyder F, Blumenfeld H (2011) Where fMRI and electrophysiology agree to disagree: corticothalamic and striatal activity patterns in the WAG/Rij rat. J Neurosci 31:15053–15064. CrossRef Medline Mitra P, Bokil H (2008) Observed brain dynamics. Oxford, UK: Oxford UP. Moon CH, Fukuda M, Kim SG (2013) Spatiotemporal characteristics and vascular sources of neural-specific and -nonspecific fMRI signals at submillimeter columnar resolution. Neuroimage 64:91–103. CrossRef Medline Niell CM, Stryker MP (2010) Modulation of visual responses by behavioral state in mouse visual cortex. Neuron 65:472– 479. CrossRef Medline Niessing J, Ebisch B, Schmidt KE, Niessing M, Singer W, Galuske RA (2005) Hemodynamic signals correlate tightly with synchronized gamma oscillations. Science 309:948 –951. CrossRef Medline Norup Nielsen A, Lauritzen M (2001) Coupling and uncoupling of activity-
Huo et al. • Neural Activity Without a Hemodynamic Response dependent increases of neuronal activity and blood flow in rat somatosensory cortex. J Physiol 533:773–785. CrossRef Medline Polack PO, Friedman J, Golshani P (2013) Cellular mechanisms of brain state-dependent gain modulation in visual cortex. Nat Neurosci 16:1331– 1339. CrossRef Medline Quairiaux C, Me´gevand P, Kiss JZ, Michel CM (2011) Functional development of large-scale sensorimotor cortical networks in the brain. J Neurosci 31:9574 –9584. CrossRef Medline Scho¨lvinck ML, Maier A, Ye FQ, Duyn JH, Leopold DA (2010) Neural basis of global resting-state fMRI activity. Proc Natl Acad Sci U S A 107:10238 – 10243. CrossRef Medline Shepherd GM (2009) Intracortical cartography in an agranular area. Front Neurosci 3:337–343. CrossRef Medline Sheth SA, Nemoto M, Guiou M, Walker M, Pouratian N, Hageman N, Toga AW (2004a) Columnar specificity of microvascular oxygenation and volume responses: implications for functional brain mapping. J Neurosci 24:634 – 641. CrossRef Medline Sheth SA, Nemoto M, Guiou M, Walker M, Pouratian N, Toga AW (2004b) Linear and nonlinear relationships between neuronal activity, oxygen metabolism, and hemodynamic responses. Neuron 42:347–355. CrossRef Medline Shmuel A, Augath M, Oeltermann A, Logothetis NK (2006) Negative functional MRI response correlates with decreases in neuronal activity in monkey visual area V1. Nat Neurosci 9:569 –577. CrossRef Medline Siero JC, Hermes D, Hoogduin H, Luijten PR, Petridou N, Ramsey NF (2013) BOLD consistently matches electrophysiology in humansensorimotor cortex at increasing movement rates: a combined7T fMRI and ECoG study on neurovascular coupling. J Cereb Blood Flow Metab 33: 1448 –1456. CrossRef Medline Sirotin YB, Das A (2009) Anticipatory haemodynamic signals in sensory
J. Neurosci., August 13, 2014 • 34(33):10975–10981 • 10981 cortex not predicted by local neuronal activity. Nature 457:475– 479. CrossRef Medline Szymanski FD, Rabinowitz NC, Magri C, Panzeri S, Schnupp JW (2011) The laminar and temporal structure of stimulus information in the phase of field potentials of auditory cortex. J Neurosci 31:15787–15801. CrossRef Medline Tennant KA, Adkins DL, Donlan NA, Asay AL, Thomas N, Kleim JA, Jones TA (2011) The organization of the forelimb representation of the C57BL/6 mouse motor cortex as defined by intracortical microstimulation and cytoarchitecture. Cereb Cortex 21:865– 876. CrossRef Medline Tian P, Teng IC, May LD, Kurz R, Lu K, Scadeng M, Hillman EM, De Crespigny AJ, D’Arceuil HE, Mandeville JB, Marota JJ, Rosen BR, Liu TT, Boas DA, Buxton RB, Dale AM, Devor A (2010) Cortical depth-specific microvascular dilation underlies laminar differences in blood oxygenation level-dependent functional MRI signal. Proc Natl Acad Sci U S A 107:15246 –15251. CrossRef Medline Tsai PS, Kaufhold JP, Blinder P, Friedman B, Drew PJ, Karten HJ, Lyden PD, Kleinfeld D (2009) Correlations of neuronal and microvascular densities in murine cortex revealed by direct counting and colocalization of nuclei and vessels. J Neurosci 29:14553–14570. CrossRef Medline Vazquez AL, Fukuda M, Crowley JC, Kim SG (2013) Neural and hemodynamic responses elicited by forelimb- and photo-stimulation in channelrhodopsin-2 mice: insights into the hemodynamic point spread function. Cereb Cortex. Advance online publication. Retrieved July 15, 2014. doi:10.1093/cercor/bht147. CrossRef Medline Weiler N, Wood L, Yu J, Solla SA, Shepherd GM (2008) Top-down laminar organization of the excitatory network in motor cortex. Nat Neurosci 11:360 –366. CrossRef Medline Xing D, Yeh CI, Burns S, Shapley RM (2012) Laminar analysis of visually evoked activity in the primary visual cortex. Proc Natl Acad Sci U S A 109:13871–13876. CrossRef Medline