T O APPEAR IN A STROPHYSICAL J OURNAL L ETTERS Preprint typeset using LATEX style emulateapj v. 12/16/11
NEW CONSTRAINTS ON A COMPLEX RELATION BETWEEN GLOBULAR CLUSTER COLORS AND ENVIRONMENT
arXiv:1608.08628v1 [astro-ph.GA] 30 Aug 2016
3 ¨ M ATHIEU P OWALKA1 , T HOMAS H. P UZIA2 , A RIANE L ANC¸ ON1 , E RIC W. P ENG4,5 , F REDERIK S CH ONEBECK , K ARLA 2 2 6 6 7 ´ NGEL , J OHN P. B LAKESLEE , PATRICK C OT ´ A ˆ E´ , J EAN -C HARLES C UILLANDRE , P IERRE -A LAIN D UC7 , A LAMO -M ART´I NEZ , S IM ON PATRICK D URRELL8 , L AURA F ERRARESE6 , E VA K. G REBEL3 , P URAGRA G UHATHAKURTA9 , S. D. J. G WYN6 , H ARALD ˜ 2, K UNTSCHNER10 , S UNGSOON L IM4,5 , C HENGZE L IU11,12 , M ARIYA LYUBENOVA13 , J. C HRISTOPHER M IHOS14 , ROBERTO P. M U NOZ ˜ 2 , J OEL ROEDIGER6 , RUB E´ N S ANCHEZ ´ YASNA O RDENES -B RICE NO -JANSSEN6 , C HELSEA S PENGLER15 , E LISA T OLOBA9,16 , H ONGXIN Z HANG2
To appear in Astrophysical Journal Letters
ABSTRACT We present an analysis of high-quality photometry for globular clusters (GCs) in the Virgo cluster core region, based on data from the Next Generation Virgo Cluster Survey (NGVS) pilot field, and in the Milky Way (MW) based on VLT/X-Shooter spectrophotometry. We find significant discrepancies in color-color diagrams between sub-samples from different environments, confirming that the environment has a strong influence on the integrated colors of GCs. GC color distributions along a single color are not sufficient to capture the differences we observe in color-color space. While the average photometric colors become bluer with increasing radial distance to the cD galaxy M87, we also find a relation between the environment and the slope and intercept of the color-color relations. A denser environment seems to produce a larger dynamic range in certain color indices. We argue that these results are not due solely to differential extinction, IMF variations, calibration uncertainties, or overall age/metallicity variations. We therefore suggest that the relation between the environment and GC colors is, at least in part, due to chemical abundance variations, which affect stellar spectra and stellar evolution tracks. Our results demonstrate that stellar population diagnostics derived from model predictions which are calibrated on one particular sample of GCs may not be appropriate for all extragalactic GCs. These results advocate a more complex model of the assembly history of GC systems in massive galaxies that goes beyond the simple bimodality found in previous decades. Subject headings: globular clusters: general — galaxies: Virgo cluster, Milky Way — star clusters: general — stars: evolution 1. INTRODUCTION
[email protected] 1 Observatoire Astronomique de Strasbourg, Universit´ e de Strasbourg, CNRS, UMR 7550, 11 rue de l’Universit´e, F-67000 Strasbourg, France 2 Institute of Astrophysics, Pontificia Universidad Cat´ olica de Chile, Av. Vicu˜na Mackenna 4860, 7820436 Macul, Santiago, Chile 3 Astronomisches Rechen-Institut, Zentrum f¨ ur Astronomie der Universit¨at Heidelberg, M¨onchhofstraße 12-14, 69120 Heidelberg, Germany 4 Department of Astronomy, Peking University, Beijing 100871, China 5 Kavli Institute for Astronomy and Astrophysics, Peking University, Beijing 100871, China 6 Herzberg Institute of Astrophysics, National Research Council of Canada, Victoria, BC V9E 2E7, Canada 7 AIM Paris Saclay, CNRS/INSU, CEA/Irfu, Universit´ e Paris Diderot, Orme des Merisiers, F-91191 Gif-sur-Yvette Cedex, France 8 Department of Physics and Astronomy, Youngstown State University, One University Plaza, Youngstown, OH 44555, USA 9 UCO/Lick Observatory, Department of Astronomy and Astrophysics, University of California Santa Cruz, 1156 High Street, Santa Cruz, CA 95064, USA 10 European Southern Observatory, Karl-Schwarzschild-Str. 2, 85748 Garching, Germany 11 Center for Astronomy and Astrophysics, Department of Physics and Astronomy, Shanghai Jiao Tong University, Shanghai 200240, China 12 Shanghai Key Lab for Particle Physics and Cosmology, Shanghai Jiao Tong University, Shanghai 200240, China 13 Kapteyn Astronomical Institute, 9700 AV Groningen, The Netherlands 14 Department of Astronomy, Case Western Reserve University, Cleveland, OH, USA 15 Department of Physics & Astronomy, University of Victoria, Victoria, BC, V8W 2Y2, Canada 16 Physics Department, Texas Tech University, Box 41051, Lubbock, TX 79409-1051, USA
Globular clusters (GCs) come in different colors, which are low-resolution diagnostics of the rich collection of astrophysical parameters that characterize their constituent stellar populations. It is well established that there are blue and red populations of GCs in every massive galaxy (Zepf & Ashman 1993; Peng et al. 2006), which correspond to metal-poor and metal-rich stellar populations (Puzia et al. 2005a,b; Colucci et al. 2009, 2014), and that their proportion depends on the environment, in particular, the mass of the host galaxy (Forbes et al. 1997; Cˆot´e et al. 1998; Gebhardt & Kissler-Patig 1999; Larsen et al. 2001) and the galactocentric distance (Geisler et al. 1996; Harris 2009; Strader et al. 2011). In general, the GC system color distribution of a more massive galaxy will be broader and its mean shifted to redder colors than in a less massive one. This trend is often interpreted as a radial metallicity gradient. It can be due to 1) the changing ratio of red and blue GCs and/or 2) the decreasing (i.e. bluer) peak color of red and blue GC sub-populations as a function of galactocentric radius (Harris 2009; Strader et al. 2011; Oldham & Auger 2016). In most previous studies, such analyses were based on a single photometric color of rich GC systems (Peng et al. 2006, 2011; Jord´an et al. 2015). Those studies that used color-color planes as diagnostic tools were hampered by relatively small GC sample sizes to be able to assess any environmental dependence (Puzia et al. 2002; Hempel & KisslerPatig 2004). In this letter, we present a detailed color-color plane analysis of the GC photometric properties in the pilot region of the Next Generation Virgo Cluster Survey (NGVS/NGVS-IR, see Ferrarese et al. 2012; Mu˜noz et al. 2014). We compare various
2
Powalka et al.
GC sub-samples located in different environments around the central massive cD Virgo galaxy M87 and in the MW. While M87 constitutes one of the densest environments in the local universe (D ' 16.5 Mpc, see Mei et al. 2007; Blakeslee et al. 2009), the MW environment shows a relatively shallow and smooth gravitational potential (Tully 2015). 2. THE DATA 2.1. Next Generation Virgo Survey GCs
The NGVS-GC sample used for our analysis is taken from (Powalka et al. 2016, hereafter Paper I). It contains 1846 GCs within the 3.62 deg2 field around M87 (the Virgo core region) and provides photometric observations in u∗ , g, r, i, z and Ks filters. This sample contains objects with SE X TRACTOR magnitude errors smaller than 0.06 mag in each band, typical magnitudes around 21 in i, and typical masses of about 2 × 10⁶ M . Paper I provides limits on systematic photometric errors (of order 2-3 % in most bands, 5 % in u), and notes these would lead to global shifts in color-color diagrams. Here, we apply the offsets uAB = uSDSS − 0.04 mag and zAB = zSDSS + 0.02 mag recommended in the Sloan Digital Sky Survey (SDSS) Data Release 10 (Ahn et al. 2014), that were discussed but not applied in Paper I. The GC sample was selected in a “modified uiK diagram”, that combines (u − i) and (i − Ks ) color information with a compactness index measured on the NGVS i-band images (i.e. structural information of the sources). This ensures a very robust separation between GCs, stars and galaxies, in contrast to any separation one would obtain from optical colors alone. The estimated contamination of the GC sample is of about 5 %, and is mainly due to stars at the blue end of the GC color distribution or to compact background galaxies. For all additional information, we refer the reader to Paper I. 2.2. Milky Way GCs Several photometric MW GC samples exist in the literature which are mainly based on optical Johnson-Cousins or SDSS photometry (e.g. Harris 2010; Vanderbeke et al. 2014). Using such data in comparisons with MegaCam photometry requires transformation relations between systems. Unfortunately, we found that the choice of a transformation relation and the internal uncertainties of these literature data introduce random and systematic uncertainties larger than the effects we wish to discuss, thus preventing a meaningful analysis. A dedicated study, extended to other galaxies, is postponed to a future article. Pending further analysis of these photometric transformation uncertainties, we favour the use of VLT/Xshooter spectra of MW GCs. Eleven are available to us, taken from the target sample of the Panchromatic HighResolution Spectroscopic Survey of Local Group Star Clusters (NGC 104, NGC 288, NGC 362, NGC 1851, NGC 1904, NGC 2298, NGC 2808, NGC 6656, NGC 7078, NGC 7089, and NGC 7099; Sch¨onebeck et al. 2014) The spectra cover the near-UV to near-IR wavelengths and are calibrated to an absolute flux accuracy of better than ∼ 5%, allowing for the computation of accurate synthetic colors directly in the AB system of the NGVS data. X-shooter flux calibration errors occur on various scales (e.g. Moehler et al. 2014). Errors on small scales are partly averaged out in broad band flux measurements, resulting in magnitude errors below 0.01 mag. Errors on larger spectral scales, or errors in the merging of data from two independent
arms of the X-shooter instrument, can affect the colors more. The 5% bound applies to these (i.e. +/-2.5%). A random distribution of possible large scale errors within the bounds leads to an estimated 1-sigma error of 0.02 mag on colors (this has been tested by perturbing the GC calibration with 90 perturbation functions with a broad variety of shapes, all within the 5% bounds). We are aware of no reason that should induce color-dependent systematic errors on the color indices, other than uncertainties in the transmission curves, and such errors are below 0.01 mag (see Paper 1). The metallicities of the Galactic GC sample span a range between −2.3 (NGC 7078) < [Fe/H] < −0.7 (NGC 104). The MW GC spectra have been obtained in drift-scan mode, i.e., the telescope was slewed across the clusters during the integration. Each GC was targeted with multiple scans at various locations, such that the total area covered by all scans corresponds to ∼ 0.35 πrh2 about the GC cluster center (rh is the GC half-light radius). The sky subtraction was performed with dedicated sky drift-scans taken at positions typically ∼ 1◦ away from the GC centers. For each cluster, all reduced scans have been stacked into a final spectrum that contains the luminosity weighted contributions of ∼ 105 GC stars. A more detailed description of this data set will be presented in an upcoming paper (Sch¨onebeck et al. 2016, in prep.). The synthetic colors of the MW clusters were computed with the transmission curves of Betoule et al. (2013), as recommended in Paper I. Extinction corrections are based on the values of the McMaster catalog (Harris 2010). 3. RESULTS 3.1. The Influence of the Environment
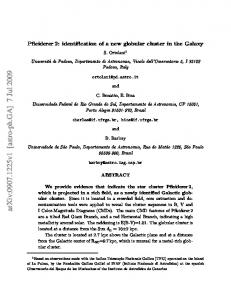
The NGVS pilot field includes several Virgo galaxies and their GC systems. In Figure 1, we use the proximity to host galaxies to define four GC subsets. Subset A contains the GCs within 20 kpc of M87, while subset B covers the outer regions of M87 out to 200 kpc (r < 41.60 ). Sub-sample C includes all the GCs located even further out from M 87, with the exception of those located around other relatively large galaxies, which are grouped in subset D. We begin to analyze the optical griz color-color distributions of these four subsets in Figure 2, and observe that they differ both in mean color and shape. To guide the eye, and to recall the typical degeneracy between age and metallicity in the predicted colors of single stellar populations (SSP), we superimpose a set of models from Bruzual & Charlot (2003) with ages 6 < t < 13 Gyr and metallicities 0.0002 < Z < 0.03. While this degeneracy is strong in all model sets with given abundance ratios, we caution that the actual loci and shapes of synthetic distributions remain strongly modeldependent, as illustrated extensively in Paper I. Samples A, B and C demonstrate that the (g−r)0 − (i−z)0 color-color distribution changes significantly with distance to the center of M87. This is highlighted in the density plots of the bottom row of Figure 2: for the peak of the distribution (usually referred to as the blue peak) we report color differences of ∆(i−z) ' 0.06 mag and ∆(g−r) ' 0.03 mag between subsets C and A. Unlike sample A, samples B and C exhibit a shallower color-color relation and are increasingly offset towards bluer average colors. This evolution is consistent with B containing a composite of A and C GCs. We note that the color-color relation of the MW GCs (black diamonds) best matches subset C. To characterize the influence of the environment, we have
Globular cluster colors versus environment
D
NGC4473
C
DEC (J2000)
13.0
3
B
NGC4435
NGC4438
M86
12.5
M87
A
12.0
11.5 188.5
188.0
187.5
RA (J2000)
187.0
F IG . 1.— Spatial distribution of the NGVS GC sub-samples. The red GCs are located within a projected radius of 20 kpc from the M87 center. The orange points show GCs between 20 ≤ r < 200 kpc. The blue GCs are defined by r > 200 kpc and being not associated with the M86, NGC 4435, NGC 4438 and NGC 4473. GCs associated with the latter galaxies are indicated by magenta points.
computed the maximum-likelihood linear relation between (g − r)0 and (i − z)0 for each GC sample. These fitted lines mainly help emphasizing the overall trend of the colorcolor distribution. Sub-samples D and A share similarly steep slopes, whereas the computed MW GC color-color slope is shallowest but similar to that of Virgo sample C. However, we caution that the MW GC sample contains only 11 data points. Despite this limitation it can be stated that the GCs located nearest to M87 host stellar populations with significantly different properties than those in set C or in the MW sample. Differences between GC color distributions have been discussed mainly in terms of metallicity distributions in the past. Our results indicate that extra parameters are required. Considering metallicity together with age remains insufficient, because of the strong degeneracy between age and metallicity predicted by old SSP models in the relevant colorcolor planes. At least a third parameter is necessary. 3.2. Comparison between Virgo and Milky Way GCs
We present in Figure 3 three additional color-color diagrams (grz, uiK, and gri along with the griz plane from Figure 2) comparing NGVS GCs (colored dots) with the MW GCs (black diamonds). The locus of M87 GCs (subset A) is impressively tight, although the dispersion around this locus
is slightly larger than what is expected from random photometric errors. In general, the color distributions of M87 and MW GCs are strikingly different, in particular in the grz and griz planes. The M87 clusters have redder r − z and i − z colors than MW clusters. Moreover, the slopes of the trends differ for the two samples. In the top right panel of Figure 3, vectors show the shifts in the griz plane resulting from: the average extinction vector; the change of the index of a power-law IMF from −0.3 to −4.3 (the vector depends on age and metallicity, hence the ellipse); an age difference of 10 Gyr at Z = 10−4 , and the same at Z = Z . None of these changes induces a variation that would reasonably explain the observations (see Section 4). Using the MW clusters in the grz diagram to guide the eye, we find that the Virgo sample contains a subset of some 30 red GCs whose colors align with those of the MW GCs, rather than with those of M87. We select the most obvious of these in the grz panel of Figure 3 (inside the blue polygon) and display them as blue dots in the other panels, referring to these as subset E17 . It is worth noting that these particular clusters, 17 We have removed five objects from the initial subset E, of which we suspect three may be affected by dust lanes, and two might be background galaxies due to their elongated shape. A careful visual inspection confirms that all the remaining candidates (26) have apparently normal GC properties.
4
Powalka et al. (i−z)0 =0.80 (g−r)0 −0.26
(i−z)0 =0.68 (g−r)0 −0.21
(i−z)0 =0.45 (g−r)0 −0.13
(i−z)0 =0.86 (g−r)0 −0.34
(i−z)0
(i−z)0
(i−z)0 =0.27 (g−r)0 −0.03 (i−z)0 =0.27 (g−r)0 −0.03 (i−z)0 =0.27 (g−r)0 −0.03 (i−z)0 =0.27 (g−r)0 −0.03 0.4 0.35 0.3 0.25 0.2 0.15 0.1 0.05 A B C D 0 MW MW MW MW -0.05 0.35 0.45 0.55 0.65 0.75 0.85 0.35 0.45 0.55 0.65 0.75 0.85 0.35 0.45 0.55 0.65 0.75 0.85 0.35 0.45 0.55 0.65 0.75 0.85 0.35 (g−r)0 (g−r)0 (g−r)0 (g−r)0 0.3 0.25 0.2 0.15 0.1 0.05 A B C D 0 -0.05 0.35 0.45 0.55 0.65 0.75 0.85 0.35 0.45 0.55 0.65 0.75 0.85 0.35 0.45 0.55 0.65 0.75 0.85 0.35 0.45 0.55 0.65 0.75 0.85 (g−r)0 (g−r)0 (g−r)0 (g−r)0
F IG . 2.— (g − r)0 versus (i − z)0 color-color diagram for different GC samples. (Top panels): Comparison of various NGVS GC sub-samples (from left to right: A, B, C, D), with MW GCs (black diamonds). Circles and squares mark GCs without and with radial velocity information. Linear ML-fits to the NGVS-GC sub-samples and MW GCs are given in the top of each panel. In addition, we show SSP predictions taken from the Bruzual & Charlot (2003) model for metallicities 0.0002 < Z < 0.03 and ages 6 < t