New techniques to simulate and diagnose stator winding faults in low voltage induction motors Lucia Frosini, Alessandro Borin, Andrea Albini, Francesco Benzi
1
Abstract -- This paper presents the experimental results obtained by implementing two different methods to simulate stator short circuits in laboratory for induction motors. In order to diagnose this fault, the measurements of one phase stator current and of the stray flux gathered in different positions around the motor have been statistically processed. The novelty introduced by the use of two different techniques to simulate the same fault consists in a more robust identification of the diagnostic indicators that could be employed in the industry for the condition monitoring of the low voltage induction motors. Index Terms -- Induction motors, condition monitoring, short circuit currents, magnetic flux leakage, fault diagnosis.
I.
INTRODUCTION
T
he predictive and preventive diagnostics of the electrical machines is based on both off-line and on-line methods. The first ones need to stop the machine and can be applied only if there is a redundancy (i.e. an identical machine which can operate in place of the other one) and when the fault to be prevented is slowly progressive. This is the case, for example, of the failure on the groundwall insulation of the medium voltage electrical machines, which is traditionally and efficiently diagnosed by off-line methods [1], even though also on-line techniques based on the monitoring of the partial discharges can be adopted [2]. In the last twenty years many progresses have been done in developing on-line monitoring and diagnostic tools for the early detection of broken rotor bars and air-gap eccentricity problems: case histories have verified that these faults can be reliably detected in industrial induction motor drives and commercial systems are available [3]. On the contrary, a reliable on-line diagnosis of shorted turns in low voltage stator windings has still to obtain credibility in the industry, even if many studies have been developed on this topic: some surveys about them can be found in [4],[5]. The above mentioned fault can be considered as “quickly progressive”, since many phase-to-ground or phase-to-phase short circuits start as undetected turn-to-turn shorts, and then grow and propagate until the motor fails and the protection equipment disconnects the supply [6]. For small machines, this time delay can vary from some minutes to some hours, depending on the size of the motor, on the severity of the failure and load conditions [7]. So, an efficient condition monitoring system should be able to diagnose short circuits within one or few turns, in order to implement a preventive maintenance. To achieve this goal, the instruments to diagnose this fault should be tested in laboratory in a condition as close as possible to the actual condition of 1 This work was supported in part by Italian MIUR (PRIN 2008). L. Frosini, A. Albini and F. Benzi are with Dipartimento di Ingegneria Industriale e dell’Informazione, Università di Pavia, Italy (e-mail:
[email protected],
[email protected],
[email protected]). A. Borin is with Heat & Power S.r.l., Tortona, Italy (e-mail:
[email protected]).
978-1-4673-0141-1/12/$26.00 ©2012 IEEE
incipient deterioration of the turn-to-turn insulation. Since it would be too expensive sacrificing one motor for each test, the researchers have considered the most appropriate methods to simulate this fault condition. II.
LITERATURE REVIEW
The main results in the last twenty years literature are reported in the following. An important study has evaluated the possibility to use the stray flux [8] and the stator current of one phase [9] to detect the stator winding faults. Here, the short circuit has been produced in the following way: at the nose of two stator coils (one on each side of the machine), the insulation was bared and the top two copper turns exposed. A set of leads was attached across one turn of each of the coils, feeding a water-cooled variable resistor. Varying the resistance value allowed the short current to be varied while still protecting the motor from severe overheating. In [10], the current of one phase has been analysed to detect the stator shorts. For this purpose, different squirrel cage induction motors have been tested, with one and two inter-turn shorts and, then, until the complete failure of the machine. The tests were initially carried out by connecting an external short circuit resistance across one turn and then two turns: the short circuit current in the external short circuit was limited to about twice the line rated current in both cases. Therefore, a piece of copper was soldered onto the end winding of a coil and the rated voltage was applied. After 3÷4 minutes at no-load, the insulation was subjected to a high temperature (strong odour and the end winding was quickly becoming discoloured) and after 1 minute smoke was evident and ignition of the end winding tape occurred. The motor was switched off to avoid further damage. Then, a variable voltage was applied and the motor was tested at two different loads on a reduced voltage, to avoid immediate failure and burn out. After running the motor on load for 2÷3 minutes, the motor finally failed on a phase-to-earth fault. From the beginning of the tests with the direct shorted turns, the motor was started and stopped, operated at full voltage on no-load and at reduced voltage on load: it probably operated for around 15 minutes in total with a substantial number of the turns shorted in one coil. In another motor a complete coil was initially short circuited via an external limiting resistor and the short circuit current was increased until the motor failed: the motor tripped after ten minutes via earth leakage protection with direct shorted turns in one coil. In [11],[12] the negative-sequence impedance has been considered to detect this fault and the deterioration of the turn-to-turn insulation was simulated by placing taps on the wires of the stator winding and then shorting these taps. Various levels of deterioration severity were simulated by inserting different values of resistance in this leakage path.
1781
Effort was taken to simulate small levels of deterioration during the experiments; however, since each phase of the stator was composed of only four coils, the smallest portion of the winding accessible was 25% of one phase winding. The leakage current was limited to very low values: in the most severe level of deterioration simulated, the leakage current was less than the rated input current of the motor. In [13-17], the authors demonstrated that the leakage flux based technique is more reliable than the current signature analysis to detect stator shorts. Their tests have been carried out on a squirrel cage induction motor supplied from both the mains and inverter; the motor was rewound with a phase parallel circuit having the first six turns being accessible from the outside. This arrangement allows performing a short circuit in the same phase at a reasonable level (from 1% to 6%). The short-circuit current in the winding was limited by an adjustable resistance to keep it not higher than the rated value. In [18] the monitoring of the 3rd harmonic of one phase current was found to be an effective method for the detection of the stator faults in case of a DTC induction motor drive: when short circuits were introduced, a shorting resistor was used in order to limit the value of the short circuit current, thus protecting the motor windings from complete failure. The harmonic components of the axial leakage flux have been evaluated as diagnostic indicators for the stator faults in [19], where the insulation in two adjacent turns of the same coil was scratched and two turns were welded. A total number of 33 cycles were performed by the motor in the shorted turn condition until the final breakdown happened. In [20] and [21] the radial external magnetic flux has been analysed to detect this fault. For this purpose, a shortcircuit of a whole elementary section, representing the 12.5% of the complete winding of one phase and corresponding to one slot, was realised on an induction motor. During the tests, the machine was underfed and run at no load; the short circuit current was limited to 10 times the line supply current in order to protect the winding. In [22] the flux patterns around an induction motor were evaluated with diagnostic purposes by means of different search coils. In this study, the turn-to-turn short circuit was implemented between two adjacent turns of the stator winding and did not include any resistor specialised in limiting the effects of such an operating state. The duration of this faulty condition was limited to about one second. The measurements at full load were not carried out, in order not to expose the machine to extreme conditions. On the basis of this analysis of the literature and considering that, for practical reasons, it was impossible in this research to test motors until their destruction, two different techniques have been implemented to simulate the same fault. In both cases, the idea was to not reduce the supply voltage, since only at rated voltage it is possible to evaluate the actual magnetic behaviour of the machine, the saturation effect in the iron and the harmonic content in the current and in the stray flux due to the saturation and to the slotting effects. III.
THE EXPERIMENTAL SET-UP
The experimental tests have been carried out on a threephase cage induction motor, supplied by the mains at 400 V,
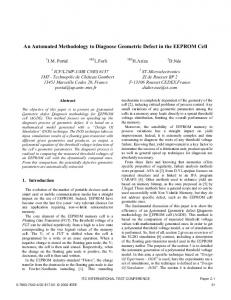
50 Hz, rated power 1.5 kW, 4 poles, 36 stator slots, 46 rotor slots, with the case made on thick steel, since it is certified to be explosion proof. The stator winding of the motor has been realized on purpose, in order to simulate inter-turns short circuits within one phase. On the supply terminals, three wires derived from one phase are accessible: with an appropriate connection, they allow to put in short circuit the 5%, 10% and 15% of the total number of turns (294) of this phase. Since the aim of this research is to detect a fault on stator winding in its incipient stage, only the first possibility has been taken into account. Two different strategies have been implemented to simulate the short circuit, as illustrated in Fig. 1 The first strategy is similar to that implemented in [13] and in most of the literature: two of the additional external wires have been connected to form a short circuit inter fifteen turns, about 5% of the turns of the whole winding of one phase (Fig. 1. a). In these short circuited turns a fault current will flow, due to the electromotive force induced from the rotor magnetic field. In practice, the shorted turns will appear as the secondary winding of an autotransformer. If, for example, the phase winding has Np turns (the “primary winding”) and if a short circuit appears across Ns turns (the “secondary”), then Np/Ns times the normal current will flow in the shorted turns [23]. In this research, the choice was to limit the fault current to the rated value of the current of this motor, by interposing a variable resistance between the shorted wires; in this way, the fault current is not harmful for the machine during the time required by the measurements. Note that, with this strategy, the supply voltage can be maintained at its rated value, without damaging the stator winding. On the contrary, if the fault current is limited by reducing the supply voltage, the saturation conditions will change and some harmonic components could vary for this reason and not for the presence of the fault. For the second strategy (see Fig. 1. b), the supply was provided directly on the first additional wire, downstream the first fifteen turns, by reducing of 5% the overall impedance of this phase. In this way, in the first fifteen turns any current will flow. Note that this method was not used previously in the literature.
a)
b) Fig. 1. Circuital schemes for the realization of the stator short circuits: a) by means of a resistance, b) by means of the supply.
In order to find the best diagnostic indicators for the considered fault, the following types of measurement have been carried out (see Fig. 2): current of one phase, collected
1782
“OK”: in these cases, the diagnostic index exceeds five times the corresponding standard deviation. The best diagnostic indicators are those which present the highest level of significance in both the simulated faulty conditions (by supply and by resistance) and, possibly, with both the calculation procedures (in linear and logarithmic scale). This happens only for the 6th and the 10th harmonics of the axial flux collected by the hand-made probe on the body of the motor. Other interesting indicators are those which present this level of significance for both the models of fault, even if with only one calculation procedure. In any case, in no-load condition, the best diagnostic information is given by the axial body flux collected by the hand-made probe: the acquisitions of this signal in the three considered conditions (healthy, short by supply and short by resistance), in the time and frequency domain, are reported in Fig. 3, Fig. 4, Fig. 5.
Signal [mV]
by a commercial probe based on the Hall effect, model Tektronix TCP305, with amplifier model TCP305, always from the same phase, chosen between the two healthy phases; axial leakage flux, collected by a commercial flux probe (Emerson M-343F-1204); axial and radial leakage flux on the body of the motor and radial leakage flux on the end-winding, collected by means of a hand-made flux probe, already used in [24]. Differently from [24], both the flux sensors have been used together with an amplification and filtering stage, designed on purpose, whereas, since the current sensor is already equipped with its own signal amplifier, only a filtering stage has been applied to the current measurement.
Acquisition time [ms]
Fig. 2. The experimental test-bench with the three sensors.
A. No-load tests In Table I, the harmonics showing the highest level of significance in no-load condition are highlighted with an
Frequency [Hz]
Fig. 3. Axial body flux, healthy motor, no-load.
Signal [mV]
All the experimental tests have been carried out by supplying the motor at rated voltage and letting it operating for about 5 minutes before collecting the measurements, with sampling frequency 10 kHz, testing period 50 s, number of samples 500000. In the healthy operating condition, twenty consecutive acquisitions were carried out for each type of measurement, maintaining the same value of the load and the position of the flux-probe. For the measurements in the faulty operating conditions, the number of acquisitions has been limited to ten, to avoid an over-stress on the machine. Each acquisition was processed to achieve the harmonic spectrum of the signal (FFT step = 0.02 Hz), expressed in both linear and logarithmic scale; the value of each harmonic was normalized with respect to the fundamental at 50 Hz. For each type of measurement, the value of each harmonic was obtained as average of the twenty (or ten) acquisitions: the average was calculated separately from the values in linear scale and from those in decibels. The diagnostic index here considered is the absolute value of the difference of each harmonic between the faulty and the healthy condition, which has been compared to the standard deviation of the acquisitions in the healthy condition. Only the harmonics multiples of the fundamental were evaluated in order to obtain diagnostic indicators independent from specific characteristics of the machine and from the load.
[dB]
THE EXPERIMENTAL TESTS
Acquisition time [ms]
[dB]
IV.
Frequency [Hz]
Fig. 4. Axial body flux, faulty motor by supply, no-load.
1783
Signal [mV]
Signal [mV]
standard deviation s of the harmonic in healthy condition; the analogous values for the second faulty condition (“short by resistance”).
Acquisition time [ms]
[dB]
[dB]
Acquisition time [ms]
Frequency [Hz]
Fig. 5. Axial body flux, faulty motor by resistance, no-load.
Other interesting results are provided by the same probe in other positions and by the Emerson sensor (see Table I).
Signal [mV] [dB]
Acquisition time [ms]
Frequency [Hz]
Fig. 7. Radial body flux, faulty motor by supply, loaded motor.
1784
Signal [mV]
B. Load tests In Table II, the harmonics which present the highest level of significance when the motor was loaded to about 95% of its rated power are pointed out. In this case, the only parameter which can be considered as “robust” from the diagnostics point of view is the 5th harmonic of the radial body flux collected by the hand-made probe: the acquisitions of this signal in the three considered conditions are reported in Fig. 6, Fig. 7 and Fig. 8. Other interesting parameters are the 3rd, 7th and 11th harmonics of the stator current and the 9th harmonic of the axial flux collected by the Emerson probe. On the whole, the detection of the stator short circuits on the loaded motor seems more difficult with respect to the no-load condition, especially by means of the analysis of the leakage flux. This could be due to the larger quantity of noise present in this signal in load condition, which is evident in the graphs of the FFT of the radial body flux (Fig. 6, Fig. 7, Fig. 8); similar considerations about the noise are valid for the leakage flux signal in other positions around the motor. On the contrary, at load, the current signal reveals more excited harmonics in the faulty condition, with respect to the no-load case. Further analyses could consider not only the harmonics at multiples of the supply frequency, but also other components at frequencies related to the slip of the motor, as for example in [8],[9],[10], for both the current and the flux signals. A more detailed analysis of the signals measured on the loaded motor by each sensor in the frequency domain in logarithmic scale is reported in Table III; in each column, for each specific harmonic, are shown: mean value of the twenty acquisitions for the healthy condition; mean value of the ten acquisitions for the faulty condition “short by supply”; difference between the above values (Δ); level of significance of the specific harmonic as function of the
Frequency [Hz]
Fig. 6. Radial body flux, healthy motor, loaded motor.
Acquisition time [ms]
[dB]
because they show the importance to measure on-line different signals in order to obtain a robust fault detection. Future works will consider similar measurements on motors supplied not only by the mains but also by inverter, in order to evaluate the robustness of the diagnostic indicators here found. Moreover, a theoretical analysis will be developed, in order to justify the harmonics excited during the short-circuit and to generalize the method. VI.
Frequency [Hz]
[1]
Fig. 8. Radial body flux, faulty motor by resistance, loaded motor.
C. Considerations on the overall tests An important result arising from the overall tests is that many harmonics of the collected signals are excited with both the simulation methods: this means that both methods produce similar effects in the electromagnetic behaviour of the machine. Indeed, none of these methods simulates the actual effects due to inter-turns short circuits, since in the first case the current in the shorted turns is limited by a resistance, whereas in the second one this current is null. So, the electromagnetic changes given by these simulations, with respect to the healthy condition, are lighter than an actual fault. Therefore, if the proposed diagnostic procedure reveals significant differences between the healthy and the “simulated faulty” condition, it is likely that the same procedure would be effective for the early detection of the actual fault. In order to extend the validity of the proposed methods, they have been planned similar measurements on other motors of different size and type. V.
[2]
[3] [4] [5] [6]
[7] [8]
[9]
CONCLUSIONS
In this work two different methods to experimentally simulate the inter turns short circuits in the stator winding of induction motors are implemented: both allow to supply the machine at rated voltage (in order to maintain the correct magnetic conditions) and to avoid irreparable damages on the winding during the tests. One of these methods has been already commonly used in the literature, whereas the other one represents a novelty introduced in this research. To detect this fault, the on-line measurements of different non-invasive signals have been taken into account: one phase stator current and external stray flux around the machine, collected by means of different sensors in different positions. The experimental acquisitions of these signals have been processed in the frequency domain to evaluate the harmonic components multiple of the supply frequency as diagnostic indicators. A statistical analysis has considered as reliable indicators the differences between the healthy and faulty conditions which exceed five times the standard deviation of the related acquisitions. The more robust diagnostic indicators are those which present this level of significance with both the simulated faulty conditions and with both the calculation procedures (in linear and logarithmic scale). The experimental tests carried out on a 1.5 kW cage motor have revealed different diagnostic indicator according to the load or no-load condition: in particular, the leakage flux analysis gives better results at no-load, whereas the stator current provides interesting diagnostic information only when the motor is loaded. These results are significant,
[10] [11]
[12]
[13]
[14] [15]
[16]
[17]
[18] [19]
1785
REFERENCES
G.C. Stone, “Recent important changes in IEEE motor and generator winding insulation diagnostic testing standards”, IEEE Trans. Industry Applications, vol. 41, no. 1, pp. 91–100, Jan.-Feb. 2005. G.C. Stone, B. Lloyd, M. Sasic, “Experience with continuous on-line partial discharge monitoring of generators and motors”, in Proc. of International Conference on Condition Monitoring and Diagnosis, pp. 212–216, 2008. W.T. Thomson, “A review of on-line condition monitoring techniques for three-phase squirrel-cage induction motors–past, present and future”, in Proc. of SDEMPED‘99, pp. 1–16, 1999. I. Albizu, I. Zamora, A.J. Mazon, J.R. Saenz, A. Tapia, “On-line stator fault diagnosis in low voltage induction motors”, in Proc. of UPEC 2004, pp. 504–508, 2004. A. Siddique, “A Review of Stator Fault Monitoring Techniques of Induction Motors”, IEEE Trans. Energy Conversion, vol. 20, no. 1, pp. 106–114, Mar. 2005. G.B. Kliman, W.J. Premerlani, R.A. Koegl, and D. Hoeweler, “A new approach to on-line fault detection in ac motors,” in Proc. IEEE Industry Applications Soc. Annual Meeting Conf., San Diego, CA, 1996, pp. 687–693. V. Kokko, “Condition monitoring of squirrel-cage motors by axial magnetic flux measurements”, Academic Dissertation, Faculty of Technology, University of Oulu, 2003. J. Penman, H.G. Sedding, B.A. Lloyd, and W.T. Fink, “Detection and location of interturn short circuits in the stator windings of operating motors,” IEEE Trans. Energy Conversion, vol. 9, no. 4, pp. 652–658, Dec. 1994. A. Stavrou, H.G. Sedding, J. Penman, “Current monitoring for detecting inter-turn short circuits in induction motors”, IEEE Trans. Energy Conversion, vol. 16, no. 1, pp. 32–37, Mar. 2001. W.T. Thomson, “On-line MCSA to diagnose shorted turns in low voltage stator windings of 3-phase induction motors prior to failure”, in Proc. IEMDC 2001, pp. 891–898. J. Sottile, F.C. Trutt, J.L. Kohler, “Condition monitoring of stator windings in induction motors. Part I. Experimental Investigation of the Effective Negative-Sequence Impedance Detector”, IEEE Trans. Industry Applications, vol. 38, no. 5, pp. 1447–1453, Sep./Oct 2002. J. Sottile, F.C. Trutt, J.L. Kohler, “Condition monitoring of stator windings in induction motors. Part II. Experimental investigation of voltage mismatch detectors”, IEEE Trans. Industry Applications, vol. 38, no. 5, pp. 1454–1459, Sep./Oct 2002. H. Henao, C. Demian, and G.A. Capolino, “A frequency-domain detection of stator winding faults in induction machines using an external flux sensor”, IEEE Trans. Ind. Appl., 39(5), pp. 1272-1279, 2003. H. Henao, G.A. Capolino, and C. Martis, “On the stray flux analysis for the detection of the three-phase induction machine faults,” in Proc. IAS’03, pp. 1368–1373, Oct. 2003. A. Yazidi, D. Thailly, H. Henao, R. Romary, G. A. Capolino, and J. F. Brudny, “Detection of stator short circuit in induction machine using an external leakage flux sensor,” in Proc. ICIT, pp. 166-169, 2004. T. Assaf, H. Henao, G.A. Capolino, “Simplified axial flux spectrum method to detect incipient stator inter-turn short-circuits in induction machine”, IEEE International Symposium on Industrial Electronics, vol. 2, pp. 815–819, May 2004. A. Yazidi, H. Henao, G.A. Capolino, M. Artioli, F. Filippetti, and D. Casadei, “Flux signature analysis: an alternative method for the fault diagnosis of induction machines”, in Proc. of IEEE Power Tech, pp. 1–6, 2005. S.M.A. Cruz, A.J.M. Cardoso, ‘”Diagnosis of stator inter-turn short circuits in DTC induction motordrives”, IEEE Trans. Industry Applications, vol. 40, no. 5, pp. 1349–1360, 2004. M.G. Melero, M.F. Cabanas, C. Rojas, G.A. Orcajo, J.M. Cano, J.Solares, “Study of an induction motor working under stator winding inter-turn short circuit condition”, in Proc. SDEMPED 2003, pp. 52– 57, Aug. 2003.
[20] R. Romary, R. Corton, D. Thailly, and J.F. Brudny, “Induction Machine Faults Diagnosis using an External Radial Flux Sensor”, The European Physical Journal of Applied Physics, 32, 125-132, 2005. [21] D. Thailly, R. Romary, J-F. Brudny, “Quantitative analysis of the external radial magnetic field for detection of stator inter-turn shortcircuit in induction machines”, in Proc. EPE 2005, Sep. 2005. [22] M.D. Negrea, “Electromagnetic flux monitoring for detecting faults in electrical machines”, Doctoral Dissertation, Helsinki University of Technology, 2006. [23] G.C. Stone, E.A. Boulter, I. Culbert, H. Dhirani, Electrical insulation for rotating machines: design, evaluation, aging, testing, and repair, IEEE Press, 2004. [24] L. Frosini, A. Borin, L. Girometta, G. Venchi, “Development of a leakage flux measurement system for condition monitoring of electrical drives”, in Proc. SDEMPED 2011, pp. 1–8, 2011.
VII.
BIOGRAPHIES
Lucia Frosini was born in 1970 in Pavia (Italy). She received her MSc Degree (1994) and PhD (2000) in Electrical Engineering at University of Pavia. She is assistant professor at the Electrical Engineering Department of Pavia and lecturer of “Diagnostic systems for electrical machines and drives” and “Design and Technology of Electrical Machines and Drives” at the Engineering Faculty of Pavia. She is author of about 50 scientific
publications on journals, books and congress proceedings. Her research fields are mainly modelling and diagnostics applied to electrical machines. Alessandro Borin was born in 1987 in Voghera (Italy). He received his is MSc Degree (2011) in Electrical Engineering at the University of Pavia, Italy. Andrea Albini is senior technician at the Electrical Materials and Electrical Measurement Laboratory of the Department of Electrical Engineering, University of Pavia. His field of activity is measurements, data acquisition, post processing data management and control processing, where he is author of some research papers. Francesco Benzi (M’89) received the Laurea in electronics engineering with honors from the University of Pavia, Italy, in 1978. He joined the WEMPEC Lab at the University of Wisconsin, Madison, in 1984–1985 as a Visiting Researcher and he is currently Full Professor of Electrical Drives at the Department of Electrical Engineering of the University of Pavia. His research interests lie in adjustable speed drives and actuators in industrial automation and robotics. He is also involved in issues concerned with process integration, including communication protocols for industrial and domestic environments and building automation. Dr. Benzi is a distinguished member of the Italian Electrical and Electronics Association (AEIT), where he has served as Chairman of the Automation Committee.
TABLE I. SYNTHESIS OF THE NO-LOAD TESTS IN BOTH LINEAR AND LOGARITHMIC SCALE NO-LOAD MOTOR
100 Hz
150 Hz
200 Hz
250 Hz
300 Hz
350 Hz
400 Hz
450 Hz
500 Hz
550 Hz
600 Hz
650 Hz
700 Hz
supply
dB linear
R
dB linear
supply
dB linear
OK
OK
R
dB linear
OK
OK
supply
dB linear
OK OK
OK
R
dB linear
OK
OK OK
OK OK
supply
dB linear
OK
R
dB linear
supply
dB linear
R
dB linear
750 Hz
800 Hz
850 Hz
900 Hz
950 Hz
1000 Hz
OK
PHASE CURRENT
AXIAL FLUX WITH EMERSON PROBE
AXIAL BODY FLUX WITH HAND-MADE PROBE
RADIAL BODY FLUX WITH HAND-MADE PROBE
RADIAL END-WINDING FLUX WITH HAND-MADE PROBE
OK OK
OK
OK OK
OK OK
OK
OK OK
OK
OK
OK
OK
OK
OK OK
OK OK
OK OK
OK
OK OK
OK OK
OK
OK
OK
OK
OK
OK OK
OK
OK
OK
OK OK
OK OK
OK
OK
OK
OK
OK
OK
OK
OK
TABLE II. SYNTHESIS OF THE LOAD TESTS IN BOTH LINEAR AND LOGARITHMIC SCALE LOADED MOTOR
100 Hz
150 Hz
200 Hz
250 Hz
300 Hz
350 Hz
400 Hz
450 Hz
supply
dB linear
OK
R
dB linear
OK
supply
dB linear
OK
R
dB linear
OK
supply
dB linear
R
dB linear
supply
dB linear
R
dB linear
supply
dB linear
R
dB linear
500 Hz
550 Hz
OK
OK
OK
OK
600 Hz
650 Hz
700 Hz
750 Hz
800 Hz
850 Hz
900 Hz
950 Hz
1000 Hz
PHASE CURRENT
AXIAL FLUX WITH EMERSON PROBE
AXIAL BODY FLUX WITH HAND-MADE PROBE
RADIAL BODY FLUX WITH HAND-MADE PROBE
RADIAL END-WINDING FLUX WITH HAND-MADE PROBE
OK
OK
OK
OK OK OK
OK OK
OK
OK OK
OK
OK OK
OK OK
OK
OK
OK OK
OK OK
OK OK
OK
1786
OK
OK OK
OK
TABLE III. DETAILED RESULTS OF THE LOAD TESTS IN LOGARITHMIC SCALE 100 Hz
150 Hz
200 Hz
250 Hz
300 Hz
350 Hz
400 Hz
450 Hz
500 Hz
550 Hz
600 Hz
650 Hz
700 Hz
750 Hz
800 Hz
850 Hz
900 Hz
950 Hz
1000 Hz
-60,40
-48,30
-75,08
-33,15
-79,64
-66,41
-86,41
-68,79
-80,88
-82,85
-89,76
-74,49
-89,23
-75,85
-87,04
-68,78
-93,13
-75,46
-89,90
SHORT BY SUPPLY
-63,67
-41,26
-70,39
-31,05
-79,99
-55,93
-83,61
-69,14
-85,35
-70,65
-91,94
-68,84
-92,70
-78,78
-90,24
-68,74
-90,02
-72,44
-91,74
Δ Δ >s Δ > 2s Δ > 5s
3,28 !
-7,04 ! !!
-4,70 ! !!
-2,10 !
0,36
-10,48 ! !!
-2,80
0,36
4,46
-12,20 ! !!
2,19
-5,65 !
3,47 !
2,93
3,21
-0,04
-3,11
-3,02
1,85
SHORT BY RESISTANCE
-62,91
-42,48
-68,09
-30,20
-78,10
-53,53
-84,51
-72,11
-86,22
-72,56
-90,88
-70,98
-92,39
-80,18
-84,60
-72,31
-86,45
-71,99
-90,02
Δ Δ >s Δ > 2s Δ > 5s
2,51 !
-5,82 ! !!
-6,99 ! !!
-2,95 ! !!
-1,54
-12,88 ! !!
-1,90
3,32 !
5,34 !
-10,29 ! !!
1,13
-3,51
3,16
4,33
-2,44
3,53
-6,68 ! !!
-3,48
0,12
-50,42
-25,65
-63,18
-28,94
-63,15
-46,48
-64,52
-68,21
-74,88
-66,18
-66,32
-64,02
-71,10
-63,20
-71,40
-66,80
-74,00
-64,44
-72,08
SHORT BY SUPPLY
-47,94
-26,02
-59,59
-31,49
-59,44
-49,23
-64,42
-60,63
-69,08
-63,91
-66,92
-63,88
-68,27
-62,52
-73,04
-69,18
-75,64
-65,73
-75,45
Δ Δ >s Δ > 2s Δ > 5s
-2,48 !
0,37
-3,59 !
2,55 !
-3,71 !
2,75 !
-0,10
-7,58 ! !!
-5,79 ! !!
-2,27 !
0,60
-0,13
-2,82 !
-0,68
1,65
2,38
1,64
1,29
3,37 !
SHORT BY RESISTANCE
-44,65
-25,08
-59,91
-28,66
-57,88
-45,86
-62,30
-60,67
-67,37
-64,21
-64,68
-65,55
-66,97
-63,22
-71,27
-63,07
-72,16
-62,40
-72,03
Δ Δ >s Δ > 2s Δ > 5s
-5,78 ! !!
-0,57
-3,27 !
-0,27
-5,26 !
-0,62
-2,22 !
-7,54 ! !!
-7,51 ! !!
-1,97 !
-1,64 !
1,54
-4,12 ! !!
0,01
-0,13
-3,74 !
-1,84 !
-2,04
-0,05
-34,72
-8,00
-47,05
-14,99
-49,48
-28,40
-60,19
-41,08
-60,21
-47,57
-60,59
-49,06
-61,95
-55,15
-63,31
-48,45
-67,00
-54,93
-65,73
SHORT BY SUPPLY
-36,20
-8,56
-48,93
-15,27
-61,47
-29,27
-68,48
-49,49
-69,27
-48,99
-65,83
-47,28
-70,25
-58,46
-72,32
-52,47
-73,51
-61,20
-72,92
Δ Δ >s Δ > 2s Δ > 5s
1,49
0,57
1,87
0,28
11,98 ! !!
0,87
8,29 ! !!
8,41 ! !!
9,06 ! !!
1,42
5,24 ! !!
-1,79
8,31 ! !!
3,31 !
9,01 ! !!
4,02 !
6,51 ! !!
6,27 !
7,18 ! !!
SHORT BY RESISTANCE
-27,97
-7,00
-47,39
-14,31
-40,27
-27,54
-49,37
-39,29
-45,25
-41,19
-43,16
-46,16
-43,37
-49,92
-55,68
-52,18
-46,63
-52,38
-55,12
Δ Δ >s Δ > 2s Δ > 5s
-6,75 ! !!
-1,00
0,34
-0,68
-9,22 ! !!
-0,86
-10,82 ! !!
-1,79
-14,97 ! !! !!!
-6,38 ! !!
-17,44 ! !! !!!
-2,91 !
-18,57 ! !! !!!
-5,23 !
-7,63 ! !!
3,73 !
-20,37 ! !! !!!
-2,55
-10,62 ! !!
-39,52
-9,29
-58,45
-19,14
-55,93
-32,14
-63,27
-53,83
-68,84
-51,39
-66,20
-56,48
-67,96
-64,05
-69,25
-62,65
-72,12
-67,59
-71,54
SHORT BY SUPPLY
-33,73
-14,60
-40,91
-48,42
-52,38
-43,16
-58,12
-50,13
-60,58
-60,75
-66,16
-61,91
-60,41
-66,64
-63,22
-66,70
-67,58
-67,26
-67,52
Δ Δ >s Δ > 2s Δ > 5s
-5,79 ! !!
5,31 ! !!
-17,54 ! !! !!!
29,29 ! !! !!!
-3,56 !
11,03 ! !! !!!
-5,15 !
-3,71 !
-8,26 ! !!
9,36 ! !!
-0,04
5,44 !
-7,55 ! !!
2,59
-6,04 ! !!
4,04
-4,54 !
-0,33
-4,02 !
SHORT BY RESISTANCE
-54,99
-13,72
-60,05
-34,97
-57,69
-40,20
-64,58
-48,29
-68,97
-61,04
-67,53
-66,38
-71,51
-71,66
-74,08
-67,64
-74,84
-73,49
-74,78
Δ Δ >s Δ > 2s Δ > 5s
15,48 ! !! !!!
4,43 ! !!
1,60
15,84 ! !! !!!
1,75
8,06 ! !!
1,32
-5,54 ! !!
0,12
9,65 ! !!
1,33
9,91 ! !!
3,56 !
7,61 ! !!
4,83 !
4,99
2,71 !
5,89 !
3,25 !
-33,45
-25,59
-52,65
-13,85
-52,76
-33,13
-60,03
-47,89
-56,91
-49,83
-54,00
-47,04
-57,02
-60,27
-61,57
-44,45
-62,44
-57,66
-62,53
SHORT BY SUPPLY
-29,03
-23,53
-38,63
-12,95
-49,44
-30,39
-58,12
-42,78
-54,00
-54,38
-47,34
-52,24
-47,99
-52,06
-59,50
-48,76
-53,67
-56,60
-58,22
Δ Δ >s > Δ 2s Δ > 5s
-4,41 ! !!
-2,06 !
-14,01 ! !!
-0,90
-3,32 !
-2,73 !
-1,91
-5,11 ! !!
-2,92 !
4,55 !
-6,66 ! !!
5,20 ! !!
-9,03 ! !!
-8,21 ! !!
-2,07
4,31
-8,76 ! !! !!!
-1,06
-4,31 ! !!
SHORT BY RESISTANCE
-33,64
-25,61
-50,37
-13,71
-51,48
-33,71
-59,74
-46,51
-55,16
-49,38
-55,43
-55,22
-57,59
-54,90
-64,04
-47,18
-64,55
-56,20
-61,72
Δ Δ >s Δ > 2s Δ > 5s
0,19
0,03
-2,27
-0,15
-1,28
0,58
-0,29
-1,38
-1,75
-0,45
1,43
8,19 ! !!
0,57
-5,37 ! !!
2,47 !
2,73
2,11 !
-1,46
-0,81
RATED LOAD PHASE CURRENT HEALTHY
AXIAL EMERSON FLUX HEALTHY
AXIAL BODY FLUX HEALTHY
RADIAL BODY FLUX HEALTHY
RADIAL WINDING FLUX HEALTHY
1787 Powered by TCPDF (www.tcpdf.org)