Unsymmetric Dinuclear Copper(II) Complexes
Bull. Korean Chem. Soc. 2011, Vol. 32, No. 5 1669 DOI 10.5012/bkcs.2011.32.5.1669
New Unsymmetric Dinuclear Copper(II) Complexes of Trans-disubstituted Cyclam Derivatives: Spectral, Electrochemical, Magnetic, Catalytic, Antimicrobial, DNA Binding and Cleavage Studies R. Prabu, A. Vijayaraj, R. Suresh, L. Jagadish,† V. Kaviyarasan,† and V. Narayanan* Department of Inorganic Chemistry, School of Chemical Sciences, †Centre for Advanced Studies in Botany, University of Madras, Guindy Maraimalai Campus, Chennai-600 025, India. *E-mail:
[email protected] Received January 28, 2011, Accepted March 30, 2011 Six new binuclear copper(II) complexes have been prepared by template condensation of the dialdehydes 1,8[bis(3-formyl-2-hydroxy-5-methyl)benzyl]-l,4,8,11-tetraazacyclotetradecane (PC-a) and 1,8-[bis(3-formyl-2hydroxy-5-bromo)benzyl]-l,4,8,11-tetraazacyclotetradecane (PC-b) with appropriate aliphatic diamines, and copper(II) perchlorate. The structural features of the complexes have been confirmed by elemental analysis, IR, UV-vis and mass spectra etc. The electrochemical behavior of all the copper(II) complexes show two irreversible one electron reduction process. The room temperature magnetic moment studies depict the presence of an antiferromagnetic interaction in the binuclear complexes. The catechol oxidation and hydrolysis of 4-nitrophenylphosphate were carried out by using the complexes as catalyst. The antimicrobial screening data show good results. The binding of the complexes to calf thymus DNA (CT DNA) has been investigated with absorption and emission spectroscopy. The complex [Cu2L1a] displays significant cleavage property of circular plasmid pBR322 DNA in to linear form. Spectral, electrochemical, magnetic and catalytic studies support the distortion of the copper ion geometry that arises as the macrocyclic ring size increases. Key Words : Cyclam, Binuclear copper(II) complexes, Magnetic properties, Antimicrobial activity, DNA binding and cleavage studies
Introduction Polyazamacrocycles bearing coordinating side arms1 have found applications in many domains such as medicine with for example radioimmunotherapy,2 catalysis3 and ion-selectivity.4 The coordination chemistry of tetraaza macrocycles with various substituents has been studied elsewhere and extensively.5,6 Recent topic in this field is the discovery of the DNA binding and cleaving activity of tetraaza macrocycles.7 Among them, 1,4,8,11-tetraazacyclotetradecane (cyclam) is more appropriate for transition and lanthanide metal ions as a larger ring allows planar coordination of all nitrogen atoms.8 Moreover, nucleophilic substitutions with secondary amines allow the easy introduction of pendant functional groups onto the macrocycle. This leads to the increase of the number of coordinating sites on the ligand to form stable complexes with ions requiring high coordination numbers, such as heavy metals. The selectivity of the ligand toward a metal ion can be modified by changing the nature of the pendant group and the length of the carbon chain.9 Schiff bases are important intermediates for the synthesis of some bioactive compounds.10-12 Furthermore, they show a variety of interesting biological actions, including antibacterial, antifungal13-17 and anticancer activity.18-20 The development of the chemistry of binuclear metal complexes has been stimulated by a desire to synthesize model systems that may mimic the active sites of metallo-biomolecules.21-25 The binuclear copper(II) complexes have wealth of appli-
cations in magnetochemistry26-28 and homogeneous catalysis.29 From Robson’s pioneering work on binuclear copper(II) complexes with phenolate endogeneous bridge, a lot of work has been carried out.30 Most of the work is concerned with the studies of symmetrical dicopper complexes and the study on unsymmetrical dicopper complexes is sparse. Synthesis of unsymmetrical binucleating ligands and their copper(II) complexes gains the attention in recent years with the establishment of unsymmetrical nature of the active site of hemocyanin,31 tyrosinase32 and the expectation of interesting redox and magnetic behaviours associated with the chemically different coordination environments around the two copper atoms within the molecule. Transition metal complexes with tunable coordination environments and versatile spectral, electrochemical properties offer a great scope of design for species that are suitable for catecholase, DNA binding and cleavage activities.33 Hence, synthesis of unsymmetrical binuclear copper(II) complexes has gained more attention in recent years. This paper reports a new effect in template Schiff base condensations of dicarbonyl compounds with aliphatic diamines and fine tuning of the macrocyclic structure in accordance with the precise coordination requirements of the metal ion. The macrocyclic ring has two compartments, one of the compartment comprises N4O2 donor atoms and other compartment set comprises N3O2/N4O2 donor atoms. Spectral, magnetic, electrochemical, catalytic, antimicrobial, DNA binding and cleavage studies of the complexes were
1670
Bull. Korean Chem. Soc. 2011, Vol. 32, No. 5
discussed. Experimental Section Analytical and Physical Measurements. Elemental analyses of the complexes were performed by Haereus CHN rapid analyzer. 1H NMR spectra were acquired with a Bruker 300 MHz FT-NMR spectrometer. Electronic spectra were collected on Perkin Elmer Lambda 35 spectrophotometer. FT-IR spectra were recorded on a Perkin Elmer FT-IR spectrometer. Atomic absorption spectral data were recorded using a Varian spectra AA-200 model atomic absorption spectrophotometer. Electrospray ionization (ESI) mass spectra were collected using a Thermo Finnigan LCQ-6000 advantage Max-ESI mass spectrometer. EPR spectra were recorded on powdered samples using a JEOL TES 100 ESR spectrometer. Low temperature EPR measurements were made using a liquid nitrogen Dewar. Variable temperature magnetic susceptibility data were measured over a range of 5-300 K by a Quantum Design MPMS-5S superconducting quantum interference device (SQUID) susceptometer with a field of 0.5 T. Diamagnetic corrections were estimated from Pascal’s constants. Cyclic voltammograms were obtained on a CHI600A electrochemical analyzer using a three electrode setup comprising of a glassy carbon working, platinum wire auxiliary and a Ag/AgCl reference electrode under oxygen free conditions. Molar conductivity was measured with Elico digital conductivity bridge model CM-88 using freshly prepared solution of the complex in acetonitrile. The catalytic oxidation of catechol to o-quinone and hydrolysis of 4-nitrophenylphosphate by the complexes was studied in a 10−5 M dimethylformamide solution. Chemicals and Reagents. 5-Methyl salicylaldehyde,34 3chloromethyl-5-methyl salicylaldehyde, 3-chloromethyl-5bromo salicylaldehyde,35 1,4,8,11-tetraazatricyclo[9.3.1.1[4,8]]hexadecane36 and 1,8-[bis(3-formyl-2-hydroxy-5-methyl)benzyl]-4,11-diazaniatricyclo[9.3.1.1[4,8]]hexadecane dichloride, 1,8-[bis(3-formyl-2-hydroxy-5-bromo)-benzyl]-4,11diazaniatricyclo [9.3.1.1[4,8]]hexadecane dichloride37 were prepared by following the literature methods. TBAP used as supporting electrolyte in electrochemical measurement was purchased from Fluka and recrystallized from hot methanol. CT-DNA and ethidium bromide (EB) were purchased from Bangalore Genie (India). All the experiments involving interaction of the complexes with CT-DNA were carried out in doubly distilled water buffer containing in 50 mM TrisHCl/1 mM NaCl buffer (pH = 7.5). All other reagents are obtained from standard commercial sources and used without further purification. CAUTION! Although no problems were encountered in this work, perchlorate salts of transition metal complexes are potentially explosive and should therefore be prepared in small quantities and handled with care. Antimicrobial and Antifungal Experiments. Antibacterial activities of all the complexes were tested by the well diffusion method using nutrient agar against bacteria and sabouraud dextrose agar against human pathogenic fungus.
R. Prabu et al.
Nutrient and Sabouraud dextrose Agar (20 mL) were poured into each sterilized Petri dish (10 × 100 mm diameter) and allowed to solidify. After solidification the bacterial culture were swabbed in nutrient agar plates and Candida alblicans were swabbed into Sabouraud dextrose plates. For the investigation of the antibacterial and antifungal activity, the metal complexes were dissolved in dimethylsulfoxide (DMSO) to a final concentration of 100 μg/mL. and sterilized by filtration through a 0.22 μm membrane filter. Each sample was filled into the wells of agar plates directly. Plates swabbed with the bacteria culture were incubated at 37 ºC for 48 h, and the fungus were incubated at 37 ºC for 24 h. At the end of the incubation period, inhibition zones formed on the medium were evaluated in mm. Studies were performed in duplicate and the inhibition zones were compared with those of reference discs. Reference values used from reference disc as a control were as follows: Tetracycline (30 μg), Ampicillin (10 μg). All determinations were done in duplicate. DNA Binding and Cleavage Experiments. Using the UV-vis absorption spectral method, the solution of CT DNA gave a ratio of UV absorbance at 260 nm and 280 nm, A260/ A280, of 1.8-1.9, indicating that the CT DNA was sufficiently free of proteins. The stock solution of calf thymus was prepared in 50 mM Tris-HCl/1 mM NaCl buffer (pH = 7.5), stored at 4 oC. The concentration of DNA was determined from its absorption intensity at 260 nm with a molar extinction coefficient of 6600 M−1 cm−1. Absorption titration experiments were made using different concentration of DNA, while keeping the complex concentration as constant. For fluorescence spectral method, Ethidium bromide (EB) as a reference has been employed in examinations of the mode and process of metal complex binding to DNA. Fluorescence intensities of EB at 610 nm with an excitation wavelength of 510 nm were measured at different complex concentrations. Reduction in the emission intensity was observed with addition of the complex. The relative binding tendency of the complexes to DNA was determined from a comparison of the slope of the lines in the fluorescence intensity vs complex concentration plot. The DNA cleavage experiments were done by agarose gel electrophoresis, which was performed by incubation at 37 oC as follows: pBR322 DNA (0.5 μg) in 50 mM Tris-HCl/1 mM NaCl buffer (pH = 7.5) was treated with complex [Cu2L1a] in the absence of additives. Syntheses. Preparation of Precursor Compounds: The precursor compounds 1,8-[bis(3-formyl-2-hydroxy-5-methyl)benzyl]l,4,8,11-tetraazacyclotetradecane (PC-a) and 1,8-[bis(3formyl-2-hydroxy-5-bromo)benzyl]-l,4,8,11-tetraazacyclotetradecane (PC-b) was synthesized and by using the same procedure as reported earlier.38 Preparation of the Complex [(Cu2L1a)(ClO4)](ClO4): The binuclear copper(II) complex was prepared by taking the hot suspension of PC-a (1.00 g, 0.002 mol) dissolved in MeOH (40 mL) and adding copper(II) perchlorate hexahydrate (0.74 g, 0.002 mol) dissolved in MeOH (40 mL), followed by the addition of diethylenetriamine, (0.22 g,
Unsymmetric Dinuclear Copper(II) Complexes
0.002 mol) and triethylamine (0.2 g, 0.002 mol). After one hour another one equivalent of copper(II) perchlorate hexahydrate (0.74 g, 0.002 mol) was added and refluxed for 24 h. The reaction mixture was filtered and allowed to stand at room temperature. A dark green precipitate was collected on evaporation of the resulting solution to half of the volume, washed with cold methanol and recrystallization from acetonitrile. Yield: 1.59 g (79%). Analytical data for C32H47O10N7Cl2Cu2: Calc. (M.Wt: 887.75): C, 43.30; H, 5.34; N, 11.04; Cu, 14.32. Found: C, 43.36; H, 5.29; N, 11.11, Cu, 14.38%. Selected IR data (KBr disc) (ν/cm−1): 3268 ν (NH), 1643 ν (C=N), 1551 (Phenoxide bridge), [1100, 1104, and 1093 Coordinated ClO4−] and 625 ν (ClO4−). ESI-MS in CH3CN: m/z: [Cu2(L1a)-2ClO4-H]+ (689.41), [Cu2(L1a)-2ClO4]2+ (344.23). Conductance (Λm/S cm2 mol−1) in CH3CN: 148. g = 2.05; µeff : 1.34 B.M. Preparation of the Complex [Cu2L1b](ClO4)2: [Cu2L1b] was synthesized by following the previously described procedure for [Cu2L1a], using PC-b of instead of PC-a. The dark green compound was obtained. Yield: 1.42 g (75%). Analytical data for C30H41O10N7Br2Cl2Cu2: Calc. (M.Wt: 1017.49): C, 35.41; H, 4.06; N, 9.64, Cu, 12.49. Found: C, 35.36; H, 4.12; N, 9.59, Cu, 12.42%. Selected IR data (KBr disc) (ν/cm−1): 3260 ν (NH), 1638 ν (C=N), 1553 (Phenoxide bridge), [1102, 1098, 1092 Coordinated ClO4−], 624 ν (ClO4−). ESI-MS in CH3CN: m/z: [Cu2(L1b)-2ClO4-H]+ (818.02), [Cu2(L1b)-2ClO4]2+ (408.92). Conductance (Λm/S cm2 mol−1) in CH3CN: 155. g = 2.08; µeff : 1.38 B.M. Preparation of the Complex [Cu2L2a](ClO4)2: The binuclear copper(II) complex was prepared by taking the hot suspension of PC-a (1.00 g, 0.002 mol) dissolved in MeOH (40 mL) and adding copper(II) perchlorate hexahydrate (0.74 g, 0.002 mol) dissolved in MeOH (40 mL), followed by the addition of triethylenetetramine, (0.29 g, 0.002 mol) and triethylamine (0.2 g, 0.002 mol). After one hour another one equivalent of copper(II) perchlorate hexahydrate (0.74 g, 0.002 mol) was added and refluxed for 24 h. The reaction mixture was filtered and allowed to stand at room temperature. A dark green precipitate was collected on evaporation of the resulting solution to half the volume, washed with methanol and recrystallization from acetonitrile. Yield: 1.62 g (80%). Analytical data for C34H52O10N8Cl2Cu2 (M.Wt: 930.82): Calc.: C, 43.87; H, 5.63; N, 12.04, Cu, 13.65. Found: C, 43.79; H, 5.55; N, 12.11, Cu, 13.71%. Selected IR data (KBr disc) (ν/cm−1): 3287 ν (NH), 1640 ν (C=N), 1551 (Phenoxide bridge), 1088 (s, uncoordinated ClO4−) and 625 ν (ClO4−). ESI-MS in CH3CN: m/z: [Cu2(L2a)-2ClO4-H]+ (732.14), [Cu2(L2a)-2ClO4]2+ (365.52). Conductance (Λm/S cm2 mol−1) in CH3CN: 256. g = 2.10; µeff : 1.39 B.M. Preparation of the Complex [Cu2L2b](ClO4)2: [Cu2L2b] was synthesized by following the previously described procedure for [Cu2L2a], using PC-b instead of PC-a. The dark green compound was obtained. Yield: 1.50 g (73%). Analytical data for C32H46O10N8Br2Cl2Cu2: Calc. (M.Wt: 1060.56): C, 36.25; H, 4.37; N, 10.57, Cu, 11.98. Found: C, 36.33; H, 4.30; N, 10.45, Cu, 11.90%. Selected IR data (KBr disc) (ν/ cm−1): 3280 ν (NH), 1634 ν (C=N), 1552 (Phenoxide bridge),
Bull. Korean Chem. Soc. 2011, Vol. 32, No. 5
1671
1088 (s, uncoordinated ClO4−) and 624 ν (ClO4−). ESI-MS in CH3CN: m/z: [Cu2(L2b)-2ClO4-H]+ (861.63), [Cu2(L2b)-2ClO4]2+ (430.72). Conductance (Λm/S cm2 mol−1) in CH3CN: 267. g = 2.07; µeff : 1.45 B.M. Preparation of the Complex [Cu2L3a](ClO4)2: The binuclear copper(II) complex was prepared by taking the hot suspension of PC-a (1.00 g, 0.002 mol) dissolved in MeOH (40 mL) and adding copper(II) perchlorate hexahydrate (0.74 g, 0.002 mol) dissolved in MeOH (40 mL), followed by the addition of N,N'-Bis-(3-aminopropylamino)ethylenediamine, (0.35 g, 0.002 mol) and triethylamine (0.2 g, 0.002 mol). After one hour another one equivalent of copper(II) perchlorate hexahydrate (0.74 g, 0.002 mol) was added and refluxed for 24 h. The reaction mixture was filtered and allowed to stand at room temperature. A dark green precipitate was collected on evaporation of the resulting solution to half the volume, washed with methanol and recrystallization from acetonitrile. Yield: 1.71 g (80%). Analytical data for C36H56O10N8Cl2Cu2: Calc. (M.Wt: 958.88): C, 45.09; H, 5.89; N, 11.69, Cu, 13.25. Found: C, 45.17; H, 5.79; N, 11.77, Cu, 13.17%. Selected IR data (KBr disc) (ν/cm−1): 3293 ν (NH), 1640 ν (C=N), 1551 (Phenoxide bridge), 1090 (s, uncoordinated ClO4−) and 626 ν (ClO4−). ESI-MS in CH3CN: m/z: [Cu2(L3a)-2ClO4-H]+ (760.40), [Cu2(L3a)-2ClO4]2+ (380.27). Conductance (Λm/S cm2 mol−1) in CH3CN: 260. g = 2.11; µeff : 1.37 B.M. Preparation of the Complex [Cu2L3b](ClO4)2: [Cu2L3b] was synthesized by following the previously described procedure for [Cu2L3a], using PC-b instead of PC-a. The dark green compound was obtained. Yield: 1.62 g (76%). Analytical data for C34H50O10N8Br2Cl2Cu2: Calc. (M.Wt: 1088.61): C, 37.51; H, 4.63; N, 10.29, Cu, 11.67. Found: C, 37.85; H, 4.65; N, 10.20, Cu, 11.73%. Selected IR data (KBr disc) (ν/ cm−1): 3286 ν (NH), 1632 ν (C=N), 1554 (Phenoxide bridge), 1093 (s, uncoordinated ClO4−) and 624 ν (ClO4−). ESI-MS in CH3CN: m/z: [Cu2(L3b)-2ClO4-H]+ (889.67), [Cu2(L3b)-2ClO4]2+ (444.34). Conductance (Λm/S cm2 mol−1) in CH3CN: 276. g = 2.10; µeff : 1.40 B.M. Results and Discussions Using template method, a serious of macrocyclic binuclear copper(II) complexes were synthesized by Schiff base condensation of the precursor compounds with aliphatic diamines in presence of metal ion. The synthetic pathway of binuclear complexes is shown in Scheme 1. Spectral Studies. The FT IR spectrum of the precursor compounds (PC-a & PC-b) show band at around 1680 cm−1 due to the presence of -CHO group, the band around 3290 cm−1 is due to -NH stretching frequency and the sharp peak at 3400 cm−1 is assigned to the phenolic ν -(OH) group. All the copper(II) complexes show bands in the region at 32603310 cm−1 indicating the presence of -NH groups in the complexes. The absence of peak around 3400 cm−1 in the complexes indicates the absence of -OH due to the deprotonation followed by complexation. The complexes show a sharp band in the region of 1630-1650 cm−1 due to the
1672
Bull. Korean Chem. Soc. 2011, Vol. 32, No. 5
R. Prabu et al.
(i) Diethylenetriamine (ii) Triethylenetetramine (iii) N,N'-Bis-(3-(3-aminopropylamino) ethylenediamine (iv) 2 Cu(ClO4)2·6H2O (v) Triethylamine Scheme 1
presence of -C=N in the complexes.39 The effective Schiff base condensation is observed by the formation of this new peak and the disappearance of the ν -(C=O) peak at 1680 cm−1 in the complexes. The complex Cu2L1a,b show sharp peak around 1100 cm−1, which is split, clearly explains the presence of a coordinated perchlorate ion,40 and in the other complexes Cu2L2,3 the perchlorate peak around 1100 cm−1 does not show any splitting, indicating the presence of an uncoordinated perchlorate ion.41 The complexes show another peak due to perchlorate ion at around 624 cm−1. Further, the appearance of new bands in the region 15301560 cm−1 indicates that all the complexes have phenoxide bridging with the metal ions.42 The absorption spectral data obtained experimentally are summarized in Table 1. UV-vis absorption spectra of all the complexes in DMF solution, display intense absorbance in the range of 260-270 nm due to intra ligand charge transfer transition. A moderately intense band observed in the range of 382-390 nm is assigned to ligand to metal charge transfer transition and a weak band observed in the visible range at 547-560 nm and a shoulder at around 745 nm are due to d-d transition which are characteristic of Cu2+ in a six coordination environment.43 The electronic spectral studies inferred a shift in λmax (red shift) of the d-d transition of the copper(II) ion in the complex [Cu2L1–3] which indicates that the coordination geometry around the copper atom of the complexes is more distorted and with an increase in the size of the macrocyclic ligand is noted. This is due to the flexi-
bility of the macrocyclic ring upon increasing the chain length of the imine compartment, which causes more distortion of the geometry.44 The electron spray ionization mass spectra of all the binuclear copper(II) complexes were studied in positive mode. The ESI-MS data show the parent ion peak indicating the stability of the structure in a solution phase. The experimental results show that two Cu2+ ions present as a whole binuclear entity in solution. The ESI mass spectral data of the copper(II) complexes confirm the proposed formula of the complexes. The ESI mass spectra of all the complexes given in supplementary material. The different fragments of the complex give the peaks with various intensities at different m/z values.45,46 The X-band EPR spectra of the binuclear copper(II) complexes were recorded at liquid nitrogen temperature (77 K). Table 1. Electronic spectral data of binuclear copper(II) complexes No. Complexes 1 2 3 4 5 6
[Cu2L1a] [Cu2L1b] [Cu2L2a] [Cu2L2b] [Cu2L3a] [Cu2L3b]
[λmax, (nm) (ε, M−1 cm−1)] d-d
Charge transfer
748 (90), 560 (180) 745 (97), 558 (165) 744 (80), 555 (195) 743 (95), 556 (155) 740 (70), 550 (205) 741 (91), 547 (230)
390 (10 680), 270 (17 650) 389 (11 095), 267 (18 152) 385 (10 985), 265 (18 650) 386 (11 250), 264 (18 500) 383 (11 985), 261 (18 865) 382 (11 650), 260 (18 900)
Unsymmetric Dinuclear Copper(II) Complexes
Bull. Korean Chem. Soc. 2011, Vol. 32, No. 5
1673
Table 2. Electrochemical, Catecholase and Hydrolysis of 4-Nitrophenylphosphate data of the copper(II) complexes S.No Complexes 1 2 3 4 5 6
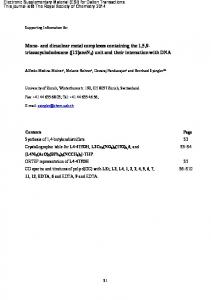
Figure 1. Temperature dependent magnetic behaviors for the complex [Cu2L2a].
All the binuclear copper(II) complexes show a broad spectra centered at g: 2.05-2.11, which show the presence of an antiferromagnetic interaction between the two copper ions.45,47 These observations confirm the occurrence of super exchange coupling between the copper(II) ions in complexes. Magnetic Studies. The magnetic susceptibility measurement of the complex [Cu2L2a] was measured in the temperature range 5-300 K in an applied external magnetic field of 0.5 T. The behavior of the magnetic susceptibility for the complex [Cu2L2a] is given by the plots of χm and χm T vs T, which is shown in Figure 1. The cm values at 300 K is 0.003 cm3 mol−1 and gradually increases from ambient temperature to 60 K and then suddenly increases to 0.09 cm3 mol−1 at 5 K. The global feature is characteristic of a very strong antiferromagnetic coupling between two Cu(II) ions with some amount of paramagnetic impurities.48-51 The χmT versus T plot is also indicative of very strong antiferromagnetic coupling exchange interactions between the adjacent copper ions. It starts at 0.339 cm3 mol−1 and increases slightly with lowering the temperature at 24.3 K reaches a maximum of 0.45 cm3 mol−1 and further decreases with decrease in temperature upto 7 K. Below this temperature χm T increases and reaches a value of 0.47 cm3 mol−1 at 5 K. A small amount of monomeric impurity is responsible for increase in susceptibility below 7 K. The room temperature magnetic moment values observed for the binuclear copper(II) complexes ranges from 1.35 to 1.42 B.M. conveying the presence of an antiferromagnetic interaction between the two copper(II) ions. Variable temperature magnetic susceptibility study of the complex [Cu2L2a] shows that the calculated –2J values are in the range of 219 cm−1 which convey a spin-spin interaction between the two copper(II) ions. To evaluate the singlet-triplet energy separation (–2J), a variable-temperature magnetic study of the binuclear complexes was carried out in the temperature range 5-300 K and the experimental magnetic susceptibility values were fitted to the modified Bleany-Bowers equation.52
[Cu2L1a] [Cu2L1b] [Cu2L2a] [Cu2L2b] [Cu2L3a] [Cu2L3b]
Reduction (cathodic) Rate constant (k) min−1 E1pc(V)
E2pc (V)
Catecholase
NPP
−0.62 −0.57 −0.58 −0.53 −0.51 −0.45
−1.40 −1.31 −1.37 −1.28 −1.34 −1.26
6.64 × 10⁻⁵ 6.97 × 10⁻⁵ 7.17 × 10⁻⁵ 7.29 × 10⁻⁵ 8.56 × 10⁻⁵ 9.01 × 10⁻⁵
3.52 × 10⁻⁴ 3.60 × 10⁻⁴ 4.10 ×10⁻⁴ 4.60 × 10⁻⁴ 4.78 × 10⁻⁴ 5.12 × 10⁻⁴
Measured spectrophotometrically in DMF. Concentration of the complexes: 1 × 10⁻⁵ M. Concentration of Catecholase and 4-nitrophenylphosphate (NPP): 1 × 10⁻³ M.
monomeric copper(II) impurities, –2J is the singlet-triplet energy separation and other symbols have their usual meanings. N has been fixed as 120 × 10−6 cm3 mol−1 and g has been fixed at 2.20. A non-linear least square fitting program was employed to calculate –2J, g and ρ. This may be due to the distorted geometry around the copper atoms in the imine compartment, which causes more distortion of the geometry.53 Electrochemical Studies. The molar conductance values was found to be in the range from 148 to 155 S cm2 mol−1 for [Cu2L1], suggesting that the complex belongs to 1:1 electrolyte and molar conductance values were found to be in the range from 256 to 276 S cm2 mol−1 for [Cu2L2,3], suggesting that the complex belongs to 1:2 electrolyte type.54 The redox behavior of the complexes has been studied using cyclic voltammetry in the potential in the range of 0 to –1.60 V in dimethylformamide containing 10−1 M tetra(n-butyl) ammonium perchlorate. The voltammetric data are summarized in Table 2. Cyclic voltammogram for all the complexes of [Cu2L1-2](scan rate) 50 mV s−1) are displayed in Figure 2 & 3. All the complexes show two irreversible one electron transfers in the cathodic region in the range of –0.45 to –1.40 V.55 Controlled potential electrolysis was also carried out and the experiment reports that each couple corresponds to a one electron transfer process. So, the two redox processes are assigned as follows,
χm = {Ng2β2/3kT)[3 + exp(–2J/kT)]−1 (1–P)+(0.45ρ/T)+Nα Where, χm is the paramagnetic susceptibility per metal atom after the correction for diamagnetism, P is the fraction of
Figure 2. Cyclic voltammogram of the binuclear copper(II) complexes. (a) [Cu2L1a], (b) [Cu2L2a] (Reduction process)
1674
Bull. Korean Chem. Soc. 2011, Vol. 32, No. 5
Figure 3. Cyclic voltammogram of the binuclear copper(II) complexes. (a) [Cu2L1b], (b) [Cu2L2b] (Reduction process)
CuIICuII → CuIICuI → CuICuI The electrochemical data show that the complexes [Cu2L1b], [Cu2L2b] and [Cu2L3b] undergo reduction at less negative potential (E1pc = – 0.57 V and E2pc = –1.31 V, E1pc = –0.53 V and E2pc = –1.28 V) and E1pc = –0.45 V, E2pc = –1.26 V) when compared to the complexes [Cu2L1a], [Cu2L2a] and [Cu2L3a] (E1pc = – 0.62 V and E2pc = –1.40 V, –0.58 V, E2pc = –1.37 V and E1pc –0.51 V, E2pc = –1.34 V). This behavior can be explained as follows. In the complexes [Cu2L1b], [Cu2L2b] and [Cu2L3b] the electron density on the copper atoms will be less, due to the effective withdrawal of electron by the bromine atom in the phenolic ring when compared to the complexes of the ligand [Cu2L1a], [Cu2L2a] and [Cu2L3a]. The reduction potential of the binuclear copper(II) complexes of ligands [Cu2L1a], [Cu2L2a] and [Cu2L3a] (E1pc = –0.62 V and E2pc = –1.40 V, E1pc = –0.58 V, E2pc = –1.37 V, and E1pc = –0.51 V, E2pc = –1.34 V shifts anodically when compared to the complexes [Cu2L1b], [Cu2L2b] and [Cu2L3b] (E1pc = –0.57 V and E2pc = –1.31 V, E1pc = –0.53 V and E2pc = –1.28 V and E1pc = –0.45 V and E2pc = –1.26 V as the macrocyclic ring size increases. The interesting feature noted for the binuclear complexes is anodic shifting of both first and second reduction potentials as the size of the macrocycle is increases.56 Thus, the whole macrocyclic ring becomes more flexible and hence undergoes easy reduction. The large size of the cavity easily holds the reduced cation and stabilizes the formation of Cu2(I) in the compartment. Kinetic Studies. Oxidation of Catechol: The catalytic oxidation of pyrocatechol to the corresponding o-quinone by the copper(II) complexes as biomimetic catalyst has been employed in this study. The o-quinone produced can be followed spectrophotometrically for nearly 45 min at regular time intervals of 5 min. For this purpose, 10−5 mol dm−3 solutions of the complexes in DMF were treated with 100 equivalents of pyrocatechol in the presence of air.57 The slope was determined by the method of initial rates by monitoring the growth of the 390 nm band of the product o-quinone. The initial rate
R. Prabu et al.
constant values for the binuclear copper(II) complexes [Cu2L1-3] are show in the Table 2. The catalytic activities of binuclear complexes are found to increase as the macrocyclic ring size increases due to the intrinsic flexibility because of which the metal ion easily gets reduced and binds with the substrate and the same was supported by both spectral and electrochemical studies.58 Structural features and electrochemical properties are important factors in determining the catalytic activity of the complexes. The catalytic activity of the complexes as shown in following order [Cu2L3b] > [Cu2L3a] > [Cu2L2b] > [Cu2L2a] > [Cu2L1b] > [Cu2L1a] and also the complexes containing electron-withdrawing groups show higher catalytic activity than complexes with electron donating substituents at the para position. This may be due to the para substituents of the phenoxide of the phenyl ring.59 This is consistent with previous studies which showed that binuclear copper complexes, generally, have higher reactivity for the oxidation of catechol to corresponding quinone than mononuclear complexes. The initial rate constant values for all the binuclear copper(II) complexes [Cu2L1-3] are from 6.64 × 10⁻⁵ to 9.01 × 10⁻⁵ min−1. The catalytic activity of the complexes [Cu2L1a,2a&3a] are comparatively lower than that of the complexes [Cu2L1b,2b&3b], which may be due to the increase in macrocyclic ring size. Hydrolysis of 4-Nitrophenylphosphate: The catalytic activity of the binuclear copper(II) complexes on the hydrolysis of 4-nitrophenylphosphate was determined spectrophotometrically by monitoring the increase of the 4-nitrophenolate anion characteristic absorption at 420 nm over the time in DMF at 25 oC as described previously.60 For this purpose, 1 × 10⁻⁵ mol dm−3 solutions of the complexes in DMF were treated with 1 × 10⁻⁵ mol dm−3 solutions of 4nitrophenylphosphate in the presence of air. The observed initial rate constants for the complexes are given in Table 2. The reactivity of the complexes differs significantly by varying the side arm of the imine compartment. The catalytic activity of the complexes of [Cu2L1b,2b&3b] is higher than that of the complexes [Cu2L1a,2a&3a], respectively. This may be due to the para substituents of the phenoxide of the phenyl ring. The complexes containing electron-withdrawing groups show higher catalytic activity than complexes with electron donating substituent at the para position.59 It can be seen that if the reduction potential is too negative, The complexes [Cu2L1] have lower catalytic activity compared to the complexes [Cu2L2,3], which may be due to the increase in macrocyclic ring size. The initial rate constant values for all the binuclear copper(II) complexes [Cu2L1-3] are from 3.52 × 10⁻⁴ to 5.12 × 10⁻⁴ min–1. Screening of Antimicrobial Activities. The in vitro evaluation of antimicrobial activity of all the prepared binuclear copper(II) complexes were carried out against selected bacteria such as Staphylococcus aureus, Bacillus cereus, Escherichia coli, Klebsiella pneumonia, Pseudomonas aeruginosa, Streptococcus mutans, and (fungus) Candida albicans, according to the diffusion technique and values for the complexes are given in Table 3. The presence of a cyclam unit in the molecule does apparently improve the activity of
Unsymmetric Dinuclear Copper(II) Complexes
Bull. Korean Chem. Soc. 2011, Vol. 32, No. 5
1675
Table 3. Antimicrobial properties of the complexes Test bacteria S. a B. c E. c K.p S.m P. a Test Fungus C. a
Zone of Inhibition (mm) 100 µg/mL [Cu2L1a]
[Cu2L1b]
[Cu2L2a]
[Cu2L2b]
[Cu2L3a]
[Cu2L3b]
A
T
13 ± 0.1 10 ± 0.2 11 ± 0.1 11 ± 0.2 7 ± 0.1 -
14 ± 0.2 11 ± 0.1 12 ± 0.1 14 ± 0.3 9 ± 0.2 -
17 ± 0.1 13 ± 0.2 13 ± 0.1 15 ± 0.1 9 ± 0.2 11 ± 0.2
17 ± 0.2 14 ± 0.1 13 ± 0.2 16 ± 0.1 10 ± 0.1 12 ± 0.2
18 ± 0.2 15 ± 0.2 14 ± 0.2 17 ± 0.2 13 ± 0.2 14 ± 0.2
19 ± 0.2 16 ± 0.2 15 ± 0.2 18 ± 0.2 15 ± 0.2 14 ± 0.2
31 28 NT NT NT NT
20 7 8 5 12 8
10 ± 0.1
11 ± 0.2
13 ± 0.1
14 ± 0.2
14 ± 0.2
15 ± 0.2
NT
-
Notes: Staphylococcusaureus = S.a., Bacilluscereus = B.c., Escherichiacoli = E.c., Klebsiellapneumonia = K.p., Streptococcus mutans = S.m., Pseudomonas aeruginosa = P.a., Candida albicans = C.a., A = Ampicillin (10 µg), T = Tetracycline (30 µg), (NT) = Nottested, (−) = Noinhibition.
of [Cu2L1a] and [Cu2L2a] respectively. The spectrophotometric titration of two complexes is shown in Figure 4 & 5. The complexes bound to DNA through intercalation generally causes hypsochromism and a red shift (bathochromism) of the absorption band due to strong stacking interactions between the aromatic chromophore of the complex and the base pairs of DNA.62 To compare quantitatively the binding strength of the two complexes, the intrinsic binding constants Kb of the two complexes with CT DNA were determined according to the following equation.63
the complexes. It is observed from the results that all the tested complexes show considerable antimicrobial activity. The activity of the present complexes was comparable with the N-substituted tetraazamacrocycles. Generally, copper(II) complexes of N-substituted tetraazamacrocycles show higher activity than their corresponding cobalt(III) complexes.61 Another interesting result observed here is that the complexes of [Cu2L3] show higher activity than the complexes of the ligands [Cu2L1]. It seems from the results that the increase in macrocyclic ring size and the coordinated metal ion plays a significant role in the inhibition activity. DNA Binding Studies. Absorption Spectra: Absorption titration experiments were performed with fixed concentrations of the binuclear copper(II) complexes (40 µM) while gradually increasing the concentration of DNA (10 mM) at 25 oC. While measuring the absorption spectra, an equal amount of DNA was added to both the compound solution and the reference solution to eliminate the absorbance of DNA itself. We have determine the intrinsic binding constant to CT DNA by monitoring the absorption intensity of the chargetransfer spectral band near 253 nm and 232 for the complexes
where [DNA] is the concentration of DNA in base pairs, the apparent absorption coefficients εa, εf and εb correspond to Aobsd/[Cu2], the extinction coefficient for the free complexes and the extinction coefficient for the complexes in the fully bound form, respectively. In plots of DNA]/(εb–εf) versus [DNA], K is given by the ratio of the slope to the intercept. The Kb values obtained from the absorption spectral technique for the complexes [Cu2L1a] and [Cu2L2a] are calculated as 2.76 × 10⁵ and 6.07 × 10⁵ M−1 respectively. Fluorescence Spectra: The binuclear copper(II) complex
Figure 4. Electronic spectra of [Cu2L1a] (40 µM) in the presence of increasing amounts of CT DNA; [DNA] = 0-70 µM. The arrow indicates the absorbance changes upon increasing DNA concentration. Inset: plots of [DNA]/(εa–εf) vs. [DNA] for the titration of DNA with [Cu2L1a] complex.
Figure 5. Electronic spectra of [Cu2L2a] (40 µM) in the presence of increasing amounts of CT DNA; [DNA] = 0-70 µM. The arrow indicates the absorbance changes upon increasing DNA concentration. Inset: plots of [DNA]/(εa–εf) vs. [DNA] for the titration of DNA with [Cu2L2a] complex.
[DNA]/(εa – εf) = [DNA]/(εb – εf) + 1/Kb (εb – εf)
1676
Bull. Korean Chem. Soc. 2011, Vol. 32, No. 5
Figure 6. The emission spectra of DNA-EB system (20 µM and 0.33 µM), λmax = 500 nm, λemi = 510-650 nm, in the presence of 025 µM [Cu2L1a]. The arrow indicates the emission intensity changes upon increasing complex concentration. Inset: Plot of I0/I vs [Cu2L1a] for the titration of [Cu2L1a] complex to CT DNA-EB system.
binding to CT DNA via intercalation is given through the emission quenching experiment. In order to investigate the interaction pattern of complexes of [Cu2L1a] and [Cu2L2a] with DNA, fluorescence emission titration analyses were undertaken. The spectra of complexes of the absence and presence of CT-DNA are shown in Figure 6 & 7. Fluorescence intensities at 601 nm (510 nm excitation) were measured at different complex concentrations. A 2 mL solution of 20 µM DNA and 0.33 µM of EB (at saturating binding level) was titrated by 0-25 µM metal complexes at 25 oC. Addition of the complex showed a reduction in the emission intensity. The reduction of the emission intensity gives a measure of the DNA binding propensity of the complex and stacking interaction (intercalation) between the adjacent DNA base pairs.64 The quenching of EB bound to DNA by complex is in good agreement with the linear Stern-Volmer equation. According to the classical Stern-Volmer equation.
Figure 7. The emission spectra of DNA-EB system (20 µM and 0.33 µM), λmax = 500 nm, λemi = 510-650 nm, in the presence of 025 µM [Cu2L2a]. The arrow indicates the emission intensity changes upon increasing complex concentration. Inset: Plot of I0/I vs [Cu2L2a] for the titration of [Cu2L2a] complex to CT DNA-EB system.
R. Prabu et al.
Figure 8. Agarose Gel electrophoresis photograph of the super coiled pBR322 DNA treated with different concentration of complex of [Cu2L1a]. Lane 1: Represents the 1 kb DNA marker; Lane 2: supercoiled pBR322 DNA without any treatment; Lane 3: pBR322 DNA treated with 100 µM of copper complex; Lane 4: pBR322 DNA treated with 200 µM of copper complex; Form I, II and III represents supercoiled, Nicked circular and linear form pBR 322 DNA respectively.
I0/I = 1 + Ksv[Q] In the linear fit plot of I0/I vs. [complex]/[DNA], Ksv is given by the ratio of the slope to intercept. I0 is the emission intensity of EB-DNA in the absence of complex; I is the emission intensity of EB-DNA in the presence of complex, Q is the concentration of quencher. By taking a CT DNA binding constant of 1.0 × 10⁷ M−1 for EB65 an apparent DNA binding constant 1.25 × 10⁶ M−1 and 1.52 × 10⁶ M−1 was derived for the complex [Cu2L1a], [Cu2L2a] respectively. The Kapp values imply that the complex [Cu2L2a] can strongly interact with DNA than [Cu2L1a] and protected by DNA efficiently.66 DNA Cleavage Studies. In order to assess the cleavage of DNA by the copper(II) complex, agarose gel electrophoresis has been performed with the supercoiled form of plasmid DNA. 0.5 µg of supercoiled pBR322 DNA in the presence of the complex [Cu2L1a] was carried out in a medium of 50 mM Tris-HCl/1 mM NaCl Buffer (pH 7.5). Figure 8 exhibits the concentration dependence of the cleavage reactions. The results were shown in the Table 4. From the Figure 8 shows that the Form I (Super coiled DNA) was converted to Form II (Nicked Circular DNA) at concentration 100 µM of the complex. As the concentration was further increased the appearance of Form III (linear form of the DNA) was also observed. The cleavage efficiency was found to be 35.91% at a concentration of 100 µM and increased to 57.94% at a concentration of 200 µM, out of which 21.28% of the DNA was completely cleaved to Form III (linear). As evident from the literature, complexes of polyamine ligands play an important role due to their good nuclease activity.67 The experiments clearly indicates that complex have the ability of cleave the super coiled DNA without any reducing agent
Unsymmetric Dinuclear Copper(II) Complexes
Bull. Korean Chem. Soc. 2011, Vol. 32, No. 5
1677
Table 4. DNA Cleavage data of the Copper Complex [Cu2L1a] pBR322NA
S No
[Cu2L1a]
Concentration of complex
Form I (%)
Form II (%)
Form III (%)
Cleavage efficiency
1 2 3 4
Lane 1 Control (DNA marker) Lane 2 Control (pBR322 DNA) Lane 3 (DNA + Complex) Lane 4 (DNA + Complex)
100 µM 200 µM
100 64.09 42.06
35.91 36.66
0 21.28
35.91 57.94
or light. The cleavage ability of the complexes might be due to the binding affinity of the complex to the DNA. From the above result, we conclude that the complex have DNA cleavage property along with its DNA binding propensity. Conclusion The new cyclam based six unsymmetrical dicompartmental binuclear copper(II) complexes have been synthesized and characterized by elemental analyses, UV-vis, FT IR, conductivity measurements, electrochemical, magnetic, catalytic, antimicrobial and DNA binding studies were carried out. General structures of all the complexes probably show octahedral coordination geometry around the central metal ions. Magnetic susceptibility measurements show a strong antiferromagnetic interaction between the paramagnetic centers. These complexes have the potential catalysts for the oxidation of catechol to quinones and hydrolysis of 4-nitrophenylphosphate. It has been observed that the small variation in the chain length of the imine compartment and the para substituent of the phenoxide to the phenyl ring increases in catalytic activity of the complexes. All the complexes show good antimicrobial activity. Electronic and fluorescence spectra measurements indicate that these types of complexes can strongly bind with CT-DNA, presumably via an intercalation mechanism. Such type of complexes display significant cleavage property, they convert circular plasmid pBR322 DNA into linear form. These studies indicate that small variation in the ring size of the metal complexes influences the spectral, magnetic, electrochemical and catalytic properties, which agree well with the established trends. Supplementary Material. The ESI mass spectra of all the six copper complexes are given as Supplementary Material. Acknowledgments. Financial support from University Grants Commission, New Delhi is gratefully acknowledged. References 1. Liang, X.; Peter, S. J. Chem. Soc. Rev. 2004, 33, 246. 2. Morphy, J. R.; Parker, D.; Kataky, R.; Harrison, A.; Eaton, M. A. W.; Millican, A.; Phipps, A.; Walker, C. Chem. Commun. 1989, 792. 3. Beley, M.; Collin, J. P.; Ruppert, R.; Sauvage, J. P. J. Am. Chem. Soc. 1986, 108, 7461. 4. Kimura, E.; Koike, T.; Takahashi, M. Chem. Commun. 1985, 385. 5. Prabu, R.; Vijayaraj, A.; Suresh, R.; Shenbhagaraman, R.; Kaviyarasan, V.; Narayanan, V. Spectrochim. Acta Part A 2011, 78, 601.
6. Wainwright, K. P. Coord. Chem. Rev. 1997, 16, 635. 7. Curtis, N. F. J. Chem. Soc. 1964, 2644. 8. Meyer, M.; Dahaoui-Gindrey, V.; Lecomte, C.; Guilard, L. Coord. Chem. Rev. 1998, 178, 1313. 9. Davies, P. J.; Taylor, M. R.; Wainwright, K. P.; Harriott, P.; Duckworth, P. A. Inorg. Chim. Acta 1996, 2461. 10. Taggi, A. E.; Hafez, A. M.; Wack, H.; Young, B.; Ferraris, D.; Lectka, T. J. Am. Chem. Soc. 2002, 124, 6626. 11. Venturini, A.; Gonzalez, J. J. Org. Chem. 2002, 67, 9089. 12. Delpiccolo, C. M. L.; Mata, E. J. Tetrahedron: Asymmetry 2002, 13, 905. 13. Karia, F. D.; Parsania, P. H. Asian J. Chem. 1999, 11, 991. 14. Pandeya, S. N.; Sriram, D.; Nath, G.; De Clercq, E. Il Farmaco 1999, 54, 624. 15. El-Masry, A. H.; Fahmy, H. H.; Abdelwahed, S. H. A. Molecules 2000, 5, 1429. 16. More, P. G.; Bhalvankar, R. B.; Pattar, S. C. J. Indian Chem. Soc. 2001, 78, 474. 17. Kabeer, A. S.; Baseer, M. A.; Mote, N. A. Asian J. Chem. 2001, 13, 496. 18. Pathak, P.; Sharma, K. P. Orient. J. Chem. 2000, 16, 161. 19. Kuzmin, V. E.; Lozitsky, V. P.; Kamalov, G.; Lozitskaya, R. N.; Zheltvay, A. I.; Fedtchouk, A. S.; Kryzhanovsky, D. N. Acta Biochim. Pol. 2000, 47, 867. 20. Desai, S. B.; Desai, P. B.; Desai, K. R. Hetrocycl. Commun. 2001, 7, 83. 21. Sigel, H. Metal Ions in Biological Systems; Dekker: New York, 1981. 22. Karlin, K. D.; Tyeklar, Z. Bioinorganic Chemistry of Copper; Kluwer: New York, 1993. 23. Tsukihara, T.; Aoyama, H.; Yamashita, E.; Tomizaki, T.; Yamaguchi, H.; Shinzawa Itoh, K.; Nakashima, R.; Yaono, R.; Yoshikawa, S. Science 1995, 269, 1069. 24. Iwata, S.; Ostermaier, C.; Ludwig, B.; Michel, H. Nature 1995, 376, 660. 25. Kronek, P. M. H.; Antholine, W. A.; Riester, J.; Zumft, W. G. FEBS Lett. 1988, 242, 70. 26. Willett, D., Gatteschi, G., Eds.; Magneto-Structural Correlations in Exchange Coupled Systems; Nato-ASI Series: Reidal, Dordrecht, The Netherlands, 1985. 27. Kahn, O. Molecular Magnetism; VCH: New York, 1993. 28. Kahn, O. Inorg. Chim. Acta 1982, 62, 3. 29. Fenton, D. E.; Casellato, U.; Vigato, P. A.; Vidali, M. Inorg. Chim. Acta 1982, 62, 57. 30. Robson, R.; Hoskins, B. F.; Schaap, H. Inorg. Nucl. Chem. Lett. 1972, 8, 21. 31. Gaykema, W. P. J.; Volbeda, A.; Hol, W. G. H. J. Mol. Biol. 1985, 187, 2255. 32. Lerch, K. J.; Huber, M.; Schneider, H. J.; Drexel, R.; Linzen, B. J. Inorg. Biochem. 1986, 26, 213. 33. Roy, M.; Pathak, B.; Patra, A. K.; Jemmis, E. D.; Nethaji, M.; Chakravarthy, A. R. Inorg. Chem. 2007, 46, 11122. 34. Casiraghi, G.; Giuseppe, G. G.; Puglia, G.; Sartori, G.; Terenghi, G. J. Chem. Soc., Perkin Trans. 1980, 1, 1862. 35. Wang, Q.; Wilson, C.; Alexander,; Blake, J.; Simon,; Collinson, R.; Peter, A.; Schrodera, M. Tetrahedron Lett. 2006, 47, 8983. 36. Royal, G.; Gindrey, V. D.; Dahaowi, S.; Tabard, A.; Guilard, R.;
1678
Bull. Korean Chem. Soc. 2011, Vol. 32, No. 5
Pullumbi, P.; Lecomte, C. Eur. J. Org. Chem. 1998, 9, 1971. 37. Gayathri, D.; Velmurugan, D.; Ravikumar, K.; Sreedaran, S.; Narayanan, V. Acta Cystallogr., Sect. E 2006, 62, 3714. 38. Sreedaran, S.; Bharathi, K. S.; Rahiman, A. K.; Rajesh, K.; Nirmala, G.; Narayanan, V. J. Coord. Chem. 2008, 61, 3594. 39. Dede, B.; Ozmen, I.; Karipcin, F. Polyhedron 2009, 28, 3967. 40. Lachkar, M.; Guilard, R.; Attamani, A.; De Clan, A.; Fisher, J.; Weiss, R. Inorg. Chem. 1998, 37, 1575. 41. Adam, K. R.; Andereg, G.; Lindoy, L. F.; Lip, H. C.; Mcpartlin, M.; Rea, J. H.; Smith, R. J.; Tasker, P. J. Inorg. Chem. 1980, 19, 2956. 42. Srinivas, B.; Arulsamy, N.; Zacharias, P. S. Polyhedron 1991, 10, 731. 43. Sacconi, L.; Ciampolini, M.; Spero, G. P. J. Am. Chem. Soc. 1965, 87, 3102. 44. Wada, H.; Aono, T.; Moodo, K.; Ohba, M.; Makstumoto, N.; Okawa, H. Inorg. Chem. Acta 1996, 246, 13. 45. Anbu, S.; Kandaswamy, M. Polyhedron 2011, 30, 123. 46. Chen, J. M.; Wei, W.; Feng, X. L.; Lu, T. B. Chem. Asian J. 2007, 2, 710. 47. Thakurta, S.; Rizzoli, C.; Butcher, J.; García, J. G.; Garribbae, E. U.; Mitra, S. Inorg. Chim. Acta 2010, 363, 1395. 48. Roy, T. G.; Hazari, S. K. S.; Dey, B. K.; Miah, H. A.; Olbrich, F. K.; Rehder, D. Inorg. Chem. 2007, 46, 5372. 49. Xie, Y.; Jiang, H.; Chan, A. S .C.; Liu, Q.; Xu, X.; Du, C.; Zhu, Y. Inorg. Chim. Acta 2002, 333, 133. 50. Vaidyatham, M.; Viswanathan, R.; Palaniandavar, M.; Balasubramanian, T.; Prabhaharan,P.; Muthiah,T. P. Inorg. Chem. 1998, 37, 6418. 51. Chattopadhyay, T.; Banu, K. S.; Banerjee, A.; Ribas, J.; Majee,
R. Prabu et al. A.; Nethaji, M.; Das, D. J. Mol. Struc. 2007, 833, 13. 52. Bleany, B.; Bowers, K. D. R. Prog. Soc., London Ser. A 1952, 214, 415. 53. Thompson, K. L.; Mandal, S. K.; Tandon, S .S.; Bridson, J. N.; Park, M. K. Inorg. Chem. 1996, 35, 3117. 54. Geary, J. Coord. Chem. Rev. 1971, 7, 81. 55. Fraser, C.; Bosnich, B. Inorg. Chem. 2002, 41, 1788. 56. Krishnapriya, K. R.; Kandaswamy, M. Polyhedron 2005, 24, 113. 57. Boghaei, D.; Behzad, M.; Bezaatpour, A. J. Mol. Cat. A 2005, 2, 1. 58. Sreenivasulu, B.; Vetrichelvan, M.; Zhao, F.; Gao, S.; Vittal, J. J. Eur. J. Inorg. Chem. 2005, 4635. 59. Mahalakshmy, R.; Venkatesan, R.; Sambasiva Rao, P. S.; Kannappan, R.; Rajendiran, T. M. Trans. Met. Chem. 2004, 29, 623. 60. Bharathi, K. S.; Rahiman, A. K.; Rajesh, K.; Sreedaran, S.; Aravindan, P. G.; Velmurugan, D.; Narayanan, V. Polyhedron 2006, 25, 2859. 61. Roy, T. G.; Hazari, S. K. S.; Dey, B. K.; Miah, H. A.; Bader, C.; Rehder, D. Eur. J. Inorg. Chem. 2004, 4115-4123. 62. Wolfe, A.; Shimer, G. H.; Mechan, T. Biochemistry 1987, 26, 6392. 63. Peng, B.; Chao, H.; Sun, B.; Li, H.; Gao, F.; Ji, L. N. J. Inorg. Biochem. 2006, 100, 1487. 64. Lee, M.; Rhodes, A. L.; Wyatt, M. D.; Forrow, S.; Hartley, J. A. Biochemistry 1993, 32, 4237. 65. Qian, W.; Gu, F.; Gao, L.; Feng, S.; Yan, D.; Liao, D.; Cheng, P. Dalton Trans. 2007, 1060. 66. Grover, N.; Gupta, N.; Singh, P.; Thorp, H. H. Inorg. Chem. 1992, 31, 2014. 67. Li, Q. L.; Huang, J.; Wang, Q.; Jiang, N.; Xia, C. Q.; Lin, H. H.; Wu, J.; Yu, H. Q. Bioorg. Med. Chem. 2006, 14, 4151.