Am. Midl. Nat. 160:191–208
Niche Overlap and Resource Partitioning Between Sympatric Kit Foxes and Coyotes in the Great Basin Desert of Western Utah ADAM J. KOZLOWSKI Department of Wildland Resources, Utah State University, Logan 84322
ERIC M. GESE1 U.S. Department of Agriculture, Wildlife Services, National Wildlife Research Center, Department of Wildland Resources, Utah State University, Logan 84322 AND
WENDY M. ARJO U.S. Department of Agriculture, Wildlife Services, National Wildlife Research Center, 9730-B Lathrop Industrial Drive SW, Olympia, Washington 98512 ABSTRACT.—Successful coexistence of sympatric canid species often relies on the subdominant species’ ability to reduce competition through the differential selection of niche space. Information regarding the process of niche selection and its effect on the structure of canid communities in the Great Basin Desert is unavailable. From Dec. 1999 to Aug. 2001, we quantified the spatial, dietary and temporal resource overlap of kit foxes (Vulpes macrotis) and coyotes (Canis latrans) on the U.S. Army Dugway Proving Ground, Utah. Kit foxes and coyotes demonstrated substantial levels of spatial, temporal and dietary overlap. However, where the two species had overlapping home ranges, space use within the home range differed between the two species, with kit foxes using vegetative and landscape ruggedness characteristics not regularly used by coyotes. Although there was little evidence of seasonal change in either canid’s use of habitat, in some areas kit foxes made nightly movements to more productive habitats with moderate ruggedness. Regardless of spatial partitioning, incidents of interference competition were high; 56% of known kit fox deaths were attributed to coyotes. In our study, high levels of temporal and dietary overlap, kit fox movement from extreme to moderate topography during foraging and selection for abundant cover demonstrated competitive pressures exerted on the kit fox population by the sympatric coyote population.
INTRODUCTION Asymmetrical interactions are often evident among sympatric canid populations when niche differentiation is incomplete (Rosenzweig, 1966; Creel and Creel, 1996; Johnson et al., 1996). In North America, studies have documented the suppression of coyote (Canis latrans) populations by wolves (C. lupus; Dekker, 1989; Schmidt, 1991; Arjo and Pletscher, 1999). Similarly, restrictions of red fox (Vulpes vulpes) movements occurred as a result of interactions with sympatric coyotes (Voigt and Earle, 1983; Sargeant et al., 1987; Harrison et al., 1989). For kit foxes (V. macrotis), coyotes have been identified as an important source of mortality and may regulate kit fox populations (Disney and Spiegel, 1992; Ralls and White, 1995; White and Garrott, 1999). Sometimes niche overlap may cause the competitive exclusion of a species (Volterra, 1926; Lotka, 1932; Gause, 1934). Alternatively, species may avoid exclusion by employing 1
Corresponding author: Telephone: (435)797-2542; FAX: (435)797-0288; e-mail:
[email protected]
191
192
THE AMERICAN MIDLAND NATURALIST
160(1)
isolation mechanisms to reduce overlap and partition common resources (Schoener, 1974; Diamond, 1978). Resource partitioning results in the maximization of habitat availability, the formation of competitive refuges and the facilitation of co-existence (Durant, 1998). Research on interspecific canid coexistence has focused on identifying dietary (e.g., Cypher et al., 1994; White et al., 1995), spatial (e.g., White et al., 1994; Warrick and Cypher, 1998) and temporal (e.g., Zoellick et al., 1989; Kitchen et al., 1999) mechanisms of sympatry. Secondary predator avoidance strategies, such as tree climbing in grey foxes (Urocyon cinereoargenteus) and year-round den use in swift (Vulpes velox) and kit foxes, are important when spatial and temporal avoidance strategies are nonexistent (Wooding, 1984; White et al., 1994; Kitchen et al., 1999). Given the complicated nature of these interactions, coexistence is likely to depend on a combination of isolation mechanisms. Kit fox and coyote distributions have overlapped on the U.S Army Dugway Proving Ground, Utah, since the coyote’s arrival 50 y ago (Shippee and Jollie, 1953). Observations suggest coyote sympatry has been a major factor in the decline and redistribution of kit foxes on Dugway (Egoscue, 1962, 1975; AGEISS, 2001; Arjo et al., 2007). These interspecific interactions, combined with habitat degradation, have raised doubts of the continued coexistence of the two canids on the area. Understanding the effect of sympatry on ecologically similar species is an important step for kit fox conservation. Noticeably absent from the literature is information on the processes shaping the nature and structure of canid communities in the Great Basin of the western United States. This study quantifies the spatial, dietary and temporal resource overlap of coyotes and kit foxes on Dugway Proving Ground as a measure of potential competition. STUDY AREA AND METHODS We conducted research on the 3330-km2 U.S Army Dugway Proving Ground (Dugway), west-central Utah. Located on the lakebed of prehistoric Lake Bonneville, Dugway’s terrain is flat with abrupt rock outcroppings. Elevation ranged from 1288 to 2154 m. Precipitation was limited due to Dugway’s position in a double rain shadow, and evaporation exceeded precipitation during all months of the year. Annual precipitation averaged 20.3 cm (range: 7.62–38.1 cm) with the wettest months being Mar.–May, and Oct.; limited snowfall occurs Nov. through Mar. Springs formed the only year-round natural water sources, but supplemental sources from residential irrigation, sewage ponds and wildlife water catchment systems were also present. Mean temperatures ranged from 25.5 C in Jul. to 22.8 C in Jan. Large temperature fluctuations occurred daily and seasonally, as well as with changes in elevation (AGEISS, 1998). The U.S. Army Dugway Proving Ground was established in 1942 as a remote site for open air testing of biological and chemical weapons. Open air testing was terminated in 1967 and efforts shifted to defensive biological and chemical simulant programs, munitions testing and military obscurant field trials. In 1969 the post was opened to U.S. Army Reserve maneuvers. Present land uses included the firing of artillery, jet aircraft and helicopter flyovers and aerial bombing. Security has precluded recreational vehicle use, cattle grazing and other civilian land use for .50 y. Vegetation was cold northern Great Basin desert shrub punctuated with islands of sagebrush-steppe and juniper. Topography and salt concentrations of the soil were the dominant factors shaping the plant communities. We classified the landscape into seven habitat types: shrub-steppe, grassland, stable dune, chenopod, greasewood, pickleweed and urban. Shrub-steppe was characterized by juniper (Juniper osteosperma), big sagebrush (Artemisia tridentata), greasewood (Sarcobatus vermiculatus), horsebrush (Tetradymia glabrata)
2008
KOZLOWSKI ET AL.: CANID RESOURCE PARTITIONING
193
and viscid rabbit brush (Chrysothamnus viscidiflorus). Grassland was composed of cheatgrass (Bromus tectorum), Russian thistle (Salsola iberica) and peppercress (Lepidium perfoilatum). Stable dune represented the most diverse habitat with four-wing saltbush (Atriplex canescens), greasewood, sage, horsebrush, viscid rabbitbrush, dune rabbitbrush (Chrysothamnus nauseosus var. turbinatus), Indian rice grass (Stipa hymenoides) and dune scurf pea (Psoralidium lanceolatum). The greasewood habitat was largely monospecific. The low-lying chenopod habitat was dominated by shadscale (Atriplex confertifolia) and gray molly (Kochia americana) with some greasewood. The pickleweed habitat was characterized by large expanses of barren salt flat interspersed with pickleweed (Allenrolfea occidentalis), but also included small stable dune hummocks. Urban habitat was characterized by high levels of human activity, anthropogenic debris and structures, fenced enclosures and yards and green lawns. ANIMAL CAPTURE
We captured kit foxes using box traps and modified enclosure traps (Kozlowski et al., 2003). We captured coyotes using aerial net-gunning from a helicopter (Barrett et al., 1982; Gese et al., 1987). We used no chemical immobilization when handling either species. Processing of foxes and coyotes included taking blood samples, affixing ear tags and recording weight, sex and morphological measurements. We aged individuals of both species as pups (,9 mo old), yearlings (9–21 mo) or adults based on tooth wear, tooth eruption and body size (Gier, 1968; Gese et al., 1988; Rongstad et al., 1989). We fitted animals classified as yearlings and older with a radio-collar equipped with a mortality indicator triggered after six h of immobility (Advanced Telemetry Systems, Isanti, Minnesota, USA). We released animals at the site of capture. Capture and handling procedures were approved by the Institutional Animal and Care Use Committees at Utah State University and the National Wildlife Research Center. HABITAT USE
We located individual coyotes and kit foxes 4 times a wk with a portable receiver (Telonics Inc., Mesa, Arizona, USA) and 3-element Yagi antennae. We triangulated ground locations where we had $3 bearings .20u but ,160u for each animal (Gese et al., 1988). We then plotted an animal’s position using the program Locate II (Pacer, Truro, Nova Scotia). We determined the telemetry error to be ,63u with reference transmitters. When possible, we determined an exact location by either homing in on the signal during the day or using a spotlight at night to acquire a visual location; .25% of 3340 locations were exact locations. We conducted aerial telemetry once a month to locate missing animals and obtain locations of animals in inaccessible areas (Mech, 1983). We determined aerial location error to be ,100 m from pilot-blind trials on reference transmitters. We distributed the telemetry sampling effort evenly across four time periods: dawn, day, dusk and night. We selected time intervals to represent behavioral phases (e.g., resting vs. hunting). We defined the crepuscular time periods as 2 h before and after sunset and sunrise. We reduced auto-correlation and maintained independence among locations by not locating an animal during the same or consecutive time periods (Swihart and Slade, 1985a, b; Gese et al., 1990). We imported location coordinates into ArcView 3.2 (Environmental Systems Research Institute, Inc.(ESRI), Redlands, California, USA) and buffered them by 150 m. We employed the use of a buffer, whose length corresponded to the appropriate distance of awareness for the animals being studied, to more accurately represent space use (Bissonette et al., 1994; Ostro et al., 1999). Standard analyses of telemetry data use computer algorithms
194
THE AMERICAN MIDLAND NATURALIST
160(1)
(e.g., Locate II) to provide ‘best guess’ coordinates and error polygons constructed from three bearings or two bearings and a reference error. Researchers typically accept the ‘best guess’ coordinates as the animal’s actual location to apply to a home range estimate or assess landscape use parameters (e.g., habitat type, slope, aspect). This practice fails to recognize the resolution of radio telemetry location accuracy and can lead to misrepresentation of an individual animal’s use patterns by incorporating arbitrary landscape. Individuals do not occupy space or make habitat use decisions based on a single dimension, as represented by a point location. More realistically, they exhibit some level of ‘awareness’ for their surroundings through sight, smell, sound and memory (Griffin, 1992; Jennings, 1998). Approaching the analysis of landscape use by incorporating an animal’s ‘awareness’, shifts emphasis from use of a point location to an area of influence, and preserves a more appropriate resolution of telemetry locations. Animal awareness should be estimated separately for every species and should also account for site-specific landscape characteristics (Elgar, 1989; Frid and Dill, 2002). Based on visual observations (n 5 513) of coyotes and kit foxes on Dugway’s open landscape, we estimated that 150 m was the average distance each species was immediately sensitive to its surroundings (i.e., became aware of an observers presence; Kramer and Bonenfant, 1997; Louis and Le Berre, 2000). We defined this distance as the species ‘awareness’ and was used to convert point locations to a circular area 150 m in radius. We removed locations with an error polygon of .0.25 km2, signifying the relative inaccuracy of a calculated point location, from spatial analysis. We employed ArcView’s Geoprocessing Wizard extension to overlay the buffered locations with a digital 10-m resolution habitat classification layer supplied by the U.S. Department of Defense. We summed the resulting circular polygons, each representing a single buffered location impregnated with habitat data, over the course of the study to create a habitat use profile for each individual. Because kit foxes traveled and hunted alone, and coyotes also traveled alone as indicated by activity patterns and spatial proximity, we used the individual animal as the sample unit for all analyses. We examined seasonality of spatial data for winter (Oct.–Mar.) and summer (Apr.–Sep.). We classified locations as day or night using the current month’s sunset and sunrise times to define the two periods. The time periods and seasons reflected the availability of prey items (invertebrates, reptiles and small mammals), as well as ambient temperature fluctuation effects on movements and diet. We tested for differences in habitat use between the species, time periods and seasons using the multiple response permutation procedure (MRPP; Mielke et al., 2001). The MRPP is a distance-function based, randomization test used for multivariate analyses of grouped data. The procedure plots each animal’s observed habitat use across a multidimensional space (Cade and Richards, 1999). For this study, seven habitat types resulted in the analyses of a seven-dimensional niche space. The MRPP then computes observed intra-group (e.g., species, seasons) distances. We derived statistical inference by comparing the observed intragroup mean to a distribution constructed from the permutation of all possible combinations of intra-group distances. Basing statistical inference on randomization theory, rather than on an unknown population distribution, renders the resulting probability distribution free and prevents the application of inappropriate models. We calculated computations for the MRPP using the Blossom program, version 2001-8d (U.S. Geological Survey, Midcontinent Ecological Science Center, Fort Collins, Colorado, USA). We obtained a digital elevation model (DEM) for the study area in grid format from the Utah State Automated Geographic Reference Center (AGRC, Salt Lake City, Utah, USA).
2008
KOZLOWSKI ET AL.: CANID RESOURCE PARTITIONING
195
We defined ruggedness as the variance in elevation between 30 m grid cells of the DEM. We calculated ruggedness using the FOCALSTD procedure in ArcInfo 8.1 (ESRI, Redlands, California, USA). FOCALSTD uses a 3 3 3 cell, roving window to compute each central cell’s variance in elevation with that of its eight neighboring cells. The output is a digital variance grid representing ruggedness. We then used ArcView 3.2 to combine each study animal’s buffered location with the ruggedness information contained in the digital variance grid. We normalized the results using a log (ruggedness + 0.02) transformation (Zar, 1999). We performed split-plot model, analysis of variance (ANOVA) tests to compare ruggedness of kit fox and coyote locations. We examined the fixed effect results computed by the ANOVA for pairwise interactions using a Tukey-Kramer multiple comparison test. We performed both the ANOVA and Tukey-Kramer tests on the statistical package SAS 8.1 (SAS Institute Inc., Cary, North Carolina, USA). DIET
We collected scats of both species monthly along 114 km of established road transects through all habitat types. We cleared transects of scats at each collection allowing a scat’s age to be determined to the nearest month. We drove the transects in both directions with two observers and a driver. Low levels of fox scat on the roads necessitated additional collecting on foot at den sites. Once collected, scats were labeled, dried outdoors in paper bags for .30 d, transferred to nylon stockings, washed in a washing machine with detergent and again air-dried. We compared bone remains to skeletal reference specimens. We examined hair under a light microscope and compared them to locally collected reference samples. For each scat, we recorded the presence of each food item and percent occurrence (# occurrences of an item/total # of occurrences of all food items) was calculated. We grouped food items taxonomically and by size to facilitate identifying preference. From small to large, we defined the prey/food item categories as anthropogenic, fruits and plants, scorpion, insect, reptile, bird, rodent, kangaroo rat, rabbit, miscellaneous mammal and ungulate. We examined dietary differences between species and seasons using Horn’s similarity index to estimate dietary overlap (Horn, 1966) and the Shannon-Weiner diversity index to estimate breadth of dietary diversity (Shannon and Weaver, 1949). We identified significant differences between diversity using Hutcheson’s t-test (Hutcheson, 1970). We used chi-square analysis and the Wilcoxon paired sample test (Wilcoxon, 1945) to determine differences between observed frequencies of occurrence of food items. The sampling units for the Hutcheson’s t-tests and chi-square analyses were the number of scats examined and number of prey categories respectively. ACTIVITY PATTERNS
We identified animal activity, used to quantify coyote’s and kit fox’s temporal overlap, using signal strength variation (Green and Bear, 1990; Theuerkauf and Jedrzejewski, 2002). During locations, presence of distinct signal attenuation was recorded. We classified locations with indistinct or absent attenuation as non-active. The unusual clarity, and therefore confidence, with which signal attenuation could be determined on Dugway was attributed to highly ionic soils and low-angle, low energy signals resulting from small radio collars and low profile study animals. We recorded all kit foxes seen above ground, at or away from a den site and, therefore, were spatially vulnerable to coyotes, as active. We classified visually located coyotes as non-active if bedded or showed signs of having been recently disturbed by the observer (e.g., stretching, yawning, flushing unusually close to observer). We excluded aerial locations from this analysis. Using the individual animal as the sampling unit, we plotted the proportions of active locations to total locations for each
196
THE AMERICAN MIDLAND NATURALIST
160(1)
hour of the 24-h day. We examined seasonal activity by grouping locations into winter (Oct.Mar.) and summer (Apr.–Sep.). We examined differences between kit fox and coyote activity patterns using the non-parametric Watson’s two-sample test for circular data (Watson, 1962). RESULTS ANIMAL CAPTURES
We captured and monitored 26 coyotes (14 males, 12 females) between Dec. 1999 and Aug. 2001; 16 of these survived to the end of the study. Of the 10 mortalities, four were shot off the study site, two died of starvation or disease, one was killed by a mountain lion, one was killed by conspecifics and two died of unknown causes. Sixteen coyotes (10 males, six females) had sufficient locations for spatial analysis. We captured and radio collared 28 kit foxes (17 males, 11 females) between Dec. 1998 and Aug. 2001. Only 10 foxes (five males, five females) were known to survive to the end of the study. Of the other 18 foxes, seven were depredated, one died of disease, one died of unknown causes and nine were unaccounted for. Of the seven predator caused mortalities, six were caused by coyotes and one was killed by a bobcat (Lynx rufus). Of the six pups followed through dispersal, none survived past 6 mo. Seventeen kit foxes (nine males, eight females) had sufficient locations for spatial analysis. Continuous den monitoring and trapping efforts lead us to believe 90–95% of the foxes in the study area were identified. LANDSCAPE USE
Due to a heterogeneous landscape, and in order to insure the comparison of the most spatially related canids with the highest chance of interaction (Gese et al., 1988; Morey et al., 2007), we grouped individuals of both species into either a ‘highland’ or ‘lowland’ landscape class. Shrub-steppe, grassland and stable dune habitats defined the highland regions of the study area, while the lowlands were composed primarily of greasewood, chenopod and pickleweed habitats. Space use patterns allowed for the further division of kit foxes into four landscape use sub-classes. We divided highland foxes into ‘mountain’ and ‘grassland’ sub-classes, while lowland foxes were separated into ‘city’ and ‘poverty’. As well as focusing the analysis on the individuals with the highest potential for resource overlap, this strategy also examined habitat use at a finer scale than that of the study area, effectively reducing the confounding effects of habitat availability and its influence on the observed landscape use patterns of each species. As a result, differences in habitat use between study animals more closely reflected actual selection rather than differences in available habitat and prevented spurious comparisons of individual animals that did not overlap or occupy similar landscapes. Nine highland foxes and eight lowland foxes were relocated 1992 times. To reduce variance and make comparisons between animals more spatially relevant, we divided the highland foxes into mountain (n 5 7) and grassland (n 5 2) classes and lowland foxes were divided into city (n 5 4) and poverty (n 5 4) classes (Fig. 1). During the day, foxes in the mountains predominantly used shrub-steppe (64% winter, 82% summer) and grassland (20% winter, 15% summer) habitats. At night, mountain fox locations continued to use shrub-steppe (43% winter, 44% summer) and grasslands (45% winter, 43% summer), but in proportions different from their day use (winter: d 5 4.27, P , 0.05; summer: d 5 4.04, P , 0.01). Foxes in the grasslands, representing the second highland landscape class, consistently used grasslands (99%) throughout all combinations of time and season. City foxes, although they consistently used urban (57% day, 54% night) and chenopod (25%
2008
KOZLOWSKI ET AL.: CANID RESOURCE PARTITIONING
197
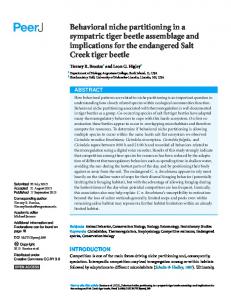
FIG. 1.—Spatial and topographic relationships of coyote and kit fox in different landscape classes on the Dugway Proving Ground, Utah, 1999–2001
day, 21% night) during the summer days and nights (d 5 5.15, P 5 0.5), exhibited significant diurnal/nocturnal shifts in their occupation of urban (82% day, 49% night) and chenopod (6% day, 20% night) habitats during winter (d 5 4.06, P , 0.05). Poverty foxes’ diurnal use of pickleweed (60% winter, 78% summer), urban (17% winter, 3% summer) and chenopod (12% winter, 7% summer) habitats as a whole did not differ significantly from their nocturnal use, although individually, chenopod seemed to gain in nighttime importance during summer (24% winter, 34% summer) (Fig. 2). We detected no significant differences between summer and winter use of habitats by kit foxes (Table 1). Eight highland coyotes and eight lowland coyotes were relocated 2011 times. Highland coyote’s diurnal habitat use consisted primarily of shrub-steppe (28% winter, 34% summer), grasslands (45% winter, 32% summer) and stable dunes (16% winter, 22% summer). However, nocturnal use patterns showed a significant de-emphasis of shrub-steppe (9% winter, 15% summer) in favor of grasslands (67% winter, 63% summer) during both the winter (d 5 5.09, P , 0.001) and summer (d 5 5.12, P , 0.001). Lowland coyotes spent more time during the day in stable dunes (34% winter, 41% summer), greasewood (35% winter, 29% summer) and chenopod (14% winter, 18% summer) than their highland counterparts. Lowland coyotes similarly emphasized stable dunes (33% winter, 33% summer), greasewood (36% winter, 36% summer) and chenopod (11% winter, 18% summer) at night. Like the foxes, intra-specific habitat use by coyotes showed no evidence of changing with the seasons (Table 2). Lowland coyotes differed significantly in habitat use from all diurnal/nocturnal and winter/summer combinations of the foxes in the city and poverty landscapes (Table 3).
198
THE AMERICAN MIDLAND NATURALIST
160(1)
FIG. 2.—Proportional use of habitats by: a) lowland coyotes, b) highland coyotes, c) city kit foxes, d) mountain kit foxes, e) poverty kit foxes, and f) grassland kit foxes across time period and season, Utah, 1999–2001. Habitat types are arranged from highest elevation to lowest elevation, from left to right, with the exception of ‘urban’
Similarly, highland coyote habitat use differed significantly from all diurnal/nocturnal and winter/summer combinations of kit foxes in the highland mountain and grassland classes. The split-plot ANOVA identified landscape class had a significant effect on both highland and lowland animal’s use of landscape ruggedness (Table 4). For highland animals the interaction of time and landscape class was also significant. For lowland animals, additional variation in the ruggedness of relocations was described by the effect of time. Further examination of highland pair-wise interactions identified more rugged terrain use by mountain fox and less rugged terrain use by grassland foxes when compared to sympatric coyotes (Table 5). Similarly, lowland coyotes used significantly rougher terrain than city foxes, but overlapped poverty foxes’ use of terrain (Table 5). The roughest terrain was occupied by mountain foxes followed in descending order by grassland, poverty and city foxes (Fig. 3). Temporal variations in terrain use were apparent, but restricted in both highland and lowland study animal classes. Within the highland class, only the mountain foxes showed a
KOZLOWSKI ET AL.: CANID RESOURCE PARTITIONING
2008
199
TABLE 1.—Multiple response permutation procedure (MRPP) analysis of daily and seasonal differences within the landscape use classes of kit foxes, Dugway Proving Ground, Utah, 1999–2001 Test
Day vs. Night
Class
Season
Obs. d
P-value
Mountain
Winter Summer Winter Summer Winter Summer Winter Summer
4.27 4.04 3.00 2.00 4.06 5.15 0.32 6.97
,0.05 ,0.01 1.00 1.00 ,0.05 0.500 0.599 0.429
Class
Time
Obs. d
P-value
Mountain
Day Night Day Night Day Night Day Night
5.20 5.08 3.00 2.00 4.16 1.72 6.43 7.71
0.847 0.572 1.00 1.00 0.114 0.376 0.857 0.800
Grassland City Poverty Test
Winter vs. Summer
Grassland City Poverty
significant change in location ruggedness between day and night, while in the lowland class it was foxes in the city landscape (Table 5). Both classes used significantly different terrain over the course of a day and exhibited the most extreme range of all the animals studied (Fig. 3). ACTIVITY PATTERNS
We classified 344 (34%) of 1004 winter locations and 403 (40%) of 1007 summer locations for coyotes as active. Kit foxes were active for 272 (36%) of the 759 winter locations and 405 (33%) of the 1233 summer locations. Both winter and summer activity periods for coyotes extended earlier into the evening and later into the morning than foxes (Fig. 4). The nocturnal period necessary to encompass 80% of the active winter kit fox locations defines an area starting at 1900 h and ending at 0500 h, while to encompass the same percentage of active winter coyote locations the area was 1700 h to 0800 h. Similar patterns existed during the summer with 1900–0600 h defining 80% of the active summer locations TABLE 2.—Multiple response permutation procedure (MRPP) analysis of daily and seasonal differences within the landscape use classes of coyotes, Dugway Proving Ground, Utah, 1999–2001 Test
Day vs. Night
Class
Season
Obs. D
P-value
Highland
Winter Summer Winter Summer
5.09 5.12 7.20 7.25
,0.001 ,0.001 0.752 0.865
Day Night Day Night
5.87 6.00 7.23 7.27
0.231 0.402 0.804 0.878
Lowland Winter vs. Summer
Highland Lowland
200
THE AMERICAN MIDLAND NATURALIST
160(1)
TABLE 3.—Multiple response permutation procedure (MRPP) analysis of daily and seasonal differences between coyote and kit fox landscape use classes, Dugway Proving Ground, Utah, 1999–2001 Landscape class
Season
Time
Obs. D
P-value
Fox_Mountain vs. Coy_Highland
Winter
Day Night Day Night Day Night Day Night Day Night Day Night Day Night Day Night
4.43 4.29 3.88 4.80 4.41 4.38 3.61 5.16 5.13 5.59 5.47 6 5.55 5.57 5.18 5.65
,0.001 ,0.002 ,0.01 ,0.001 ,0.05 ,0.05 ,0.05 ,0.05 ,0.01 ,0.01 ,0.01 ,0.05 ,0.01 ,0.01 ,0.01 ,0.01
Summer Fox_Grassland vs. Coy_Highland
Winter Summer
Fox_City vs. Coy_Lowland
Winter Summer
Fox_Poverty vs. Coy_Lowland
Winter Summer
for kit foxes and 1800–0700 hrs defining 80% of the active summer coyote locations. Although kit foxes did not show a significant change in their distribution of activity between winter and summer seasons (U2 5 0.1716, P . 0.05), significant seasonal differences existed between coyotes’ winter and summer activity patterns (U2 5 0.3835, P , 0.002). Interspecific comparisons indicated significant differences between winter kit fox and winter coyote (U2 5 1.3893, P , 0.001) and summer kit fox and summer coyote (U2 5 0.3534, P , 0.002) distributions of active locations. DIET
Over the course of the study, we collected and analyzed 1131 coyote scats and 294 kit fox scats. We examined scats from both canid species for the presence of 38 different prey species and the results combined to create 11 different prey categories. Items included within the anthropogenic food category included Styrofoam, paper and plastic wrapper remains. Fruits and plants ingested included juniper, Russian olive (Elaeagnus angustifolia) TABLE 4.—Results of ANOVA test of fixed effects to determine the influence of landscape use class and time on observed ruggedness of locations for coyotes and kit foxes, Dugway Proving Ground, Utah, 1999–2001 Group
Source
df
F
P
Highland
Landscape Classa Timeb Time 3 Class
2 1 2
81.39 0.32 5.05
,0.0001 0.5804 0.0223
Lowland
Landscape Classc Time Time 3 Class
2 1 2
8.18 6.49 1.62
0.0050 0.0243 0.2348
a b c
Highland coyote, mountain fox, grassland fox Day or night Lowland coyote, city fox, poverty fox
KOZLOWSKI ET AL.: CANID RESOURCE PARTITIONING
2008
201
TABLE 5.—Results of ANOVA differences of least square means test to identify pairwise differences of rugged terrain use of coyotes and kit fox, Dugway Proving Ground, 1999–2001 Effect
Landscape Class
Group
Highland Lowland
Time 3 Class
Highland
Lowland
Interaction
Coyote Coyote Coyote Coyote
3 3 3 3
Fox_Mountain Fox_Grassland Fox_City Fox_Poverty
Coyote: day 3 night Fox_Mountain: day 3 night Fox_Grassland: day 3 night Coyote: day 3 night Fox_City: day 3 night Fox_Poverty: day 3 night
df
T
Adj. P
14 14 14 14
10.85 3.08 3.86 0.14
,0.0001 0.0208 0.0052 0.9898
1 1 1 1 1 1
1.29 9.85 0.17 1.31 7.57 0.22
0.2759 0.0073 0.6884 0.2727 0.0165 0.6480
and various grasses. Scorpions (Centruroides spp.) were found in moderate to low frequencies. Insects included Mormon crickets (Anabrus simplex), Jerusalem crickets (Stenopelmatus fuscus), grasshoppers (Orthoptera spp.), beetles (Tenebrionidae spp.) and various larvae. Gopher snake (Pituophis melanoleucus), sagebrush lizard (Sceloporus graciosus),
FIG. 3.—Landscape ruggedness of coyote and kit fox locations, Dugway Proving Ground, Utah, 1999–2001
202
THE AMERICAN MIDLAND NATURALIST
160(1)
FIG. 4.—Kit fox and coyote activity patterns in: A) winter, and B) summer across hourly proportions of active locations, Dugway Proving Ground, Utah, 1999–2001
side-blotched lizard (Uta stansburiana) and Western whiptail (Cnemidophorus tigris) remains characterized the reptiles. Birds included western meadowlark (Sturnella neglecta) and horned lark (Eremophilia alpestris). Rodents included desert woodrat (Neotoma lepida), western harvest mouse (Reithrodontomys megalotis), deer mouse (Peromyscus maniculatus), pinyon mouse (Peromyscus truei), northern grasshopper mouse (Onychomys leucogaster), meadow vole (Microtus pennsylvanicus), plains pocket gopher (Thomomys bottae), Townsend’s ground squirrel (Spermophilus townsendii), whitetail antelope squirrel (Ammospermophilus leucurus), Ord’s kangaroo rat (Dipodomys ordi) and the chisel-toothed kangaroo rat (Dipodomys microps). Rabbits included mountain cottontail (Sylvilagus nuttalli) and black-
2008
KOZLOWSKI ET AL.: CANID RESOURCE PARTITIONING
203
TABLE 6.—Percent occurrence of food items and dietary diversity indices across season and landscape class for kit foxes and coyotes, Dugway Proving Ground, 1999–2001 Kit fox
Coyote
Highland Winter
n scats Prey Category Anthropomorphic Fruit and Plants Scorpion Insect Reptile Bird Rodent Kangaroo-rat Rabbit Miscellaneous Ungulate
103 0.5 1.0 1.6 9.8 0.5 4.7 25.9 44.1 11.4 0.5 0
Lowland
Summer
Winter
Summer
43
93
55
0 1.5 6.0 22.6 1.0 5.0 18.1 37.2 8.1 0.5 0
2.4 1.2 2.4 11.9 1.2 7.1 33.3 28.6 11.9 0 0
0.6 1.2 7.3 26.8 1.9 7.3 15.9 25.6 12.8 0 0.6
Highland
Lowland
Winter
Summer
Winter
Summer
295
376
145
315
0.2 10.2 0.2 3.8 1.9 2.2 20.2 29.6 24.2 0.7 6.8
0.6 8.2 1.4 27.4 0.8 2.2 13.4 19.7 21.1 0.3 4.9
0.4 8.4 0.4 6.0 1.5 2.7 14.2 24.8 36.4 0.6 4.6
0 4.2 2.2 18.6 3.0 2.7 12.7 18.2 33.3 0.4 4.7
Diversity Index (Shannon-Wiener)
0.66
0.73
0.74
0.79
0.77
0.80
0.76
0.80
tailed jackrabbit (Lepus californicus). Miscellaneous prey included badger (Taxidea taxus), marmot (Marmota flaviventris), porcupine (Erethizon dorsatum) and longtail weasel (Mustela frenata). Two ungulate species, pronghorn (Antilocapra americana) and mule deer (Odocoileus hemionus) were represented in the scats. No scat of either canid species was found to contain kit fox remains, although 22 coyote scats with coyote hair was probably due to grooming. Both kit foxes and coyotes relied on rabbits, kangaroo rats, rodents and insects (Table 6). Both canids used insects, reptiles and scorpions more during the summer than winter (coyote: x2 5 27.37, df 5 5, P , 0.001; kit fox: x2 5 53.01, df 5 5, P , 0.001), and rodents and kangaroo rats more during the winter than summer (coyote: x2 5 32.72, df 5 3, P , 0.001; kit fox: x2 5 39.25, df 5 3, P , 0.001). Horn’s similarity index further confirmed high levels of dietary overlap both within and between canid species, seasons and landscape classes (Table 7). The distribution of food items across categories, as measured by the Shannon-Wiener diversity index (Table 6), was similar between the majority of diet combinations. Differences in dietary diversity occurred between winter and summer diets of lowland coyotes, between winter highland coyotes and kit foxes, and between summer highland coyotes and kit foxes (Table 7). DISCUSSION The ability to differentiate space, time or food resources allowed multiple canid species to remain sympatric (Wooding, 1984; Creel and Creel, 1996; Durant, 1998; Arjo and Pletscher, 1999). Researchers on the Naval Petroleum Reserves in California (NPRC) reported the lack of spatial, temporal or dietary resource partitioning between kit foxes and coyotes as a factor suppressing San Joaquin kit fox populations (White et al., 1994; Ralls and White, 1995; Cypher and Spencer, 1998). Similar research, conducted on the Pin ˜ on Canyon Maneuver Site (PCMS) in Colorado, found low spatial and temporal resource partitioning between sympatric swift fox and coyote populations (Kitchen et al., 1999). Although the PCMS
204
THE AMERICAN MIDLAND NATURALIST
160(1)
TABLE 7.—Intra- and interspecific comparisons of dietary overlap (Horn’s similarity index), item diversity (Hutcheson’s t-test, Ht) and food item proportions (chi-square, x2) of kit fox and coyote diets, Dugway Proving Ground, Utah, 1999–2001 Hutcheson’s Horn’s
t
Intra-specific: Coyote Highland: Winter vs. Summer Lowland: Winter vs. Summer
Species, class, season
df
0.9152 0.9570
1.45 2.17
Intra-specific: Kit Fox Highland: Winter vs. Summer Lowland: Winter vs. Summer
0.9589 0.9385
1.68 1.20
381 153
Inter-specific: Kit Fox vs. Coyote Highland Winter: Kit Fox vs. Coyote Highland Summer: Kit Fox vs. Coyote Lowland Winter: Kit Fox vs. Coyote Lowland Summer: Kit Fox vs. Coyote
0.8829 0.8936 0.8492 0.9121
3.51 2.61 0.43 0.14
Chi-square P
X
2
df
P
776 .0.05 232.48 1522 0.03 150.21
10 10
0.001 0.001
.0.05 .0.05
32.94 31.17
10 10
0.001 0.001
275 0.001 110.58 384 0.01 108.74 106 .0.05 71.65 267 .0.05 76.94
10 10 10 10
0.001 0.001 0.001 0.001
researchers identified coyotes as the highest source of fox mortality (Covell, 1992; Rongstad et al., 1989), dietary partitioning and the use of dens by foxes as refuges was credited for the study area’s relatively stable swift fox population (Kitchen et al., 1999). Analogous to many of the overlapping canid populations in the literature, Dugway Proving Ground’s coyotes and kit foxes also demonstrated significant temporal and dietary overlap as well as high levels of interference competition, with 56% of adult fox mortalities attributed to coyotes. However, in contrast to the intensively studied California and Colorado fox populations, Dugway’s kit fox occupied a diversity of landscapes (Fig. 1). Topographic features of the highland and lowland areas of the study area may provide spatial solutions for kit foxes to coexist with coyotes within Dugway’s niche space. Each landscape class had unique vegetative and topographic characteristics that balanced the minimum food requirements for foxes with protection from coyotes. Mountain kit foxes used the most rugged terrain of any of the canids in the study. Primarily a desert animal, kit foxes do not normally inhabit steep, rocky slopes and are usually limited to areas with high visibility and loose, textured soils (Egoscue, 1962; Zoellick et al., 1989; White et al., 1995). Evidence from Colorado swift foxes and California kit foxes suggests that topographically complex areas are avoided due to high levels of interference competition by bobcats and coyotes (Warrick and Cypher, 1998; Kitchen et al., 1999; Schauster et al., 2002). Mountain kit foxes on Dugway, however, inhabited the rocky islands rising abruptly several hundred meters from the desert floor. The steepness of the land offered plentiful den sites and temporary refuges in the form of talus slopes, rock fissures and steep washes. Mountain foxes preferred hunting in less rugged terrain and descended to the intermediate topography and habitats more characteristic of those used by highland coyotes (Fig. 2). Mountain foxes avoided overlapping the habitats used by even the most sympatric coyote during the day and night (Table 3). Nightly movements into less rugged, grasslands by mountain foxes were probably in reaction to prey availability. Examination of the distribution of the dominant prey species in highland kit foxes’ diet support this hypothesis. Grassland foxes occupied the least rugged terrain of the highland landscapes and overlapped the most with highland coyote habitats, especially during the day. The
2008
KOZLOWSKI ET AL.: CANID RESOURCE PARTITIONING
205
composition of habitats used by grassland foxes most closely approximated the habitats reported for Colorado’s PCMS and California’s NPRC studies (Rongstad et al., 1989; Warrick and Cypher, 1998; Kitchen et al., 1999). Areas chosen to hunt and den in by these foxes were gently rolling foothills or flats, with deep soils and infestations of invasive annuals. Of the lowland canids, poverty foxes were found in the harshest terrain, making a living primarily on the salt flat playa. To avoid the water table, the majority of these foxes’ dens were dug into the sand dunes and hummocks. These foxes were far ranging, often frequenting distant hills, and used greater vegetation extremes than other canids in this study or the literature, including pickleweed, bare mud flats and stable dunes (Fig. 2). These foxes subsisted in areas that coyotes did not inhabit due to food or water limitations. City foxes lived in the flattest terrain of any of the canids (Fig. 3). However, what the landscape lacked in natural shelter was made up by anthropogenic refuges. Old vehicles, pipes, fences, buildings, construction debris and human activity typified the city fox locations. City foxes traveled from flat, protected, urban areas during the day to rugged, structurally complex foraging sites in greasewood and stable dune habitats at night (Figs. 2c, 3). Although these habitats supported higher prey densities, they also created poor visibility in the areas most frequented by lowland coyotes, hence lowland kit foxes seemed to rely on the proximity of cover afforded by the urban areas. A pair of kit foxes inhabited each of Dugway’s three urban areas. However, because urban foxes were largely dependent on debris and structures for refuge, immigration of new foxes and emigration of dispersing foxes was difficult. The isolation and small size of these individual populations, therefore, made them very susceptible to local extirpation. One urban pair, in fact, disappeared during the first year and was not replaced over the course of the study. Interspecific and seasonal comparisons of diet demonstrated high food item overlap and more importantly, similarity of food categories as tested by Horn’s similarity and ShannonWeiner diversity indices, respectively. Similarity indices were high compared to those found in other studies (White et al., 1995). Within highland landscapes, coyotes in winter relied more heavily on rabbits, ungulates and Russian olive fruits, contrasting with kit fox preference for kangaroo rats and invertebrates. Interspecific dietary differences existed in the highland canids during the summer, marked by kit foxes’ higher use of kangaroo rats and coyotes’ use of rabbits and fruits. Lowland coyotes reflected smaller seasonal dietary shifts from fruits and small mammals in the winter to invertebrates in the summer. High temporal and dietary overlap, fox movement from extreme to moderate topography during foraging and avoidance by foxes of those habitats preferred by coyotes (except in the abundance of protective cover) suggest the effects of predation pressure exerted on Dugway kit foxes by coyotes. As the dominant predator on the landscape, both highland and lowland coyotes used more moderate topography and habitats with little variation between daily or seasonal use patterns (Figs. 3, 4). The complex interaction between the kit foxes’ roles as a small predator and prey for a larger canid may explain its patchy distribution at Dugway. In their predatory role, kit foxes, in the absence of other forces, should distribute themselves on the landscape in response to prey populations. As potential coyote prey, kit foxes must select for refuges and hunting cover. Occupation of territories that provide simultaneous access to food and refuges may not be possible. As a result, foraging success must be sacrificed for cover, or safety must be compromised to forage in more profitable, but risky, habitats. At night, more emphasis is placed on obtaining nutrients, while during the day emphasis is focused more on vigilance and availability of cover. Kit fox populations were isolated in areas that appeared natural for
206
THE AMERICAN MIDLAND NATURALIST
160(1)
canid distribution in a harsh desert landscape. However, the same unique mechanisms that affected the ‘fitting’ of foxes into a landscape dominated by coyotes, also limited the possible distribution of kit foxes. Given that our research accounted for 90–95% of the kit foxes using the study area, all available space may be already occupied. Dispersal mortality approaching 100%, failed dispersals up to 35 km and the presence of social groups (i.e., trios of adults) suggest that the landscape is saturated. Unfortunately, in the presence of interspecific sympatry, the landscape may be fragmented into pockets of foxes not easily recolonized in the event of local extirpations. This study, and many other conservation programs dealing with sensitive, threatened or endangered organisms, focus attention on the distribution, behaviors and diets of individuals in scattered remnant populations. By definition, these individuals represent only a small and often biased proportion of the metapopulation’s original characters. Without knowledge of historical conditions, research conducted on post-perturbation responses may not represent native, evolved conditions. At Dugway, expansion of year round water sources, free-range domestic animal operations and reduced predator control programs over the last 40 y have led to increases in coyote numbers in the most arid regions of Utah’s West Desert (Arjo et al., 2007). Current data collected on landscape selection by Dugway’s kit fox will undoubtedly reflect these changes in land use (Thompson and Gese, 2007). Future research should focus on reconstructing historical kit fox distributions with the recognition that accurate information on optimal landscape conditions is paramount to making sound management decisions and conservation plans for this small native carnivore. Acknowledgments.—Funding and logistical support provided by the U.S. Army-Dugway Proving Ground, Directorate of Environmental Programs, Dugway, Utah, the U.S. Department of Agriculture, Wildlife Services, National Wildlife Research Center, Logan Field Station at Utah State University and AGEISS Environmental, Inc., Denver, Colorado. We thank L. Blake, M. Criffield, E. Groth, T. Kozlowski, B. Louie, S. Lupis, D. Meier, D. Mummert, M. Panasci and C. Winchester for field assistance. We thank Hawkins and Powers Aviation, USDA Wildlife Services pilots and G. Gantz for aerial capture and telemetry support; Dugway Environmental personnel J. Martin, S. Plunkett and J. Harn for consultation and advice; P. Terletzky for GIS support; and B. Sacks, R. Schmidt and M. Wolfe for review of the manuscript.
LITERATURE CITED AGEISS ENVIRONMENTAL (AGEISS). 1998. Natural Resources at U.S. Army Dugway Proving Ground 1952– 1998: Wildlife and habitat descriptions, historic and recent study summaries, conclusions, and future management recommendations. Submitted to the Directorate of Environmental Programs, U.S. Army Dugway Proving Ground, Utah. ———. 2001. Final report for the carnivore ecology study at Dugway Proving Ground, Utah. Submitted to the Directorate of Environmental Programs, U.S. Army Dugway Proving Ground, Utah. ARJO, W. M. AND D. H. PLETSCHER. 1999. Behavioral responses of coyotes to wolf recolonization in northwestern Montana. Can. J. Zool., 77:1919–1927. ———, E. M. GESE, T. J. BENNETT AND A. J. KOZLOWSKI. 2007. Changes in kit fox-coyote-prey relationships in the Great Basin Desert, Utah. West. N. Am. Nat., 67:389–401. BARRETT, M. W., J. W. NOLAN AND L. D. ROY. 1982. Evaluation of a hand-held net-gun to capture large animals. Wildl. Soc. Bull., 10:108–114. BISSONETTE, J. A., S. S. SHERBURNE AND D. R. RAMSEY. 1994. Analyzing telemetry data with a GIS-based vector structure. Int. J. Geographic Information Systems, 8:533–543. CADE, B. S. AND J. D. RICHARDS. 1999. User manual for Blossom statistical software. U.S. Geological Survey, Fort Collins, Colorado. COVELL, D. F. 1992. Ecology of swift fox (Vulpes velox) in south-east Colorado. M.S. Thesis. University of Wisconsin, Madison.
2008
KOZLOWSKI ET AL.: CANID RESOURCE PARTITIONING
207
CREEL, S. AND N. M. CREEL. 1996. Limitation of African wild dogs by competition with larger carnivores. Conserv. Biol., 10:526–538. CYPHER, B. L. AND K. A. SPENCER. 1998. Competitive interactions between coyotes and San Joaquin kit foxes. J. Mammal., 79:204–214. ———, ——— AND J. H. SCRIVNER. 1994. Food item use by coyotes at the Naval Petroleum Reserves in California. Southwest. Nat., 39:91–95. DEKKER, D. 1989. Population fluctuations and spatial relationships among wolves, Canis lupus, coyotes, Canis latrans, and red foxes, Vulpes vulpes, in Jasper National Park, Alberta. Can. Field Nat., 103:261–264. DIAMOND, J. M. 1978. Niche shifts and rediscovery of interspecific competition. Am. Sci., 66:322–331. DISNEY, M. AND L. K. SPIEGEL. 1992. Sources and rates of San Joaquin kit fox mortality in western Kern County, California. Trans. West. Sec. Wildl. Soc., 28:73–82. DURANT, S. M. 1998. Competition refuges and coexistence: an example from Serengeti carnivores. J. Anim. Ecol., 67:370–386. EGOSCUE, H. J. 1962. Ecology and life history of the kit fox in Tooele County, Utah. Ecology, 43:481–497. ———. 1975. Population dynamics of the kit fox in western Utah. Bull. South. Calif. Acad. Sci., 74:122–127. ELGAR, M. A. 1989. Predator vigilance and group size in mammals and birds: a critical review of the empirical evidence. Biol. Rev. Cambridge Philosophical Soc., 64:3–33. FRID, A. AND L. M. DILL. 2002. Human-caused disturbance stimuli as a form of predation risk. Conserv. Ecol., 6(1) (URL:http://www.ecologyandsociety.org/vol6/iss1/art11/manuscript.html). GAUSE, G. F. 1934. The struggle for existence. Williams and Wilkins, Baltimore, Maryland. (reprinted 1964 by Hafner, New York). GESE, E. M., D. E. ANDERSEN AND O. J. RONGSTAD. 1990. Determining home-range size of resident coyotes from point and sequential locations. J. Wildl. Manage., 54:501–506. ———, O. J. RONGSTAD AND W. R. MYTTON. 1987. Manual and net-gun capture of coyotes from helicopters. Wildl. Soc. Bull., 15:444–445. ———, ——— AND W. R. MYTTON. 1988. Home-range and habitat use of coyotes in southeastern Colorado. J. Wildl. Manage., 52:640–646. GIER, H. T. 1968. Coyotes in Kansas (revised). Kansas State College Agric. Exp. Stn. Bull., 393:1–118. GREEN, R. A. AND G. D. BEAR. 1990. Seasonal cycles and daily activity patterns of Rocky Mountain elk. J. Wildl. Manage., 54:272–279. GRIFFIN, D. R. 1992. Animal minds. University of Chicago Press, Chicago, Illinois. HARRISON, D. J., J. A. BISSONETTE AND J. A. SHERBURNE. 1989. Spatial relationships between coyotes and red foxes in eastern Maine. J. Wildl. Manage., 53:181–185. HORN, H. S. 1966. Measurement of ‘‘overlap’’ in comparative ecological studies. Am. Nat., 100:419–424. HUTCHESON, K. 1970. A test for comparing diversities based on the Shannon formula. J. Theoretical Biol., 29:151–154. JENNINGS, R. C. 1998. A philosophical consideration of awareness. Appl. Animal Behav. Sci., 57:201–211. JOHNSON, W. E., T. K. FULLER AND W. L. FRANKLIN. 1996. Sympatry in canids: a review and assessment, p. 189–218. In: J. L. Gittleman (ed.). Carnivore behavior, ecology and evolution (Vol. 2). Comstock Publishing Associates, Ithaca, New York. KITCHEN, A. M., E. M. GESE AND E. R. SCHAUSTER. 1999. Resource partitioning between coyotes and swift foxes: space, time, and diet. Can. J. Zool., 77:1645–1656. KOZLOWSKI, A. J., T. J. BENNETT, E. M. GESE AND W. M. ARJO. 2003. Live capture of denning mammals using an improved box-trap enclosure: kit foxes as a test case. Wildl. Soc. Bull., 31:630–633. KRAMER, D. L. AND M. BONENFANT. 1997. Direction of predator approach and the decision to flee to a refuge. Anim. Behav., 54:289–295. LOTKA, A. J. 1932. The growth of mixed populations: two species competing for a common food supply. J. Washington Acad. Sci., 22:461–469. LOUIS, S. AND M. LE BERRE. 2000. Adjustment of distance of flight from humans in Marmota marmota. Can. J. Zool., 78:556–563. MECH, L. D. 1983. Handbook of animal radiotracking. University of Minnesota Press, Minneapolis.
208
THE AMERICAN MIDLAND NATURALIST
160(1)
MIELKE, P. W., K. J. BERRY AND H. K. IYER. 2001. Permutation methods in statistics: a distance-function approach. Springer-Verlag, New York. MOREY, P. S., E. M. GESE AND S. GEHRT. 2007. Spatial and temporal variation in the diet of coyotes in the Chicago metropolitan area. Am. Midl. Nat., 158:147–161. OSTRO, L. E. T., T. P. YOUNG, S. C. YOUNG AND F. W. KOONTZ. 1999. A geographic information system method for estimating home range size. J. Wildl. Manage., 63:748–755. RALLS, K. AND P. J. WHITE. 1995. Predation on San Joaquin kit foxes by larger canids. J. Mammal., 76:723–729. RONGSTAD, O. J., T. R. LAURION AND D. E. ANDERSEN. 1989. Ecology of the swift fox on the Pin ˜ on Canyon Maneuver Site, Colorado. Final Report to Directorate of Eng. and Housing, Fort Carson, Colorado. ROSENZWEIG, M. L. 1966. Community structure in sympatric carnivora. J. Mammal., 47:602–612. SARGEANT, A. B., S. H. ALLEN AND J. O. HASTINGS. 1987. Spatial relations between sympatric coyotes and red foxes in North Dakota. J. Wildl. Manage., 51:285–293. SCHAUSTER, E. R., E. M. GESE AND A. M. KITCHEN. 2002. Population ecology of swift foxes (Vulpes velox) in southeastern Colorado. Can. J. Zool., 80:307–319. SCHMIDT, R. H. 1991. Gray wolves in California: their presence and absence. Calif. Fish Game, 77:79–85. SCHOENER, T. W. 1974. Resource partitioning in ecological communities. Science, 185:27–38. SHANNON, C. E. AND W. WEAVER. 1949. The mathematical theory of communication. University of Illinois Press, Urbana. SHIPPEE, E. A. AND W. P. JOLLIE. 1953. Report of predator control operations. Ecology of the Great Salt Lake Desert, semi-annual report. University of Utah, Salt Lake City. SWIHART, R. K. AND N. A. SLADE. 1985a. Testing for independence of observations in animal movements. Ecology, 66:1176–1184. ——— AND ———. 1985b. Influence of sampling interval on estimates of home-range size. J. Wildl. Manage., 49:1019–1025. THEUERKAUF, J. AND W. JEDRZEJEWSKI. 2002. Accuracy of radiotelemetry to estimate wolf activity and locations. J. Wildl. Manage., 66:859–864. THOMPSON, C. M. AND E. M. GESE. 2007. Food webs and intraguild predation: community interactions of a native mesocarnivore. Ecology, 88:334–346. VOIGT, D. R. AND B. D. EARLE. 1983. Avoidance of coyotes by red fox families. J. Wildl. Manage., 47:852–857. VOLTERRA, V. 1926. Fluctuations in the abundance of a species considered mathematically. Nature, 118:196–218. WARRICK, G. D. AND B. L. CYPHER. 1998. Factors affecting the spatial distribution of San Joaquin kit foxes. J. Wildl. Manage., 62:707–717. WATSON, G. S. 1962. Goodness of fit tests on a circle. II. Biometrika, 49:57–63. WHITE, P. J. AND R. A. GARROTT. 1999. Population dynamics of kit foxes. Can. J. Zool., 77:486–493. ———, K. RALLS AND R. A. GARROTT. 1994. Coyote–kit fox interactions as revealed by telemetry. Can. J. Zool., 72:1831–1836. ———, ——— AND C. A. VANDERBILT. 1995. Overlap in habitat and food use between coyotes and San Joaquin kit foxes. Southwest. Nat., 40:342–349. WILCOXON, F. 1945. Individual comparisons by ranking methods. Biometrics Bull., 1:80–83. WOODING, J. B. 1984. Coyote food habits and the spatial relationship of coyotes and foxes in Mississippi and Alabama. M.S. Thesis. Mississippi State University, Starkville. ZAR, J. H. 1999. Biostatistical analysis (fourth ed.). Prentice Hall, Upper Saddle River, New Jersey. ZOELLICK, B. W., N. S. SMITH AND R. S. HENRY. 1989. Habitat use and movements of desert kit foxes in western Arizona. J. Wildl. Manage., 53:955–961. SUBMITTED 11 APRIL 2007
ACCEPTED 6 JULY 2007