Aperture corrections to total count rates were computed using Tiny Tim (Krist &. Hook 2001) model PSFs, generated for each camera and filter combination.
2002 HST Calibration Workshop Space Telescope Science Institute, 2002 S. Arribas, A. Koekemoer, and B. Whitmore, eds.
NICMOS Photometric Calibration Mark Dickinson, Megan Sosey Space Telescope Science Institute, 3700 San Martin Drive, Baltimore, MD 21218 Marcia Rieke Steward Observatory, Tucson, AZ Ralph Bohlin, Daniela Calzetti Space Telescope Science Institute, 3700 San Martin Drive, Baltimore, MD 21218 Abstract. We review procedures and measurements used to calibrate the photometric zeropoints of the HST Near Infrared Camera and Multiobject Spectrograph (NICMOS). New spectrophotometric models of solar analog and white dwarf standard stars have been calibrated and tested against ground-based photometry, as well as against one another using NICMOS observations through many filters. These are then used to derive the bandpass-averaged flux densities of these stars through the NICMOS filters. We describe the characteristics of the on-orbit standard star observations made in Cycle 7, and the procedures used to correct finite aperture measurements to total count rates, and finally to derive the NICMOS zeropoints. We conclude with preliminary measurements of the increase in delivered quantum efficiency (DQE) at the warmer operating temperatures for Cycle 11.
1.
Introduction
The photometric calibration of NICMOS is challenging for several reasons. During the first lifetime of NICMOS, in Cycles 7 and 7N, our knowledge of the camera, detectors, and of the means to process and calibrate the data evolved substantially. This affected the quality of early NICMOS photometric calibrations. There are still limits to the quality and reproducibility of NICMOS photometry due to certain instrumental effects such as intrapixel sensitivity, as discussed below. Second, flux calibration in the near-infrared is challenging in general, due to the lack of absolutely calibrated spectrophotometry for primary standard stars. Moreover, ground-based calibrations are restricted to measurements in the J, H and K atmospheric windows. NICMOS filters have no such limitation, and indeed do not correspond to standard, ground-based bandpasses, adding further complication to the process of photometric calibration. Here we review the procedures used to calibrate NICMOS photometry in Cycle 7, when the instrument was operating at T ≈ 61.5 K. In era of the NICMOS Cooling System (NCS), the instrument is significantly warmer, T = 77.1 K. The detector DQE has changed (increased) substantially, and the photometric calibration constants have changed as well. At the time of this writing, the recalibration of NICMOS photometry for Cycle 11 is underway, and we present only very preliminary results. 232
NICMOS Photometric Calibration 2.
233
NICMOS Standard Stars
In order to calibrate NICMOS photometry, we must observe standard stars for which we believe we understand the flux distribution with wavelength. No direct spectrophotometric observations of standard stars with continuous wavelength coverage are available over the near-infrared wavelengths covered by NICMOS. Instead, we choose stars for which we believe we understand the expected spectrophotometry, and then check and calibrate this with ground-based broad-band photometry. Two types of stars have been used: solar analogs, and hydrogen white dwarfs. The near-IR spectral energy distribution of the Sun is known to reasonably good accuracy (Colina, Bohlin & Castelli 1996), and for a good solar analog we may scale the solar spectrum to match the JHK ground-based photometry of the standard star and adopt it as our model. Hydrogen white dwarf stars have comparatively simple atmospheres which have been accurately modeled, and are commonly used for HST calibration at UV and optical wavelengths. These models have been extended to infrared wavelengths, and then as with the solar analogs, they can be scaled to match ground-based JHK photometry of a particular standard star. The NICMOS photometric calibration programs in Cycle 7 observed several different standard stars. The solar analog P330E and the white dwarf G191B2B were the primary stars, observed through all filters in all cameras. P330E was also the main target for the NICMOS photometric monitoring program, and thus has many repeated observations through a limited set of filters over the instrument lifetime. Two other “ordinary” standards were observed through a limited subset of NICMOS filters: the solar analog P177D, and the white dwarf GD153. Finally, three red stars, BRI0021, CSKD−12, and OPH−S1, were observed to assess filter red leaks and color transformations. We will not discuss those red stars further at this time. Ground-based JHK photometry of the solar analogs and the white dwarf G191B2B was calibrated by Persson et al. (1998, and priv. comm.), primarily from the Las Campanas Observatory. We will refer to those observations as photometry on the “LCO system,” which was nominally calibrated to the “CIT system” of Elias et al. (1982). The other white dwarfs are UKIRT faint standard stars (Hawarden et al. 2001), and we have derived empirical color transformations to place those observations onto the LCO system. 2.1.
Absolute Flux Calibration for the LCO System
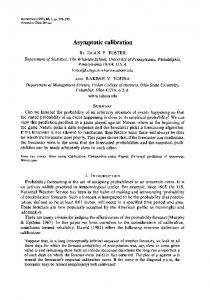
Campins, Rieke & Lebofsky (1985) derived an absolute flux calibration for the Arizona infrared photometric system using the solar analog method.1 Their Table IV summarizes their derived absolute flux measurements for α Lyr at J and K from Blackwell et al. (1983), who compared stellar photometry to an absolutely calibrated terrestrial source, and at J, H and K from the Campins et al. solar analog method. They adopt an average value for each bandpass, which we use as our assumed flux calibration for the Arizona system. The effective wavelengths and bandwidths of the Arizona photometric passbands are not identical to those of the LCO filters (see Figure 1). Therefore we must correct the Campins et al. flux zeropoints measurements to the LCO bandpass system. To do this, we have used a Kurucz model atmosphere for α Lyr. We have not assumed that the absolute flux of this model is correct, nor even that its shape accurately represents that of Vega over a long wavelength baseline, but have only used it to transfer the empirical flux calibration from Campins et al. to the LCO bandpasses: �fν (CRL)� × 1
�fν (model)�LCO = �fν (LCO, transferred)�, �fν (model)�Az
In the Arizona system, α Lyr has J = H = K = 0.02, whereas in the CIT system it is defined to have mag = 0.
234
Dickinson, et al.
Figure 1. Comparison of the J, H, K, and Ks bandpasses used in the standard star photometry of Persson et al. (1998) (the “LCO system”) with tapered boxcars representing the bandpasses of the Arizona system, for which Campins et al. (1985) have presented absolute flux calibration. The effects of atmospheric absorption on the net bandpass functions are also illustrated. where �fν (CRL)� is the Campins et al. flux density measurement, and �fν (model)�X indicates the bandpass-averaged flux density computed using the α Lyr model and filter system X. In this way, we assume that (1) our bandpass functions for the two systems are accurately determined, and (2) the Vega model is relatively accurate over the wavelength interval between the two “versions” of a given bandpass. Given the dimensionless system throughput (filter transmission times DQE) for the LCO filter system, it is straightforward to integrate the spectrophotometric models through the LCO bandpasses to derive bandpass-averaged flux densities. Compare these to the ground–based photometry, however, requires an absolute flux calibration for the LCO photometric system. The LCO system is calibrated to the CIT standards of Elias et al. (1982). The CIT system is nominally calibrated so that α Lyrae has zero magnitude at JHK. We assume here that this is correct, and thus require an absolute flux calibration for α Lyrae through the LCO filters. 3.
Spectrophotometric Data and Models
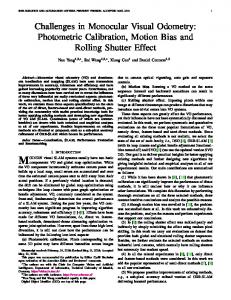
In this way, we have JHK photometry in the LCO system for the four basic NICMOS standards, as well as Ks photometry for the solar analogs. Bohlin, Calzetti & Dickinson (2001) obtained high-quality STIS spectrophotometry in the wavelength range 1150–10200 ˚ A for HST standard stars including P330E and G191B2B. They have made a detailed comparison to stellar atmosphere models in terms of effective temperature, reddening, etc. They use the solar spectrum and white dwarf atmosphere models to extend the spectrophotometry to near-infrared wavelengths. We integrated the spectrophotometric models through the LCO infrared bandpasses to generate synthetic photometry. Figure 2 shows the relative magnitude differences between these models and the observed JHK and, for some objects, Ks , photometry. (The points for
NICMOS Photometric Calibration
235
Figure 2. Magnitude differences between ground-based photometry of NICMOS standard stars and synthetic photometry derived by integrating the model spectra of Bohlin et al. (2001) through the nominal NICMOS bandpasses. The panel at upper left shows the result of integrating the Vega model atmosphere retrieved from CDBS (Calibration Database and Operations) at STScI, compared to an assumed m = 0. “Vega” compare the CDBS model Vega spectrum to the definition m = 0. The agreement is not particularly good, suggesting that the absolute flux calibration of the Vega model in the near-infrared is not particularly accurate.) For most of the NICMOS standards, the agreement at J and K is well within the uncertainties (taken as the quadrature sum of the ground-based standard star photometry and the quoted systematic uncertainty of the Campins et al. JHK flux zeropoints). At H-band, all of the stars fall systematically below zero offset, although in general by something only slightly larger than the uncertainty in the Campins et al. calibration. Since this is seen for both the solar analog and white dwarf model spectra, and for stars with both LCO and UKIRT photometry, we are inclined to believe that the error is mainly in the Campins et al. flux calibration for the H-band, which also required the largest color correction between the Arizona and LCO/CIT systems. We therefore adopt the Bohlin et al. model spectra for NICMOS flux calibration. 4.
NICMOS Cycle 7 Standard Star Observations
The NICMOS standards P330E and G191B2B were observed in various Cycle 7 calibration programs. For some filters there were a large number of independent observations, while for others there were only a few (as few as three) exposures taken during Cycle 7. The data were processed using the most up-to-date calibration reference files (including temperaturedependent dark frames) and pipeline software, together with some post-processing to remove the NICMOS “pedestal” offset and residual bias “shading.” Photometry for all stars was
236
Dickinson, et al.
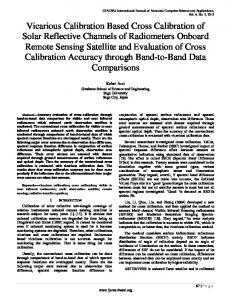
Figure 3. Examples of NICMOS Cycle 7 on-orbit measurements of the count rate from the standard star P330E, in two filters from NICMOS camera 1. F110W (left) was observed many times throughout Cycle 7 as part of the photometric monitoring program. Other filters, such as F166N (right) were observed only once, with three dither positions.
measured in a set of standard apertures, with diameters 1�� , 1�� , and 2�� for cameras 1, 2 and 3, respectively. Examples of the photometry for two filters in camera 1, showing cases with many and few individual exposures, are shown in Figure 3. Occasional outlier points were rejected—these generally occurred when the star fell onto some bad pixels, “grot,” or the unstable central column or row of the detector. Unfortunately, when only 3 exposures were obtained, this sometimes led to a “2-out-of-3” vote on the mean count rate. The photometric scatter is acceptably small for most filters in cameras 1 and 2, although for some of the narrow band filters the signal-to-noise ratio of the individual exposures was disappointingly low. For camera 3, the scatter was appreciably larger, especially at short wavelengths. This is due to the effects of intrapixel sensitivity—the NICMOS detector responsivity varies within the area of a pixel, and the highly undersampled PSF of the short wavelength NIC3 observations results in significant count rate variations for a point source depending on where it was centered within the pixel. This can be seen in the left panel of Figure 4, which shows NIC3 photometry for F110W. At longer wavelengths, the diffraction limit broadens the PSF and the effects of undersampling and intrapixel sensitivity variations are substantially smaller (right panel of Figure 4). The RMS of the count rate measurements (after outlier rejection) in camera 3 is plotted versus wavelength in Figure√5. For filters with a large number N of exposures, this RMS averages down by roughly N , providing acceptable mean count rates. However, some NIC3 filters have only a few observations, leading to large uncertainties in the final calibrations. Aperture corrections to total count rates were computed using Tiny Tim (Krist & Hook 2001) model PSFs, generated for each camera and filter combination. These were “photometered” using the same aperture sizes and background annuli to account for PSF spill-over into the regions used for background subtraction. The adopted aperture corrections are shown in Figure 6, and depend strongly on wavelength as the diffraction limit varies. Early Cycle 7 photometric calibration adopted overly simplistic, constant aperture corrections for all filters, leading to significant errors in the derived zeropoints.
NICMOS Photometric Calibration
Figure 4. More NICMOS Cycle 7 standard star count rate measurements, this time for camera 3. The effects of intrapixel sensitivity variations introduce a large scatter in the measured count rates for undersampled point spread functions, such as the F110W data shown at right. This is reduced at longer wavelengths, where the broader diffraction limit reduces the impact of undersampling.
Figure 5. The RMS of individual standard star measurements for NICMOS camera 3 filters, plotted as a function of wavelength. The reduced scatter at longer wavelengths is readily apparent. (Circles: P330E; Squares: G191B2B)
237
238
Dickinson, et al.
Figure 6. Aperture corrections from measured to total count rates, derived from Tiny Tim PSF models, plotted against filter effective wavelength. The horizontal lines show the constant aperture corrections that were adopted for preliminary NICMOS photometric calibrations early in Cycle 7.
5.
Cycle 7 Zeropoints
NICMOS photometric calibration is encoded in the image headers (and PHOTTAB reference files) with the keywords PHOTFNU and PHOTFLAM, representing the bandpassaveraged flux densities (in fν and fλ , respectively) corresponding to a count rate of 1 ADU/ second. These are computed by integrating the standard star spectrophotometric models through the NICMOS bandpass functions (including all optical and detector throughput elements), and dividing by the measured, aperture-corrected mean standard star count rates. With earlier calibrations, there was a significant discrepancy between zeropoint results for the solar analog P330E and the white dwarf G191B2B. With the new spectrophotometric models, the agreement is generally very good (see Figure 7)—within the measurement errors for many filters, generally < 3%, and rarely > 5%. The agreement is also excellent for the ground-based JHK photometry, also shown on Figure 7; here, any uncertainties in the Campins et al. absolute flux calibrations divide out, showing that the two stars genuinely agree with one another to good precision. The agreement is best when we use recent non-LTE model atmospheres with metals to represent the white dwarf (Hubeny, private communication), rather than earlier, pure hydrogen, LTE models, and we have therefore adopted these for the NICMOS calibrations. The final NICMOS photometric calibration constants were taken to be the unweighted mean of values derived for P330E and G191B2B, in order to average over the systematic uncertainties of the spectrophotometric models for these two stars. The derived Cycle 7 calibration constants are given in the NICMOS Data Handbook.
NICMOS Photometric Calibration
239
Figure 7. Ratio of photometric calibration constants (PHOTFNU) derived for two different standard stars: the solar analog P330E, and the white dwarf G191B2B. The calibrations agree within 3% for most NICMOS filters and well within the errors for the ground-based photometry, giving confidence that the spectrophotometric models of these two very different stars are accurate.
6.
Cycle 11 Recalibration
The NICMOS operating temperature under control of the NCS is substantially warmer than it was in Cycle 7, necessitating a complete recalibration of the photometric zeropoints for Cycle 11. P330E and G191B2B have been reobserved, and care was taken to increase the number of dither positions, especially for camera 3, where intrapixel sensitivity variations are most important. As of this writing, a preliminary analysis of the standard star data has been carried out by Marcia Rieke of the NICMOS IDT. Early results, showing the ratio of total throughput for Cycle 11 compared to Cycle 7, are shown in Figure 8. As anticipated, the detector DQE is substantially higher at the warmer operating temperature, particularly at shorter wavelengths; the gain is ∼ 60% for F110W, ∼ 35% for F160W, and ∼ 20% for F222M. This increase in DQE results in improved signal-to-noise ratios for most observations, more than offsetting the increased noise from dark current. Final analysis of the new NICMOS zeropoints has awaited the recalibration of other aspects of NICMOS instrument and detector performance, particularly flat fields, darks, and nonlinearity corrections. When these are complete (and as of this writing this is nearly the case), the standard star observations will be reprocessed and reanalyzed, and final photometric keywords will be derived and placed into the PHOTTAB table used by the OPUS data processing pipeline. Until that time, NICMOS data retrieved from the STScI archive will have incorrect header information for PHOTFNU and PHOTFLAM; observers should watch the STScI NICMOS web pages and the Space Telescope Analysis Newsletter for updates as they become available.
Dickinson, et al.
240
Figure 8. Preliminary comparison of NICMOS sensitivity in Cycle 11 to that from Cycle 7, based on an early analysis of Cycle 11 photometric calibration data for P330E, carried out by Marcia Rieke. References Blackwell, D. M., Leggett, S. K., Petford, A. D., Mountain, C. M., & Selby, M. J. 1983, MNRAS, 205, 897 Bohlin, R. C., Dickinson, M., & Calzetti, D. 2001, AJ, 122, 2118 Campins, H., Rieke, G. H., & Lebofsky, M. J. 1985, AJ, 90, 896 Colina, L., Bohlin, R. C., & Castelli, F. 1996, AJ, 112, 307 Elias, J. H., Frogel, J. A., Matthews, K., & Neugebauer, G. 1982, AJ, 87, 1029 Hawarden, T. G., Leggett, S. K., Letawsky, M. B., Ballantyne, D. R., & Casali, M. M. 2001, MNRAS, 325, 563 Krist, J. & Hook, R., 2001, The Tiny Tim User’s Guide (Baltimore: STScI) Persson, S. E., Murphy, D. C., Krzeminski, W., Roth, M., & Rieke, M. 1998, AJ, 116, 2475