NIH Public Access Author Manuscript J Cogn Neurosci. Author manuscript; available in PMC 2011 May 11.
NIH-PA Author Manuscript
Published in final edited form as: J Cogn Neurosci. 2009 April ; 21(4): 669–683. doi:10.1162/jocn.2009.21037.
Intermodal auditory, visual, and tactile attention modulates early stages of neural processing Christina M. Karns1 and Robert T. Knight1,2 1Helen Wills Neuroscience Institute, University of California Berkeley 2Department
of Psychology, University of California Berkeley
Abstract
NIH-PA Author Manuscript
We used event-related potentials (ERPs) and gamma band oscillatory responses (GBRs) to examine whether intermodal attention operates early in the auditory, visual, and tactile modalities. To control for the effects of spatial attention, we spatially coregistered all stimuli and varied the attended modality across counterbalanced blocks in an intermodal selection task. In each block participants selectively responded to either auditory, visual, or vibrotactile stimuli from the stream of intermodal events. Auditory and visual ERPs were modulated at the latencies of early cortical processing, but attention manifested later for tactile ERPs. For ERPs, auditory processing was modulated at the latency of the Na (29 ms) which indexes early cortical or thalamocortical processing and the subsequent P1 (90 ms) ERP components. Visual processing was modulated at the latency of the early phase of the C1 (62-72 ms) thought to be generated in primary visual cortex and the subsequent P1 and N1 (176 ms). Tactile processing was modulated at the latency of the N160 (165 ms) likely generated in secondary association cortex. Intermodal attention enhanced early sensory GBRs for all three modalities: auditory (onset 57 ms), visual (onset 47 ms) and tactile (onset 27 ms). Together, these results suggest that intermodal attention enhances neural processing relatively early in the sensory stream independent from differential effects of spatial and intramodal selective attention.
NIH-PA Author Manuscript
Attention is often discussed as if it were a unitary process where some stimuli are simply selected for further or more in-depth processing. However, this is an incomplete view of the multi-faceted nature of attention. Attentional processes in the environment often involve complex interactions of selection and enhancement across and within multiple sensory modalities. In navigating this dizzying array of sensory stimuli, humans and many other animals must use short and long-term goals to select a relevant sensory stream while suppressing distracters. In fact, human participants often report that they employ both enhancement and suppression to tune their attention intermodally, focusing within and across sensory modalities. An important guiding principle in characterizing the neural bases of attentional phenomena is to investigate where and when attention modulates sensory processing. One model of attention is a series of hierarchical filters attenuating and enhancing processing along a sequential processing stream according to task demands (Hillyard & Anllo-Vento, 1998) which may reflect both feed-forward and feed-back mechanisms of attention (Schroeder, Mehta, & Foxe, 2001). According to a hierarchical model, spatial attention operates early, enhancing the processing of both target and non-target stimuli in the attended location while further selection based on stimulus features occurs later in the processing stream. These
Corresponding author: Christina M. Karns, 1227 University of Oregon, Eugene, OR 97403-1227,
[email protected].
Karns and Knight
Page 2
concepts have typically been investigated within a single sensory modality. An important theoretical consideration is where does intermodal attention fit in the attentional hierarchy?
NIH-PA Author Manuscript
In the present study we investigate the latency at which intermodal attention influences sensory processing using well-studied evoked-potentials and oscillatory responses in the gamma band. Oscillatory activity is less commonly reported than ERPs but gamma band oscillatory responses (GBRs; generally 20 to 80 Hz) are observed in multiple sensory modalities. For example, gamma oscillations occur in the olfactory bulb (Eeckman & Freeman, 1990; Freeman, 1975), retina (Ogden, 1973), visual cortex (Narici, Carozzo, Lopez, Ogliastro, & Sannita, 2003; Whittaker & Siegfried, 1983), auditory cortex (Galambos, Makeig, & Talmachoff, 1981; Pantev et al., 1991), and somatosensory system, (Arnfred, Hansen, Parnas, & Mørup, 2007). These gamma band responses are typically phase locked to stimulation and the early latencies of these oscillations support a source early in the sweep of sensory information from the peripheral receptors to the cortex. For example, in the visual modality, evoked gamma localized to visual cortex is immediately preceded by retinal oscillations (Lopez & Sannita, 1997). GBRs are also elicited with focal stimulation of the thalamic reticular nucleus (Macdonald, Fifkova, Jones, & Barth, 1998) but also occur spontaneously and appear to be an emergent property of laminar interconnected structures such as the cerebral cortex, hippocampus, and retina (Sukov & Barth, 2001).
NIH-PA Author Manuscript
If oscillations phase-lock with stimulation, the result of an average across trials is present in the ERP. However, whether ERPs are entirely due to phase-locking of oscillations is controversial (Klimesch, Sauseng, Hanslmayr, Gruber, & Freunberger, 2007; Makeig et al., 2002; Min et al., 2007). There is evidence that lower frequency oscillations are coupled to high frequency oscillations (Canolty et al., 2006; Demiralp et al., 2007; Lakatos et al., 2005) indepenedent of ERP dynamics. The precise relationship between ERPs and oscillatory responses is uncertain. The purpose of the present paper is not to resolve this question, but to use the GBR as an additional tool to elucidate the mechanisms of intermodal attention. We follow (Sannita, 2000) and use the term “gamma band oscillatory responses” rather than “evoked” gamma which implies a new oscillatory response that did not exist in the prestimulus period.
NIH-PA Author Manuscript
Although early GBRs are a sensory response, like other sensory responses they are modulated with attention. In many respects, the effects of selective and spatial attention on GBRs echo what has been reported with ERPs. In the auditory modality, spatial attention in a fast dichotic listening task may operate early modulating the magnetic 20-50 ms eventrelated average (Woldorff et al., 1993) and the scalp-recorded GBR earlier than 50 ms (Tiitinen et al., 1993). In the visual modality, the C1 response, which is the main index of V1 processing, may not modulated with spatial attention (Clark & Hillyard, 1996; Di Russo, Martínez, & Hillyard, 2003; Foxe & Simpson, 2002; Hillyard & Anllo-Vento, 1998; Mangun, Buonocore, Girelli, & Jha, 1998; Noesselt et al., 2002), but may be modulated with other types of attention (Khoe, Mitchell, Reynolds, & Hillyard, 2005; Proverbio, Del Zotto, & Zani, 2007). However, recently (Kelly, Gomez-Ramirez, & Foxe, 2008) report spatial attention modulation of the C1. Visual GBRs are also reported to be modulated with selective attention (Busch, Schadow, Fründ, & Herrmann, 2006). Tactile spatial attention also enhances GBRs in regions consistent with contralateral S1 (Bauer, Oostenveld, Peeters, & Fries, 2006). Intermodal attention modulates spontaneous gamma activity in the auditory cortex of the cat (Lakatos et al., 2004) and induced gamma increases over the sensory cortex of attended sensory modalities and decreases over the cortex of unattended sensory modalities (Sokolov, Pavlova, Lutzenberger, & Birbaumer, 2004). Here we present evidence that intermodal attention affects GBRs in the auditory, visual, and tactile sensory modality independent of the effects of spatial and intramodal attention.
J Cogn Neurosci. Author manuscript; available in PMC 2011 May 11.
Karns and Knight
Page 3
NIH-PA Author Manuscript
Intermodal attention is typically assessed with ERPs in tasks where participants detect targets in one sensory modality while non-targets appear in the same modality as the target and also in other sensory modalities. For example, the subject is asked to detect a dim light in a series of slightly brighter lights, while sounds are also presented (Hötting, Rösler, & Röder, 2003; Mehta, Ulbert, & Schroeder, 2000a, 2000b; Talsma & Kok, 2001, 2002). Important for addressing intermodal attention, one can compare auditory non-targets when they are in the attended sensory channel to when another modality is the attended channel. In human vision, landmark studies using ERP methodology have demonstrated that spatial attention is a prerequisite for observation of attention to features and that spatial attention benefits extend to non-target stimuli (Hillyard & Anllo-Vento, 1998). A further rationale for this selective attention design stems from the fact that ERPs are quite sensitive to arousal. Through requiring an active selective attention task in each modality, arousal can be equated across blocks while focusing the analysis on non-targets eliminates any motor response confounds.
NIH-PA Author Manuscript
The intramodal design for investigating intermodal attention has two potential mechanisms of attention at work. The first is intermodal enhancement and the second is intramodal selective attention within the attended channel. For example, if a dim target must be selected from a series of brighter targets, target and non-target visual stimuli are both in the attended sensory channel, but the selective attention demands of the task may require that each visual stimulus be further evaluated to determine if it matches the target template. In this circumstance attention might operate to delay gating until a slightly later stage of processing to reduce false alarms. In the present study we use a different approach and required selection only between sensory modalities rather than both within and between modalities. To compensate for response-related contamination of the ERPs and GBRs we limit our perceptual analysis to 200 ms and earlier, a time-range less likely to be contaminated with response-related potentials.
NIH-PA Author Manuscript
The influence of space is often overlooked in intermodal attention studies (reviewed (Eimer, 2001). For example, in previous studies researchers presented auditory stimuli through headphones and the visual stimuli on a computer monitor (Alho, Woods, & Algazi, 1994; Woods, Alho, & Algazi, 1993). Spatial selective attention can operate early (25 ms) in a fast-paced dichotic listening task (Woldorff et al., 1993). Thus, if stimuli are not spatially coregistered the effects of intermodal attention could be influenced by spatial attention. The few studies controlling for the effects of spatial attention by implementing spatial coregistration of stimuli across multiple modalities report intermodal attention effects as early as 70 ms for auditory stimuli (Eimer & Schroger, 1998; Talsma & Kok, 2001, 2002), but these tasks involve intramodal selective attention as well. Here we address the open question of how early does intermodal attention operates with spatially coregistered stimuli in an intermodal selection task without intramodal attention demands? Another way intermodal attention has been examined is through cueing studies where participants are cued to which modality they should expect a target and after some delay, stimuli in the expected or unexpected modality are presented. This design is an elegant way to examine preparatory and subsequent redirection of attention (Foxe & Simpson, 2005; Foxe, Simpson, Ahlfors, & Saron, 2005). However, findings relating to the latency at which attention operates in such a cued task may not directly generalize to tasks where sustained attention is required. For example, in a tactile attention task, the effects of attention were observed 60 ms earlier than when sustained attention was required relative to when subjects were asked to switch attention trial to trial (Eimer & Forster, 2003). In the present study we use a block design to address the question of whether sustained intermodal attention affects early sensory processing.
J Cogn Neurosci. Author manuscript; available in PMC 2011 May 11.
Karns and Knight
Page 4
NIH-PA Author Manuscript
In summary there is evidence that some aspects of attention, primarily spatial, influence early sensory processing, but the effects of intermodal attention without the differential effects of spatial and intramodal selective attention are unknown. We propose that sustained intermodal attention may tune early sensory cortices allowing attentional modulation to operate at latencies similar to or earlier than has been reported for spatial attention. In the present study we test whether intermodal attention elicits enhanced processing in three sensory modalities, auditory, visual, and tactile, as indexed by sensory ERP components and GBRs at the latencies and scalp topographies corresponding to the earliest stages of sensory processing.
Method Participants
NIH-PA Author Manuscript
Experimental participants with normal or corrected-to-normal visual acuity, normal hearing, no history of significant medical, neurological, or psychiatric illness, and ages 18 to 35 years were recruited from the university community. Twenty-five participants participated in the experiment. Four participants were immediately excluded due to excessive physiological artifacts (blinks, muscle). Additional participants were excluded when there were insufficient trials for adequate signal to noise in the ERP for a particular analysis, as determined by a subjective assessment of each participant's data quality separately validated by ranking participants by the number of trials per average. The mean age of the 21 participants was 23 years; all were right handed and 10 were female. The University of California, Berkeley Institutional Review Board, approved the study and written informed consent was obtained from all participants. Electrophysiological Recording Procedures The electroencephalogram (EEG) was collected in a sound attenuated chamber at a 1024 HZ digitization rate with a 72-channel Biosemi system. Signals were recorded relative to the Common Mode Sense (CMS) active electrode and then digitally re-referenced to the nose and downsampled to 512 Hz when analyzed for ERPs and to 256 Hz for GBRs. The Biosemi system uses a CMS active electrode and a passive electrode (DRL) to form a feedback loop that drives the average potential of the system as close as possible to the reference voltage in the Analog-Digital box (see www.biosemi.com). The 64 head channels were positioned according to the extended 10-20 system, plus external electrodes (two mastoid, three ocular, one nose). Stimulus Presentation and Experimental Apparatus
NIH-PA Author Manuscript
Stimuli were presented with E-prime software operating on a PC (Windows 98) with a SoundblasterLive Soundcard. Digital stimulus markers were recorded with the EEG and timing accuracy was verified via a photodiode and oscilloscope. Instructions and visual stimuli were presented via a DLP projector (Plus U5-132 Digital Projector) at a 60 Hz refresh rate onto an acoustically permeable screen (Dazian Fabrics). Auditory, visual, and vibrotactile stimuli were 300 ms in duration. Participants used a forehead-rest to maintain head position across blocks with jaw relaxed. Visual stimuli were a flashed blue square (4° visual angle) 10°-15° to the left or right of a central white fixation cross on a black background. The ambient light from the DLP projector was the only light source. Participants were instructed to keep their eyes at a fixation cross and eye-movements were monitored with closed circuit television and the electrooculogram (EOG). Contaminated trails were removed from analysis. Auditory stimuli were a 60 dB SPL broadband sound with 5 ms on- and offset attenuation played through a speaker (Orb Audio) placed behind the screen out of view directly behind the location of the visual stimuli (see Figure 1). The sound, a duck quack, had a fundamental frequency of 300 Hz with 10 harmonics; the J Cogn Neurosci. Author manuscript; available in PMC 2011 May 11.
Karns and Knight
Page 5
NIH-PA Author Manuscript
maximum power was at 600 Hz. Tactile stimuli were presented with a modified mini speaker (Philmore) with paper cone removed to reduce audibility. A 200 Hz tone with 5 ms on- and offset attenuation was delivered to the fingertips. The speaker was mounted in a sound insulated foam mitten placed on the subject's hand, which was also placed behind the screen, arm outstretched, directly behind the visual stimulus (see Figure 1). To eliminate pressure differences across the session, fingertips within the mitten were attached to the vibration device with elastic. The hand was supine with fingertips at 90° to the palm of the hand. Vibrations were undetectable by the sound-pressure meter. At the beginning of each session, participants were asked to report vibrations with and without their fingertips on the vibration device; the amplitude was then adjusted within a small range so each participant was unable to hear the vibration. Task Design
NIH-PA Author Manuscript
Auditory, visual, and tactile stimuli were presented in an intermodal attention task. Simultaneous auditory-visual stimuli were also presented but since both intermodal attention and multisensory interactions are expected to affect these bimodal stimuli findings related to these stimuli are beyond the scope of the present paper and are not described here. Participants were instructed to respond to stimuli in one sensory modality in each of three blocks as quickly and accurately as possible regardless of whether that stimulus was paired with another stimulus in a different modality. The order of blocks was counterbalanced across subjects. Reaction times were collected with a serial response box (Psychology Software Tools Inc). Stimuli were presented either to the left or right of fixation, counterbalanced by subject, and subjects responded with the opposite hand. We presented stimuli in pseudorandom order with the following proportions to equalize the number of responses to and the number of each type of stimulus across blocks. In Equalize Stimuli blocks (EqStim) each stimulus type (auditory, visual, auditory-visual, and tactile) was 25% of the total. In the Equalize Responses (EqResp) blocks the proportion of tactile stimuli was increased to equalize the total number of responses across blocks (auditory 20%, visual 20%, auditory-visual 20%, and tactile 40%). A total of 1860 stimuli were presented in pseudorandom order with the interstimulus interval (ISI) jittered at random intervals between 1400 ms and 1900 ms. To maintain the alertness of our participants, blocks were broken into 4 to 5 minute sessions. With short breaks following each session recording sessions were about 90 minutes in duration. Data Analysis
NIH-PA Author Manuscript
Behavioral Data—Reaction times, hit rates, and false alarm rates were analyzed with a Proportion (EqStim, EqResp) × Stimulus (Auditory, Visual, Tactile) ANOVA. Main effects and interactions were followed up with post-hoc t-tests bonferoni corrected for the number of post-hoc comparisons within each dependent variable. Hit rate is the number of correct responses divided by the total number of trials where a response was required. False alarm rate is the number of responses when a target was not present divided by the total number of trials where a response should be withheld. To evaluate performance in the context of signal detection theory, d' and centered criterion (c) were also estimated and analyzed. Values for d' were estimated for each subject by subtracting Z(false alarms) from Z(hits). Values for c were estimated by subtracting d'/ 2 from Z(false alarms). If no errors were present, a value of 0.5 was assigned to the empty category. Values for c were also subjected to a one-sample t-test to test the null hypothesis that the bias was zero. ERP Data—Epochs time-locked to stimulus onset were extracted from -130 to 770 ms, averaged, and band-pass filtered offline from 1 to 50 Hz. Epochs containing horizontal or vertical eye-movements or blinks, excessive muscle activity, or isolated electrode malfunction were excluded from the average. For each subject, the ERPs were digitally reJ Cogn Neurosci. Author manuscript; available in PMC 2011 May 11.
Karns and Knight
Page 6
NIH-PA Author Manuscript NIH-PA Author Manuscript
referenced to the nose. The baseline for each channel (defined relative to the stimulus onset as -100 to 0 ms) was subtracted for each average for statistical comparisons. Our dependent variable (peak amplitude) was calculated with a two-step method. First, peaks of established ERP components were detected in the grand average across participants (GAV) in a priori electrodes and latencies of interest determined from pilot data and ERP literature. We used a semi-automatic peak detection algorithm (Brain Vision Analyzer software). If a peak was not apparent in the grand average the latency range was not analyzed further. Electrode locations for participants receiving right-sided stimulation were digitally flipped across the midline to simulate all stimuli appearing to the left of fixation to allow comparison across subjects receiving stimulation on different sides. Electrodes contralateral and ipsilateral to the side of stimulation are indicated by a “c” or “i” respectively. A priori electrodes and latencies of interest where we expected a peak in the ERP were: Auditory: Na (10-30 ms, FZ), P50 (30-50ms; FCZ), P1 (60-130 ms; FCZ), N1 (115-170 ms; CZ). Visual: C1 (50-90 ms, CPZ), P1 (80-130 ms, P10-c), N1 (120-200, P10-c). Vibrotactile: N40 (10-50ms, PZ), P80 (30-90, FC6-c), N80 (60-100, C4-c), P100 (80-130, FCZ), N160 (120-200ms, FC6-c). To increase signal relative to noise, amplitudes were then averaged across neighboring electrodes to form channel-groups of interest (Auditory: F, FC, C; Visual: CP, P-c; and Vibrotactile: P, FC-c, C-c, FC) as indicated in Figure 2. Second, a time-window was centered on the detected peak and the mean voltage within the time window was calculated for each subject. Window sizes were adjusted from 10 ms to 60 ms as latencies increased as specified in Table 2. We hypothesized that intermodal attention would increase the amplitude of ERP components prior to 200 ms at specific electrode sites. We first tested whether other independent variables affected the peak amplitudes with a Stimulus Proportion (EqStim, EqResp) × Attention Modality (Auditory, Visual, Tactile) ANOVA with Hemifield (Left, Right) as a between subjects factor. Subjects with insufficient numbers of trials per cell were excluded from this analysis. We followed with tests of whether ERP amplitude differed between the two unattended modalities and performed planned one-tailed t-tests to test the hypothesis that attended stimuli elicited larger ERP components than the average of the ERPs following these stimuli when attention was directed to either of the other two sensory modalities.
NIH-PA Author Manuscript
GBR Data—Our prediction was that intermodal attention directed to a stimulus, increases power in the GBR in the initial response to the stimulus ( 0.05), but Proportion interacted with Stimulus for three behavioral measures: false alarm rate (F(2,40) = 7.72, p < 0.05), response time (F(2,40) = 6.1, p < 0.05), and c (F(2,40) = 3.6, p < 0.05). However, Proportion was only significantly different within a stimulus modality for tactile false alarm rate (p < 0.05). False alarms were rare overall and the increase from 0.6% to 0.9% with a larger proportion of tactile stimuli corresponds to an average increase of 0.5 false alarms. ERP Data
NIH-PA Author Manuscript
Visual Stimuli—Early visual components apparent in the grand average were the C1 (72 ms), P1 (120 ms), and N1 (176 ms) (Figure 3). In the Stimulus Proportion × Attention × Hemifield ANOVA five subjects were excluded due to insufficient numbers of trials for a reliable ERP for each cell. At the CP electrode group we did not find evidence that the visual components were affected by Stimulus Proportion or Hemifield (p > 0.10), but did find the predicted main effects of Attention for the C1 (F(2,28) = 5.93, p< 0.05) and N1 (F(2,28) = 6.1, p < 0.05) components, but not the P1 (p > 0.10). When we divide the C1 into an early (62-72 ms) and late (72-82 ms) phase, there was a main effect of attention only for the early phase (F(2,28 = 3.55, p . 10) so we tested whether the ERP to the attended stimulus was larger than the average of the two unattend conditions (see Table 2). At the latency of the C1, which had a negative polarity, amplitudes within a 10 ms window were more negative at electrode group CP when the visual modality was attended rather than when the auditory or tactile modality was attended (p < 0.05). We further tested the early and late phase of the C1 for the effects of visual attention. The average voltage within the C1-early window was more negative with visual attention (p < 0.05), and although the ANOVA revealed no main effect of attention in the late phase of the C1, the t-tests reveal a significant difference in the C1-late window (p
.10), P1 (t(20) = 1.70, p < 0.05) and N1 (t(20) = -3.9, p < 0.05). We further verified the C1 effect with follow-up analyses. We split the subjects into two groups, odd and even, and found that the attention effect was significant at C1 for both odd (t(10) = -2.13, p < 0.05), and even (t(9) = -2.35, p < 0.05) subject groups. The scalp topographies of the difference waves (attended minus unattended, Figure 3) are consistent with modulations of the C1, P1, and N1. The topography of the C1 attention effect does not show evidence of an overlapping contribution from the posterior-lateral P1.
NIH-PA Author Manuscript
Auditory Stimuli—Early peaks detected in the auditory grand average were the Na (29 ms), P1 (90 ms), and N1 (148 ms) (See Figure 4). Results of statistical comparisons at these components are summarized in Table 2. In the Stimulus Proportion × Attention × Hemifield ANOVA four subjects were excluded due to insufficient numbers of trials for a reliable ERP for each cell. We did not find evidence that auditory components were affected by Stimulus Proportion or Hemifield (p > 0.10), but did find the predicted main effects of attention for the Na (F(2,30) = 5.13, p < 0.05) and P1 (F(2,30) = 3.44, p < 0.05) components, but not the later N1 (p > 0.10). By averaging across Stimulus Proportion and Hemifield cells all 21 subjects had sufficient trials to be included in the planned t-test analysis. There was no evidence for a difference between the two unattended condition (attend tactile and attend visual) (p > 0.10). Planned comparisons between attend and the average of the two unattend conditions revealed early attention effects (see Table 2). At the earliest latency examined (Na), mean amplitudes at electrode group F were more negative when the auditory modality was attended than when attention was deployed to the visual or tactile modality (p < 0.05). Mean amplitudes at the P1 latency window were more positive at group FC when the auditory modality was attended (p < 0.05). Mean amplitudes within the N1 latency window were not different at group C with attention to the auditory modality (p > 0.10). Scalp topographies of the difference wave (attended minus unattended, Figure 4) are consistent with the topography of the P1 considered to be in the superior temporal plane. The Na difference wave is more widespread.
NIH-PA Author Manuscript
Tactile Stimuli—Tactile components apparent in the grand average were the N40 (45 ms), P80 (85 ms), P100 (100 ms), and N160 (165 ms) (Figure 5). Results of statistical comparisons at these components are summarized in Table 2c. In the Stimulus Proportion × Attention × Hemifield ANOVA four subjects were excluded due to insufficient numbers of trials for a reliable ERP for each cell. In contrast to the results for auditory and visual stimuli, we did not find a main effect of Attention for any of the vibrotactile components (p > 0.10). Furthermore, we did not find evidence that the earliest two components (N45 and P80) were affected by Stimulus Proportion or Hemifield. However, we did find evidence that the later tactile components were affected by the change in stimulus proportion. The P1 (F(1,15) = 5.1, p < 0.05) and N160 (F(1,15) = 5.5, p < 0.05) components were each larger in the EqStim blocks (where there was a smaller proportion of tactile trials, 25% of total) than the EqResp blocks (where there was a larger proportion of tactile trials, 40%). For symmetry with the analysis of the auditory and visual modalities, we still performed our planned follow-up t-tests on the ERPs generated by averaging across these cells and with all 21 subjects included. The effects of tactile attention relative to the average of auditory and
J Cogn Neurosci. Author manuscript; available in PMC 2011 May 11.
Karns and Knight
Page 9
NIH-PA Author Manuscript
visual stimuli were not significant for the N40, P80, or P100. There was an effect of attention at the N160 component (p < 0.05).There were no differences between the two unattend conditions for any component (p > 0.10). Gamma band oscillatory responses (GBR) We performed planned t-tests comparing attended and unattended stimuli with the full cohort of 21 subjects. As shown in the left panel of Figure 6, for each modality we observed a significant power increase (t(18) > 1.73, p < 0.05, one-tailed) in the gamma range for evoked oscillations in response to attended relative to unattended stimuli. For attended visual stimuli relative to unattended, there was a significant increase in power in the 32 to 44 Hz frequency range the with an average onset of 47 ms. For attended auditory stimuli relative to unattended, power increased in the 45 to 50 Hz frequency range with an average onset of 57 ms. For attended vibrotactile stimuli relative to unattended, power increased in the 42 to 53 Hz frequency range with an average onset of 27 ms. The right panel of Figure 6 demonstrates the distribution of the significant power increase across the scalp. For the visual modality, power was distributed posteriorly. For the auditory modality, power was distributed centrally. For the vibrotactile modality, power was distributed over the contralateral frontocentral scalp. We validated that the initial selection of the channels-ofinterest did not bias the resulting topographies by comparing them to the evoked ERSP image averaged across all channels.
NIH-PA Author Manuscript
Discussion We assessed whether intermodal attention operates early in neural processing, controlling for spatial attention and intramodal selective attention. We spatially coregistered auditory, tactile, and visual stimuli and required stimulus selection across sensory modalities (intermodal selection) rather than within a modality (intramodal selection). We found some evidence for early modulation of intermodal attention in each of the three sensory modalities. There were some differences between the results generated from ERP and GBR methods as well as differences across sensory modalities. While auditory and visual modalities were each modulated early with intermodal attention, tactile intermodal attention only manifested at the earliest latencies in the GBR. Although we do not directly compare non-spatial intermodal attention and spatial intramodal attention in the same study, relating our findings to previous studies provides some insights into how intermodal attention may fit into a hierarchical attention scheme.
NIH-PA Author Manuscript
In the ERP domain, visual processing was modulated at early stages of sensory processing as indexed by the C1 (72 ms), earlier than has generally been reported for selective spatial attention. Only the early phase of the C1 was affected by our attention manipulation, while the later phase -- which may overlap with the P1 (Foxe & Simpson, 2002) extrastriate sources (Clark & Hillyard, 1996; Di Russo et al., 2003) – only tended to be affected by attention. The C1 is well-accounted for by a source in the calcarine sulcus, inverting when stimuli are presented in the upper or lower hemifield (Di Russo et al., 2003). Despite careful attempts (Clark & Hillyard, 1996; Di Russo et al., 2003; Foxe & Simpson, 2002; Hillyard & Anllo-Vento, 1998; Mangun et al., 1998; Noesselt et al., 2002), the early phase of the C1 has not been shown to be modified with spatial attention with an intramodal selection task, with the exception of one recent report (Kelly et al., 2008), but there are other reports of attentional modulation of the C1 in different circumstances (Khoe et al., 2005; Proverbio et al., 2007). Here we report intermodal attention modulation at a latency and topography consistent with the C1. We cannot be certain that our early attention effect (62 ms) is the previously reported C1 that has been localized to the calcarine sulcus, since our stimuli were not designed to show polarity inversion across the calcarine sulcus. Examination of the
J Cogn Neurosci. Author manuscript; available in PMC 2011 May 11.
Karns and Knight
Page 10
waveforms suggests that the C1 is not apparent in the unattend conditions, but we do not conclude the C1 is absent as it may be simply attenuated in amplitude.
NIH-PA Author Manuscript
Further attention processing was indicated by increased amplitudes of the later components, generally considered to be in extrastriate cortex, which are modified with spatial attention as early as 80 ms (Mangun et al., 1998). Intermodal attention increased amplitudes of the P1 (120 ms) and N1 (176 ms), but the P1 modulation was sensitive to manipulations of the prestimulus baseline. Due to alpha noise in the prestimulus period, the P1 effect was not significant with a 100 ms baseline, but when a shorter 50 ms baseline was chosen the data revealed significant C1, P1 and N1 enhancement with visual attention. Pre-stimulus alpha activity may simply be noise, but could also be related to sustained intermodal attention (Min & Herrmann, 2007). Power in the gamma band was also increased with onset of visual intermodal attention at 47 ms with a posterior topography. The onset time of the GBR attention effect, combined with the modulation of the early phase of the C1 supports the interpretation that visual intermodal attention may operate as early, or earlier than, visual spatial selective attention.
NIH-PA Author Manuscript NIH-PA Author Manuscript
Auditory processing was also modulated at relatively early latencies in the ERP and GBR domain. The latencies of the intermodal attention enhancements we report are similar to modulation with spatial selective attention. Spatial attention effects have been reported as early as the Pa (20-50ms) component of the MLR when attending to one ear while ignoring another in a fast-paced dichotic listening task with high attention load (Woldorff et al., 1993) and is thought to index primary cortical processing (Deiber, Ibañez, Fischer, Perrin, & Mauguière, 1988; Liégeois-Chauvel, Musolino, Badier, Marquis, & Chauvel, 1994; Woods, Alain, Covarrubias, & Zaidel, 1995). GBR attention modulations were also elicited in a similar task (Tiitinen et al., 1993). The auditory ERP intermodal attention effect we report here (29 ms) is relatively late for the classic Na evoked by clicks (19ms) and may reflect primarily a cortical source or a mixture of cortical and subcortical sources given the relatively broad topography of the attention effect at this latency. Data from patients with frontal cortex lesions supports the notion that top-down influences from elements of distributed cortical attention networks can modify early sensory processing at the primary cortical level (Knight, Scabini, & Woods, 1989) suggesting a possible frontal involvement in this early modulation. Auditory attention effects on the GBR power onset at 57 ms with a centrally distributed topography. By analogy to ERPs, the topography may be consistent with a source in the superior temporal plane. It is notable that these early intermodal attention modulations were elicited without the constraints of a fast ISI and high load (Woldorff et al., 1993). Another point of interest is that the attention effect in the GBR domain is not significant until 57 ms compared to 29 ms in the ERP domain. The onset profile of the auditory attention effect on the GBR does appear to start earlier than the visual or tactile attention effect, but this not significant until 57 ms; it may be that the GBR response may reflects a different neural mechanism than the mid-latency ERP response. As noted the precise relationship between ERPs and GBRs is not known. Overall, our early modulations in the ERP and GBR domains suggest that auditory intermodal attention operates at similar latencies to auditory spatial selective attention. In the tactile modality we found no evidence of attentional modulation of the ERPs at the earliest latencies. However, tactile attention modulated the GBR power relatively early, at 27 ms. This attention effect was distributed over the frontcentral scalp consistent with contralateral scalp distributions of early tactile ERP components (Hämäläinen, Kekoni, Sams, Reinikainen, & Näätänen, 1990). In the ERP domain, we found some evidence of tactile attention effects at the N160 latency with a bilateral topography consistent with a source in somatosensory association cortex and similar to N140 attention effects reported elsewhere (Desmedt & Robertson, 1977; Eimer & Forster, 2003; García-Larrea,
J Cogn Neurosci. Author manuscript; available in PMC 2011 May 11.
Karns and Knight
Page 11
NIH-PA Author Manuscript
Lukaszewicz, & Mauguière, 1995; Hämäläinen et al., 1990; Michie, Bearpark, Crawford, & Glue, 1987). One explanations for why our results for the tactile modality may be different than the auditory and visual modality is that our choice of vibrotactile stimulus may not be optimal to show robust early attention effect in the ERP. However, behavioral results seem to indicate that the strength of the stimulation was comparable to the auditory stimuli. Responses to the tactile modality were only 4 ms slower on average than responses to the auditory stimuli, did not have the smallest d', and were not the least accurate. Thus, it seems unlikely that the stimuli were simply too faint to elicit robust attention effects. Furthermore, in contrast to the ERP domain, in the spectral domain, we found that tactile attention increased GBR power at 27 ms. The early latency and contralateral frontocentral scalp topography of this oscillatory attention effect may indicate a modulation of primary somatosensory cortex. Contralateral tactile ERPs have been attributed to primary somatosensory cortex (Hämäläinen et al., 1990). It may be that we observed an effect in the GBRs but not the ERPs because of signal to noise advantages when honing in on one frequency range. Another option is that ERPs and GBRs reflect different brain processes that are differentially affected by intermodal attention.
NIH-PA Author Manuscript
The tactile modality was the only modality where we observed an effect of our stimulus proportion manipulation in the ERPs. We observed larger P1 and N1 components with smaller proportions of tactile stimuli but the proportion manipulation did not affect auditory and visual stimuli. This may be because the proportion of tactile stimuli was increased from 25% in EqStim blocks to 40% in EqResp blocks, whereas the proportion of auditory and visual stimuli were similar in these two blocks (25% and 20% respectively). Thus, it may be that tactile stimuli habituated in the EqResp blocks, reducing their amplitudes. This is one explanation for our inability to detect tactile attention changes in the ERP. Perhaps the higher proportion of tactile ERPs reduced the amplitudes of the early components so we were unable to detect a robust signal. However, it is important to note that we did not find evidence of an interaction between the stimulus proportion and intermodal attention. In the behavioral domain, only false alarm rates differed with proportion within any stimulus modality and only in the tactile modality. The false alarm rate was small and the reported increase in false alarms with increasing proportion of tactile stimuli corresponded to an average increase of ½ a false alarm which suggests the influence of stimulus proportion on false alarm rate for the tactile modality was minimal
NIH-PA Author Manuscript
Recall that the stimulus proportion manipulation was included to balance the stimulusresponse requirements of the different stimulus types since our task included auditory-visual bimodal stimuli. The analysis of these bimodal stimuli is outside the scope of the present paper since attentional modulations may include both intermodal attention effects as well as multisensory interactions which merit separate consideration. However, we should note that the inclusion of the bimodal stimuli might mean that auditory and visual attention blocks would be categorically different. For example, in an auditory block, subjects cannot always assign a no-go response to the visual stimulus since sometimes it is paired with an auditory stimulus. However, in a tactile block, all auditory and visual stimuli require a no-go response. For this reason, we directly compared the two unattend blocks for each stimulus types. We found no evidence of a difference between the two unattend conditions for each sensory modality. Perhaps these go and no-go response contingencies do not operate at the earliest latencies. We also designed our experiment to equate the task-demands and arousal across blocks, namely selecting a stimulus in one modality at the expense of stimuli in other sensory modalities. In our experiment, stimulus detection in all modalities were all well above threshold (d' > 3.9) and the task was performed with high accuracy (> 85% hits) in all conditions. We took care to present stimuli at a detectable but not overwhelming level and
J Cogn Neurosci. Author manuscript; available in PMC 2011 May 11.
Karns and Knight
Page 12
NIH-PA Author Manuscript
subjectively equated the stimuli in terms of how dim, quiet, or soft the stimulation. However, since we did not perform an extensive psychophysical procedure to equate stimuli there were still behavioral differences across modalities. Therefore, we should be cautious when directly comparing the relative latencies of attention modulation in the three sensory modalities. For example, visual stimuli were fastest and had the highest d'. This may explain why visual stimuli were modulated relatively earlier in the processing stream relative to spatial attention than the auditory modality, but this empirical question awaits further experiments. An important theoretical issue to consider is that stimuli were all presented in an attended spatial location and we do not directly compare the influence of intermodal attention at attended and unattended locations. It is interesting that in another study reporting C1 attention effects (Khoe et al., 2005), competing stimuli were also presented in an attended spatial location. A reasonable speculation is that spatial attention interacts with or is a prerequisite for intermodal attention to elicit the early modulations we report.
NIH-PA Author Manuscript
There are methodological issues to consider. First, the method in which we coregister stimuli has spatial limitations. With our apparatus, stimulation in the three sensory modalities were coregistered precisely in azimuth and altitude and participants could not see the speaker or vibration device, however, the devices were separated by 2-4 cm in the depth plane due to equipment limitations. It seems unlikely that such a small separation in the depth plane would elicit earlier spatial attention effects than have been reported for large spatial separations across the midline. A further limitation to the present study is that when selection takes place across sensory modalities, the comparison between attended and notattended stimuli is also a comparison between target and non-target stimuli. We accept this limitation as a necessary trade-off in investigating intermodal selection without the influence of intramodal selection and only compare attended (target) and not-attended (non-target) stimuli in the first 200 ms. Furthermore, a claim that our amplitude differences with intermodal attention were due to contamination by response related ERPs would have to account for the fact that although responses to attended visual stimuli were 30 ms faster than responses to auditory stimuli, attention modulation of the ERP is 30 ms later than for the auditory modality. Another issue to consider is that a blocked experimental design is susceptible to differences across blocks that are not attention related, but we counterbalanced blocks across participants to control for order effects across participants. Further controls were applied to the apparatus across blocks to prevent drift in the position of the participants relative to the peripheral stimulators. We did not find evidence for a hemispheric difference in the present study and collapsed across presentation hemifield in our analysis.
NIH-PA Author Manuscript
Since many attention studies to date have found attention modulations on ERPs it is not surprising that the influences of attention would be evident in the spectrotemporal domain as well. Indeed there is increasing evidence that attention effects can modulate both oscillations phase-locked to the stimulus such as the ones utilized in the present paper and induced oscillations. In the auditory and visual modality, the GBR analysis confirms and extends the ERP results. In the tactile modality, the GBRs demonstrated earlier effects of attention than the ERPs. Examining GBRs may be prudent when looking for effects of attention on small amplitude early-evoked potentials. The current data support the hypothesis that intermodal attention may operate early in sensory processing in the visual, auditory, and possibly vibrotactile modalities. The view that intermodal attention operates early is consistent with imaging studies reporting modulation of sensory cortices with intermodal attention (Tournev et al., 1999; Woodruff et al., 1996) but offers further information about the latency at which such modulations occur.
J Cogn Neurosci. Author manuscript; available in PMC 2011 May 11.
Karns and Knight
Page 13
NIH-PA Author Manuscript
The early latencies observed in the current study support the hypothesis that intermodal attention operates early in the sweep of sensory information to primary and secondary association cortices at latencies as early, or in some cases earlier, than has been reported with spatial attention manipulations.
Acknowledgments Thanks are due to the following research assistants who provided diligent and excellent technical assistance: Milky Kohno, Elaine Wu, Genessa Giorgi, David Horton, and Sara LaHue for their valuable assistance with building the experimental apparatus (GG, DH), data collection (MK, EW), pre-processing (MK, EW, SL), and manuscript preparation (SL). We are grateful for the constructive criticisms of the anonymous reviewers and financial support contributed by NINDS NS21135 and PO 40813 (R.T.K.) and NRSA F31 MH74342 (C.M.K).
References
NIH-PA Author Manuscript NIH-PA Author Manuscript
Alho K, Woods DL, Algazi A. Processing of auditory stimuli during auditory and visual attention as revealed by event-related potentials. Psychophysiology. 1994; 31(5):469–479. [PubMed: 7972601] Arnfred SM, Hansen LK, Parnas J, Mørup M. Proprioceptive evoked gamma oscillations. Brain Research. 2007; 1147:167–174. [PubMed: 17382913] Bauer M, Oostenveld R, Peeters M, Fries P. Tactile spatial attention enhances gamma-band activity in somatosensory cortex and reduces low-frequency activity in parieto-occipital areas. Journal of Neuroscience. 2006; 26(2):490–501. [PubMed: 16407546] Busch NA, Schadow J, Fründ I, Herrmann CS. Time-frequency analysis of target detection reveals an early interface between bottom-up and top-down processes in the gamma-band. Neuroimage. 2006; 29(4):1106–1116. [PubMed: 16246588] Canolty RT, Edwards E, Dalal SS, Soltani M, Nagarajan SS, Kirsch HE, et al. High gamma power is phase-locked to theta oscillations in human neocortex. Science. 2006; 313(5793):1626–1628. [PubMed: 16973878] Clark VP, Hillyard SA. Spatial selective attention affects early extrastriate but not striate components of the visual evoked potential. Journal of Cognitive Neuroscience. 1996; 8:387–402. Deiber MP, Ibañez V, Fischer C, Perrin F, Mauguière F. Sequential mapping favours the hypothesis of distinct generators for Na and Pa middle latency auditory evoked potentials. Electroencephalography and Clinical Neurophysiology. 1988; 71(3):187–197. [PubMed: 2451601] Delorme A, Makeig S. EEGLAB: an open source toolbox for analysis of single-trial EEG dynamics including independent component analysis. Journal of Neuroscience Methods. 2004; 134(1):9–21. [PubMed: 15102499] Demiralp T, Bayraktaroglu Z, Lenz D, Junge S, Busch NA, Maess B, et al. Gamma amplitudes are coupled to theta phase in human EEG during visual perception. International Journal of Psychophysiology. 2007; 64(1):24–30. [PubMed: 16956685] Desmedt JE, Robertson D. Differential enhancement of early and late components of the cerebral somatosensory evoked potentials during forced-paced cognitive tasks in man. Journal of Physiology. 1977; 271(3):761–782. [PubMed: 926022] Di Russo F, Martínez A, Hillyard SA. Source analysis of event-related cortical activity during visuospatial attention. Cerebral Cortex. 2003; 13(5):486–499. [PubMed: 12679295] Eeckman FH, Freeman WJ. Correlations between unit firing and EEG in the rat olfactory system. Brain Research. 1990; 528(2):238–244. [PubMed: 2271924] Eimer M. Crossmodal links in spatial attention between vision, audition, and touch: evidence from event-related brain potentials. Neuropsychologia. 2001; 39(12):1292–1303. [PubMed: 11566312] Eimer M, Forster B. Modulations of early somatosensory ERP components by transient and sustained spatial attention. Experimental Brain Research. 2003; 151(1):24–31. Eimer M, Schroger E. ERP effects of intermodal attention and cross-modal links in spatial attention. Psychophysiology. 1998; 35(3):313–327. [PubMed: 9564751] Foxe JJ, Simpson GV. Flow of activation from V1 to frontal cortex in humans. A framework for defining “early” visual processing. Experimental Brain Research. 2002; 142(1):139–150.
J Cogn Neurosci. Author manuscript; available in PMC 2011 May 11.
Karns and Knight
Page 14
NIH-PA Author Manuscript NIH-PA Author Manuscript NIH-PA Author Manuscript
Foxe JJ, Simpson GV. Biasing the brain's attentional set: II. effects of selective intersensory attentional deployments on subsequent sensory processing. Experimental Brain Research. 2005; 166(3-4): 393–401. Foxe JJ, Simpson GV, Ahlfors SP, Saron CD. Biasing the brain's attentional set: I. cue driven deployments of intersensory selective attention. Experimental Brain Research. 2005; 166(3-4): 370–392. Freeman, WJ. Mass Action in the Nervous System. New York San Francisco London: Academic Press; 1975. Galambos R, Makeig S, Talmachoff PJ. A 40-Hz auditory potential recorded from the human scalp. Proceedings of the National Academy of Sciences U S A. 1981; 78(4):2643–2647. García-Larrea L, Lukaszewicz AC, Mauguière F. Somatosensory responses during selective spatial attention: The N120-to-N140 transition. Psychophysiology. 1995; 32(6):526–537. [PubMed: 8524987] Hämäläinen H, Kekoni J, Sams M, Reinikainen K, Näätänen R. Human somatosensory evoked potentials to mechanical pulses and vibration: contributions of SI and SII somatosensory cortices to P50 and P100 components. Electroencephalography and Clinical Neurophysiology. 1990; 75(2): 13–21. [PubMed: 1688769] Hillyard SA, Anllo-Vento L. Event-related brain potentials in the study of visual selective attention. Proceedings of the National Academy of Sciences U S A. 1998; 95(3):781–787. Hötting K, Rösler F, Röder B. Crossmodal and intermodal attention modulate event-related brain potentials to tactile and auditory stimuli. Experimental Brain Research. 2003; 148(1):26–37. Kelly SP, Gomez-Ramirez M, Foxe JJ. Spatial Attention Modulates Initial Afferent Activity in Human Primary Visual Cortex. Cerebral Cortex. 2008 Khoe W, Mitchell JF, Reynolds JH, Hillyard SA. Exogenous attentional selection of transparent superimposed surfaces modulates early event-related potentials. Vision Research. 2005; 45(24): 3004–3014. [PubMed: 16153678] Klimesch W, Sauseng P, Hanslmayr S, Gruber W, Freunberger R. Event-related phase reorganization may explain evoked neural dynamics. Neuroscience and Biobehavioral Reviews. 2007 Knight RT, Scabini D, Woods DL. Prefrontal cortex gating of auditory transmission in humans. Brain Research. 1989; 504(2):338–342. [PubMed: 2598034] Lakatos P, Shah AS, Knuth KH, Ulbert I, Karmos G, Schroeder CE. An oscillatory hierarchy controlling neuronal excitability and stimulus processing in the auditory cortex. Journal of Neurophysiology. 2005; 94(3):1904–1911. [PubMed: 15901760] Lakatos P, Szilágyi N, Pincze Z, Rajkai C, Ulbert I, Karmos G. Attention and arousal related modulation of spontaneous gamma-activity in the auditory cortex of the cat. Brain research Cognitive Brain Research. 2004; 19(1):1–9. [PubMed: 14972353] Liégeois-Chauvel C, Musolino A, Badier JM, Marquis P, Chauvel P. Evoked potentials recorded from the auditory cortex in man: evaluation and topography of the middle latency components. Electroencephalography and Clinical Neurophysiology. 1994; 92(3):204–214. [PubMed: 7514990] Lopez L, Sannita WG. Magnetically recorded oscillatory responses to luminance stimulation in man. Electroencephalography and Clinical Neurophysiology. 1997; 104(1):91–95. [PubMed: 9076258] Macdonald KD, Fifkova E, Jones MS, Barth DS. Focal stimulation of the thalamic reticular nucleus induces focal gamma waves in cortex. Journal of Neurophysiology. 1998; 79(1):474–477. [PubMed: 9425216] Makeig S, Debener S, Onton J, Delorme A. Mining event-related brain dynamics. Trends in Cognitive Science. 2004; 8(5):204–210. Makeig S, Delorme A, Westerfield M, Jung TP, Townsend J, Courchesne E, et al. Electroencephalographic brain dynamics following manually responded visual targets. PLoS Biology. 2004; 2(6):e176. [PubMed: 15208723] Makeig S, Westerfield M, Jung TP, Enghoff S, Townsend J, Courchesne E, et al. Dynamic brain sources of visual evoked responses. Science. 2002; 295(5555):690–694. [PubMed: 11809976] Mangun GR, Buonocore MH, Girelli M, Jha AP. ERP and fMRI measures of visual spatial selective attention. Human Brain Mapping. 1998; 6(5-6):383–389. [PubMed: 9788077]
J Cogn Neurosci. Author manuscript; available in PMC 2011 May 11.
Karns and Knight
Page 15
NIH-PA Author Manuscript NIH-PA Author Manuscript NIH-PA Author Manuscript
Mehta AD, Ulbert I, Schroeder CE. Intermodal selective attention in monkeys. I: distribution and timing of effects across visual areas. Cerebral Cortex. 2000a; 10(4):343–358. [PubMed: 10769247] Mehta AD, Ulbert I, Schroeder CE. Intermodal selective attention in monkeys. II: physiological mechanisms of modulation. Cerebral Cortex. 2000b; 10(4):359–370. [PubMed: 10769248] Michie PT, Bearpark HM, Crawford JM, Glue LC. The effects of spatial selective attention on the somatosensory event-related potential. Psychophysiology. 1987; 24(4):449–463. [PubMed: 3615757] Min BK, Busch NA, Debener S, Kranczioch C, Hanslmayr S, Engel AK, et al. The best of both worlds: Phase-reset of human EEG alpha activity and additive power contribute to ERP generation. International Journal of Psychophysiology. 2007 Min BK, Herrmann CS. Prestimulus EEG alpha activity reflects prestimulus top-down processing. Neuroscience Letters. 2007; 422(2):131–135. [PubMed: 17611028] Narici L, Carozzo S, Lopez L, Ogliastro C, Sannita WG. Phase-locked oscillatory approximately 15to 30-Hz response to transient visual contrast stimulation: neuromagnetic evidence for cortical origin in humans. Neuroimage. 2003; 19(3):950–958. [PubMed: 12880823] Noesselt T, Hillyard SA, Woldorff MG, Schoenfeld A, Hagner T, Jäncke L, et al. Delayed striate cortical activation during spatial attention. Neuron. 2002; 35(3):575–587. [PubMed: 12165478] Ogden TE. The oscillatory waves of the primate electroretinogram. Vision Research. 1973; 13(6): 1059–1074. [PubMed: 4197416] Pantev C, Makeig S, Hoke M, Galambos R, Hampson S, Gallen C. Human auditory evoked gammaband magnetic fields. Proceedings of the National Academy of Sciences U S A. 1991; 88(20): 8996–9000. Proverbio AM, Del Zotto M, Zani A. Inter-individual differences in the polarity of early visual responses and attention effects. Neuroscience Letters. 2007; 419(2):131–136. [PubMed: 17490815] Sannita WG. Stimulus-specific oscillatory responses of the brain: a time/frequency-related coding process. Clinical Neurophysiology. 2000; 111(4):565–583. [PubMed: 10727907] Schroeder CE, Mehta AD, Foxe JJ. Determinants and mechanisms of attentional modulation of neural processing. Frontiers in Bioscience. 2001; 6:D672–684. [PubMed: 11333209] Sokolov A, Pavlova M, Lutzenberger W, Birbaumer N. Reciprocal modulation of neuromagnetic induced gamma activity by attention in the human visual and auditory cortex. Neuroimage. 2004; 22(2):521–529. [PubMed: 15193580] Sukov W, Barth DS. Cellular mechanisms of thalamically evoked gamma oscillations in auditory cortex. Journal of Neurophysiology. 2001; 85(3):1235–1245. [PubMed: 11247992] Talsma D, Kok A. Nonspatial intermodal selective attention is mediated by sensory brain areas: evidence from event-related potentials. Psychophysiology. 2001; 38(5):736–751. [PubMed: 11577897] Talsma D, Kok A. Intermodal spatial attention differs between vision and audition: an event-related potential analysis. Psychophysiology. 2002; 39(6):689–706. [PubMed: 12462498] Tiitinen H, Sinkkonen J, Reinikainen K, Alho K, Lavikainen J, Näätänen R. Selective attention enhances the auditory 40-Hz transient response in humans. Nature. 1993; 364(6432):59–60. [PubMed: 8316297] Tournev I, Kalaydjieva L, Youl B, Ishpekova B, Guergueltcheva V, Kamenov O, et al. Congenital cataracts facial dysmorphism neuropathy syndrome, a novel complex genetic disease in Balkan Gypsies: clinical and electrophysiological observations. Annals of Neurology. 1999; 45(6):742– 750. [PubMed: 10360766] Vroomen J, Keetels M. The spatial constraint in intersensory pairing: no role in temporal ventriloquism. Journal of Experimental Psychology Human Perception and Performance. 2006; 32(4):1063–1071. [PubMed: 16846297] Whittaker SG, Siegfried JB. Origin of wavelets in the visual evoked potential. Electroencephalography and Clinical Neurophysiology. 1983; 55(1):91–101. [PubMed: 6185307]
J Cogn Neurosci. Author manuscript; available in PMC 2011 May 11.
Karns and Knight
Page 16
NIH-PA Author Manuscript
Woldorff MG, Gallen CC, Hampson SA, Hillyard SA, Pantev C, Sobel D, et al. Modulation of early sensory processing in human auditory cortex during auditory selective attention. Proceedings of the National Academy of Sciences U S A. 1993; 90(18):8722–8726. Woodruff PW, Benson RR, Bandettini PA, Kwong KK, Howard RJ, Talavage T, et al. Modulation of auditory and visual cortex by selective attention is modality-dependent. Neuroreport. 1996; 7(12): 1909–1913. [PubMed: 8905690] Woods DL, Alain C, Covarrubias D, Zaidel O. Middle latency auditory evoked potentials to tones of different frequency. Hearing Research. 1995; 85(1-2):69–75. [PubMed: 7559180] Woods DL, Alho K, Algazi A. Intermodal selective attention: evidence for processing in tonotopic auditory fields. Psychophysiology. 1993; 30(3):287–295. [PubMed: 8497558]
NIH-PA Author Manuscript NIH-PA Author Manuscript J Cogn Neurosci. Author manuscript; available in PMC 2011 May 11.
Karns and Knight
Page 17
NIH-PA Author Manuscript NIH-PA Author Manuscript
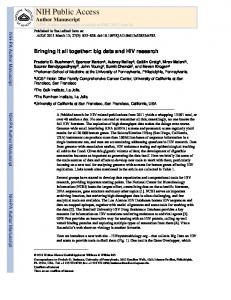
Figure 1.
Schematic Diagram of Experimental Apparatus. A) Auditory, vibrotactile, and visual stimuli were spatially coregistered to the left or right of fixation and participants responded to targets with the opposite hand. The stimulated hand was placed behind a sound permeable screen onto which visual stimuli were flashed via a DLP projector. B) The visual stimuli, speaker, and vibration device were aligned in azimuth and elevation. Stimulus waveforms for the auditory and tactile modalities are shown in the legend.
NIH-PA Author Manuscript J Cogn Neurosci. Author manuscript; available in PMC 2011 May 11.
Karns and Knight
Page 18
NIH-PA Author Manuscript NIH-PA Author Manuscript
Figure 2.
Electrode Groups. Electrodes groups were defined surrounding electrodes of interest for each component. Electrode groups on the midline are labeled according to the first letter of the center electrode (e.g. FZ → F). Electrode groups contralateral to the side of stimulation are indicated with a “c”.
NIH-PA Author Manuscript J Cogn Neurosci. Author manuscript; available in PMC 2011 May 11.
Karns and Knight
Page 19
NIH-PA Author Manuscript
Figure 3.
Intermodal Attention Effect on Visual ERPs. A) ERPs in response to visual stimuli when the visual modality is attended (Red) or not attended (Blue) are shown in two midline electrode groups (C and P) and two posterior-lateral electrode groups (P-i, ipsilateral to stimulation and P10-c, contralateral). The difference wave between attended and unattended visual ERPs is overlaid (Black). The C1 and N1 were modulated with visual attention (p < 0.05) with a 100 ms baseline; the C1, P1 and N1 modulation were significant with a 50 ms baseline. B) A posterior view of the scalp topographies of the attention effects (Attend – Unattend) are shown at the latencies of the C1, P1, and N1. Smaller insets show the topography of each component of the average ERP across all visual stimuli (attended and unattended).
NIH-PA Author Manuscript NIH-PA Author Manuscript J Cogn Neurosci. Author manuscript; available in PMC 2011 May 11.
Karns and Knight
Page 20
NIH-PA Author Manuscript NIH-PA Author Manuscript NIH-PA Author Manuscript
Figure 4.
Intermodal Attention Effect on Auditory ERPs. A) ERPs in response to auditory stimuli when the auditory modality is attended (Red) or not attended (Blue) are shown in two midline electrode groups at frontal (F) and central (C) sites. The difference wave between attended and unattended auditory ERPs is overlaid (Black). The inset of group F emphasizes the modulation of the Na and P1 with attention (p < 0.05). B) Scalp topographies of the attention effect (Attend – Unattend) are shown at the latency of the Na and P1. The top row depicts the scalp contralateral to the side of stimulation, the bottom, ipsilateral. Smaller insets show the topography for the average ERP across all auditory stimuli (attended and unattended).
J Cogn Neurosci. Author manuscript; available in PMC 2011 May 11.
Karns and Knight
Page 21
NIH-PA Author Manuscript NIH-PA Author Manuscript
Figure 5.
Intermodal Attention effect on Vibrotactile ERPs. A) ERPs in response to vibrotactile stimuli when the tactile modality is attended (Red) or not attended (Blue) are shown in two midline electrodes, frontocentral (FC) and posterior (P) and two frontal-lateral electrodes (FC-i, ipsilateral to stimulation and FC-c, contralateral). The difference wave between attended and unattented is overlaid (Black). The first significant effect with attention was at the latency of the N160 (p < 0.05) in electrode group FC-c. B) Scalp topographies of the attention effect (Attend – Unattend) are shown at the latency of the N160. The smaller insets show the topography of the N160 across all vibrotactile stimuli (attended and unattended).
NIH-PA Author Manuscript J Cogn Neurosci. Author manuscript; available in PMC 2011 May 11.
Karns and Knight
Page 22
NIH-PA Author Manuscript NIH-PA Author Manuscript NIH-PA Author Manuscript
Figure 6.
Intermodal attention effects on gamma band oscillatory responses (GBRs). The left panel shows the ERSP images of the difference between attended and unattended ERSPs in the gamma band for visual (top panel), auditory (middle panel), and vibrotactile (bottom panel) stimuli averaged for channels indicated in white (at right). Outermost contours indicate a significant difference between attended and unattended (p < 0.05 one-tailed, inner contours are drawn at intervals decreasing by 0.01). The plot below each ERSP image shows the average power within the frequency range of the attention effect over time. Green lines indicate the on- and offset of significance. Attention effects in the gamma band onset at 47 ms for the visual modality, 57 ms for the auditory modality, and 27 ms for the vibrotactile J Cogn Neurosci. Author manuscript; available in PMC 2011 May 11.
Karns and Knight
Page 23
modality. The right panel shows the scalp topographies of the significant gamma band attention effect.
NIH-PA Author Manuscript NIH-PA Author Manuscript NIH-PA Author Manuscript J Cogn Neurosci. Author manuscript; available in PMC 2011 May 11.
NIH-PA Author Manuscript
False Alarm Rate (%)
Hit Rate (%)
Response Time (ms)
0.44
EqStim
3.9 0.53
EqStim EqResp
4.0
1.2
EqStm EqResp
0.8
87.8
EqResp
EqStim
484 86.9
EqStim EqResp
503
Mean
0.08
0.09
0.2
0.2
0.2
0.2
3.2
3.1
18
18
SEM
Auditory (A)
EqResp
SEM = standard error of the mean.
Criterion c
d0
NIH-PA Author Manuscript Table 1
0.26
0.32
4.5
4.6
0.7
0.6
96.7
95.4
426
437
Mean
0.05
0.06
0.1
0.1
0.1
0.1
0.7
1.4
16
17
SEM
Visual (V)
0.50
0.41
4.4
4.1
0.6
0.9
91.4
91.6
506
490
Mean
0.09
0.08
0.2
0.1
0.2
0.2
2.8
2.8
17
15
SEM
Vibrotactile (T)
NIH-PA Author Manuscript
Behavioral differences for Auditory, Vibrotactile, and Visual Intermodal Attention Karns and Knight Page 24
J Cogn Neurosci. Author manuscript; available in PMC 2011 May 11.
NIH-PA Author Manuscript
P-c
N1
FC
C
P1
N1
FC-c
FC
FC-c
P80
P100
N160
135–195
80–120
75–95
40–50
138–158
85–95
24–34
166–186
110–130
0.30 0.32
−0.45
0.15
−0.33
0.50
0.31
0.26
0.30
0.15
−0.33
0.16
0.73
−0.70
0.57
0.41
−0.25
−2.1
0.34
−0.57
0.31
0.39
−0.86
0.23
0.37
−0.96
Mean Difference (>μV)
−1.73
0.73
0.25
−1.18
.049*
ns∼
ns∼
ns∼
ns∼
.024*
−2.01 0.11
.003**
.002**
ns∼
ns∼
.033*
.012*
.003**
p-value (one-tailed)
−3.10
−3.90
0.41
−0.85
−1.94
−2.45
−3.08
t(20)
J Cogn Neurosci. Author manuscript; available in PMC 2011 May 11.
ns∼ = p > .10.
p < .01.
**
p < .05.
*
SEM = standard error of the mean.
The mean difference between attended and unattended amplitudes within a window surrounding the grand average peaks was compared to zero.
P
N40
(C)Vibrotactile
F
Na
(B)Auditory
P-c
72–82
P-c
P1
72–82
CP
C1-late
62–72
CP
C1-early
67–77
Latency (msec)
CP
Electrode
C1
(A)Visual
Component
SEM
NIH-PA Author Manuscript Table 2
NIH-PA Author Manuscript
Intermodal Attention Effects on ERP Components Karns and Knight Page 25