Robert F. Bulleit, Hong Cui, Jiancheng Wang, and Xi Lin. Department of .... 1988a; Hatten et al., 1988; Kingsbury et al., 1989; Messer, 1989;. Gao et al., 199 1; ...
The Journal
of Neuroscience,
NMDA Receptor Activation in Differentiating Cerebellar Regulates the Expression of a New POU Gene, Cm-1 Robert
F. Bulleit,
Department
Hong Cui, Jiancheng
of Pharmacology,
Wang,
March
1994,
U(3):
1584-I
595
Cell Cultures
and Xi Lin
University of Maryland School of Medicine, Baltimore, Maryland 21201
POUlhomeobox genes encode transcription regulatory proteins that are important in defining cellular phenotypes. Expression of these genes may be critical for to the regulation of CNS cellular differentiation. We have identified a cDNA corresponding to a new member of the POU/homeobox gene family. Expression of RNA encoded by this new gene occurs predominantly in the CNS. Thus, this new gene was designated Cns- 7. Cns- 7 transcripts are expressed in differentiating cells cultured from the early postnatal cerebellum. Treatment of these cultured cells with NMDA results, in an increase in the level of Cns- 7 RNA. This increase is blocked by simultaneous treatment with the specific NMDA receptor antagonist amino&phosphonovaleric acid. Continued activation of the NMDA receptor allows maintenance of this new steady state level of Cns-7 mRNA for at least 5 d in these cultured cells. A transcription runoff assay suggests that this increase in the level of RNA is due, at least in part, to an increase in transcription from the Cns-7 gene. The NMDA-induced increase in Cns-7 mRNA was reduced by pretreatment with calcium chelators EGTA or 1,2-bis(2-aminophenoxy)ethane-N,f+!,,N,N-tetraacetic acid (BAPTA) tetrakis(acetoxymethyl). These studies suggest that specific activation of the NMDA receptor in cultures of differentiating cerebellar cells increases Cns-7 gene expression and that calcium entry through the NMDA channel may be required for this response. This change in Cns-7 expression may modify phenotypic characteristics of these cultured cells. [Key words: NMDA receptor, CNS development, RNA, gene expression, POU gene, cerebellar cell culture]
The mammalian CNS contains a precisely integrated network of many distinct cellular phenotypes.During CNS development thesediverse cell types arise from multipotent precursor cells present in the neural tube. Clonal analysis of CNS precursors suggeststhat, even up to their final cell division, an individual precursorcangive rise to multiple cell types (Turner and Cepko, 1987; Luskin et al., 1988; Wetts and Fraser, 1988; Walsh and Cepko, 1992). It is likely that the specificationof individual cell Received Apr. 5, 1993; revised Aug. 20, 1993; accepted Aug. 26, 1993. We thank A. L. Joyner for providing the En-2 cDNA, W. Herr for providing the Ott-1 cDNA, and D. R. Burt for providing the mouse brain XgtlO cDNA library. We thank P. Yarowsky, D. Burt, and B. Krueger for helpful comments on the manuscript. This work was supported by National Institutes of Health grant NS29792 to R.F.B. and the Frank C. Bressler Fund of the University of Maryland. Correspondence should be addressed to Dr. Robert F. Bulleit, Department of Pharmacology, University of Maryland School of Medicine, 655 West Baltimore Street, RM 4-018, Baltimore, MD 21201. Copyright 0 1994 Society for Neuroscience 0270-6474/94/141584-12$05.00/O
fatesrequireslocal interactions involving environmental signals (Kessler, 1986; Adler and Hatlee, 1989; Iacovitti et al., 1989; McConnell and Kaznowski, 1991). Theseinstructive signalsdirect the expressionof specificgenesthat are ultimately responsible for defining particular cell fates. Homeobox genesmay be important componentsin this process.Thesegenesencodetranscription regulatory proteins that are likely to function in combination with other transcription factors to specify individual CNS cellular phenotypes(He and Rosenfeld, 1991). Homeobox geneshave beenwell characterized in invertebrates, where their protein products function as key regulators of transcription involved in controlling development and defining cellular phenotypes (Akam, 1987; Scott and Carroll, 1987; Doe et al., 1988a,b; Finney et al., 1988; Ingham, 1988; Way and Chalfie, 1989). In mammals,the expressionof homeobox genesoccurs in both CNS precursorsand mature CNS cell populations. The Hox genes(Kesseland Gruss, 1990) several POU/homeobox genes(He et al., 1989), Pax-3 (Goulding et al., 1991), Tes-I (Porteus et al., 1991) and Nkx-2.2 (Price et al., 1992) are expressedin cells within spatially restricted regions of the developing neural tube. In the adult nervous systemHox 1.3 and the POU/homeobox genesBrn-I, Brn-2, Tst-I, Ott-I, and Ott-2 are expressedin distinct but overlapping populations of mature CNS cells (Odenwald et al., 1987; He et al., 1989). This distinct distribution of gene expressionsuggeststhat homeobox genes may also regulate the differentiation of individual mammalian CNS cellular phenotypes. In the developing CNS instructive signalsmay define individual cellular phenotypesthrough control of the expressionof particular homeobox genes.Cells cultured from the early postnatal cerebellum may provide a useful system for studying the effect of instructive signalson the differentiation ofan individual CNS neuronal phenotype. These postnatal cerebellar cultures contain cerebellar granule neurons and their precursors,other cerebellar interneurons, and cerebellar glia (Trenkner, 1991). Someaspectsof the development and differentiation of granule neuronsoccur in these postnatal cerebellarcultures and can be modified by the addition of extracellular factors (Balazs et al., 1988a;Hatten et al., 1988;Kingsbury et al., 1989;Messer, 1989; Gao et al., 1991; Trenkner, 1991). We are interested in learning whether conditions that modify differentiation ofthese cellsalso alter expressionof identified homeobox genes.Several studies report that activation of NMDA receptorsin cultured cerebellar granule neurons can modify neurite outgrowth (Pearce et al., 1987; Cambray-Deakin and Burgoyne, 1992) survival (Balbzs et al., 1988a,b), differentiation (Moran and Patel, 1989; Cox et al., 1990), and migration (Komuro and Rakic, 1992) of these cells.NMDA receptor activation alsoappearsto mediatetrophic
The Journal of Neuroscience,
responses in other CNS neurons and may regulate activity-dependent development of certain populations of CNS neurons (Kleinschmidt et al., 1987; Lipton and Kater, 1989; Scherer and Udin, 1989; Cline and Constantine-Paton, 1990; Kalb and Hockfield, 1990; Cline, 199 1; Simon et al., 1992). Studies have also shown that spontaneously active NMDA receptors are present in the early developing CNS (Blanton et al., 1990; Lo Turco et al., 199 1; Kalb et al., 1992). One mechanism by which NMDA receptor activation could control these developmental events is through the regulation of expression of particular homeobox genes. In the present study we have identified a new member of the POU/homeobox gene family, Cm- I. Cm- 1 is expressed in cells cultured from the early postnatal cerebellum. Activation of NMDA receptors in these cultured cells results in a specific increase in the level of Cm-1 mRNA. An increase in the level of transcription from the Cm-1 gene appears, at least in part, responsible for this increase in the level of Cns-I mRNA. These experiments suggest that NMDA receptor activation in developing cells of the CNS can alter homeobox gene expression. This change in homeobox gene expression may ultimately modify the phenotypic properties of these cells.
Materials and Methods Identification of POWhomeobox sequences by PCR. Total RNA was prepared from adult mouse cerebella using previously described methods (Chomczynski and Sacchi, 1987). PolyA+ RNA was isolated by chromatography on oligo-dT cellulose as described by Sambrook et al. (1989). We synthesized the first strand of cDNAs using polyA+ RNA primed with random hexamers and Moloney murine leukemia virus reverse transcriptase (U.S. Biochemicals, Cleveland, OH). Amplification by the polymerase chain reaction (PCR) was accomplished by the addition of polymerase buffer (50 mM KCl, 20 mM Tris pH 8.4, 2.5 mM M&l,, and- 160 &ml BSA), dNTPs, primers, and Taq DNA polymerase (U.S. Biochemicals) to the cDNA. The cycling progression involved denaturation for 2 min at 94°C primer annealing for 2 min at 58°C and primer extension for 3 min at 72°C. We repeated this cycling uroeression 35 times with the last 72°C incubation lasting 15 min. The primers used for PCR were degenerate oligonucleotides representing all possible codons for two regions of conserved amino acid sequence in eight POU/homeodomain proteins (He et al., 1989). The upstream primer was from a conserved region in the POU-B domain, T/S-T-IC/S-R-F-E, and the downstream primer was from a conserved region in the homeodomain, V-I/V-R-V-W-F-C-N (see Fig. 2). We had the upstream primer synthesized with a 5’ EcoRI restriction site and the downstream primer with a 5’ XbaI restriction site. Following PCR amplification DNA products were separated on a 1% agarose gel and stained with ethidium bromide. The DNA bands migrating to a position corresponding to 320-350 base pairs (bp) (expected size of POU/homeobox sequences based on the position of the primers) were purified as a single pool. We digested this DNA with EcoRI and XbaI, and ligated into the EcoRI-XbaI sites of the pGEM7Z vector. This DNA was used to transform Escherichia co/i. Individual clones were isolated and the plasmid DNA purified for DNA sequence analysis (Sanger et al., 1977). Isolation of Cns-1 cDNAs. We synthesized a random-primed DNA probe from the PCR clone PCRPH3. This probe was used to screen an amplified adult C57Bl/6J mouse brain XgtlO cDNA library (obtained from D. R. Burt, University of Maryland School of Medicine). We transferred 6 x 10s recombinants from this library to nitrocellulose filters by standard procedures (Sambrook et al., 1989). Filters were prehybridized for 2-4 hr at 42°C in H buffer containing 5.6~ SSPE (0.84 M NaCl, 64 mM Na,PO,, 6 mM EDTA), 50% formamide, 5~ Denhardt’s solution (0.1% ficoll, 0.1% polyvinylpyrrolidone, 0.1% bovine serum albumin), 1% SDS, and 200 pg/rnl tRNA. We preformed hybridizations in H buffer containing l-3 x lo6 cpm/ml of PCRPHS orobe fsnecific activitv of l-2 x lo9 cornlug) for.48 hr at 42°C. Filters were washed under high-stringency conditions [O. 1 x SSC (15 mM NaCl, 1.5 mM sodium citrate), 1% SDS at 65”C] and exposed to Kodak RP x-ray film. We purified 10 positive clones and determined the cDNA insert size by restriction enzyme analysis. The longest clone (PH3,1-2)
March
1994, 74(3)
1585
contained an insert of -4.6 kilobases (kb). The insert was subcloned into the plasmid pBluescript (Stratagene, La Jolla, CA) for restriction mapping and sequence analysis. We generated subclones for sequence analysis by restriction enzyme and exonuclease III digestion (Henikoff, 1984). We used double-stranded plasmid DNA for sequence analysis of both DNA strands (Sanger et al., 1977). The GenBank accession number for the Cns-I cDNA sequence is L13763. Cell cultures from the early postnatal cerebellum. Cells from the cerebellum of postnatal day 7 (P7) CD-l mice were dissociated into a single-cell suspension by previously described methods (Kingsbury et al., 1989); l-2 x 10’ cells were plated on 35 mm netri dishes in a chemically defined medium composed of minimal essential medium (without glutamic acid and glycine) containing 6 m&ml glucose, 10 ~Lgl ml bovine serum albumin (Sigma, St. Louis, MO), 200 fig/ml human transferrin (Sigma), 32 fig/ml putrescine (Sigma), 10 &ml sodium selenite (Sigma), 10 bg/rnl insulin (Sigma), 1.25 &ml progesterone (Sigma), 20 t&ml triiodothyronine (Sigma), 4 rig/ml corticosterone (Sigma), 2 mM glutamine (Sigma), and 100 &ml gentamicin (GIBCO/Bethesda Research Labs, Gaithersburg, MD). This medium allows extended survival of cultured neurons without NMDA or depolarizing concentrations of KC1 (Cox et al., 1990). The cultures were maintained for 24 hr at 37°C in 5% COz. Under these conditions the cells formed large aggregates with bundles of interconnecting cell processes similar to cerebellar cultures describes previously (Trenkner, 1991). After 24 hr of culture we added KC1 to each culture to bring the final concentration to 10 mM. Cultures were then treated with 10 PM glycine (Sigma), 20 FM 6-cyano-7-nitroquinoxaline-2,3-dione (CNOX: Cambridae Research Biochemicals), 100 PM amino-5-phosphonbvaleric acid?APV; Sigma), 0.1-200 PM N-methyl-D-aspartate (NMDA; Sigma), 10 PM y-aminobutyric acid (GABA; Sigma), 10 PM somatostatin (Calbiochem, San Diego, CA), and/or basic fibroblast growth factor (Calbiochem). We added these compounds directly to the culture medium. Incubation of cultures was continued for O-24 hr at 37°C in 5% CO,. We treated some cultures containing 10 mM KC1 and 10 FM glycine for 2 hr with 4 or 8 mM MgSO,, 1.5 or 2.5 mM ethylene glycol-his@-aminoethyl ether) N, N, N’, N’,-tetraacetic acid (EGTA; Sigma) or 20 FM 1,2-bis(2-aminophenoxy)ethane-N, N, N’, N’-tetraacetic acid (BAPTA) tetrakis(acetoxymethy1) ester (Molecular Probes, Eugene, OR). We added NMDA (50 PM) directly to the culture medium following pretreatment of cells with Mg*+ or EGTA. After BAPTA pretreatment we removed the BAPTA-containing medium from cells and replaced with the fresh chemically defined medium, minus BAPTA, containing 50 PM NMDA. These cultures were then incubated for an additional 24 hr. The viability of cultured cells following these various treatment conditions was determined by trypan blue exclusion. Cells are loosely attach to the petri dish and can be removed and dissociated by trituration through a Dinette tip. After dissociation, cell viability was determine by incubating-cells in 0.08% trypan blue in PBS. Cells that excluded the dye and those that incorporated the dye were counted using a hemocytometer. Viability was expressed as the percentage of total cells that excluded the dye. RNA blot analysis. We prepared total RNA from adult mouse tissues or from cultured cells using previously described methods (Chomczynski and Sacchi, 1987). We separated total RNA (20 pg) from individual adult tissues or cultured cells by formaldehyde agarose gel electrophoresis (Sambrook et al., 1989). The gels were stained with ethidium bromide and the RNA visualized under UV light to confirm that similar amounts of RNA were loaded in each lane of the gel. We transferred the RNA to nylon membranes (Stratagene, La Jolla, CA) by standard capillary transfer (Sambrook et al., 1989). RNA was cross-linked to membranes using a UV cross-linker (Stratagene, La Jolla, CA). We hybridized RNA blots with a cDNA probe synthesized bv random oriming from a 3.7 kb EcoRI-Hind111 fragment of PH3,1-2. RNA blots were prehybridized for 2-4 hr at 42°C in H buffer (as described above). Hybridization was accomplished in H buffer containing l-3 x lo6 cpm/ ml of probe (specific activity of l-2 x 10’ cpm/pg) for 48-72 hr at 42°C. Blots were washed under high-stringency conditions (0.1 x SSC, 1% SDS at 65°C) and exposed to Kodak AR x-ray film for l-3 d. After x-ray film exposure the probe was removed from blots by incubation in 25 mM Tris pH 7.5, 0.5 x Denhardt’s (0.0 1% ficoll, 0.0 1% polyvinylpyrrolidone, 0.01% BSA), 0.1% SDS for 30 min at 85°C. We hybridized the same blots under conditions described above with a probe synthesized from a 3 kb EcoRI fragment of an En-2 cDNA obtained from A. L. Joyner, Mt. Sinai Hospital Research Institute, University ofToronto. Probes synthesized from other cDNAs were also used to rehybridize blots:, an Ott-1 cDNA was obtained from W. Herr, Cold Spring Harbor
1588
Bulleit
et al. * NMDA
Regulates
Expression
of POU
Gene
Cm-7
CCA GTT
ATT
ACC AAC ACC ATT
Met CCC AGC ATG
Leu Thr Asn CTC ACG AAT
Ala GCT
Gln Gly Gln Val CAG GGA CAG GTT
Ile ATT
1
1 6 53
C ACT Ser AGT
ACA
Gln Ile CAG ATC
GCT
Pro Gly Ile CCC GGG ATC
Gly Ala Leu GGA GCA CTT
Ser AGC
Pro Trp Val CCG TGG GTA
24 107
Val Asn GTG AAC
Ser TCA
Ala Ser Val Ala Thr GCT AGC GTG GCC ACA
Pro Ala Pro Ala Gln Ser LeU Gln Val Gln CCA GCA CCG GCA CAG AGC CTG CAG GTC CAA
42 161
Ala Val GCC GTG
Thr ACT
Pro Gln Leu Leu CCC CAG CTC TTG
Asn
Ala
Gln
Gly
Gln
Val
AAT
GCC
CAG
GGC
CAG
GTG
60 215
Ala Ser Ser Pro Leu GCC AGC AGC CCC CTG
Pro Gln Pro Val Ala Val Arg Lys CCT CAG CCT GTG GCT GTC AGG AAG
Pro Glu Pro Asn Thr -7 CCA AAC ACA CCG GAG
78 269
Ser TCC
Pro Ala Lys CCT GCT AAG
Ser AGT
Gln Pro Ile Glu Val GAG GTG CAG CCT ATC
Gln Ala Val Pro Gln SER,THR, PRO richdomain CAA GCC GTG CCC CAG
96 323
Pro CCT
Ala Val GCA GTA
Ser Pro Thr Pro Ala Leu Lys Leu Thr CTC ACC AGC CCA ACG CCA GCG CTC AAG
Pro Ser Ala Ala Thr CCG TCA GCT GCA ACT
114 377
Pro Ile CCC ATC
Thr Cys ACC TGC
132 431
Pro His Thr Pro Ser ICCG CAC ACC CCA AGT
150 485
Phe TTT
168 539
Val Gly Gln Ala Leu GTG GGC CAG GCT TTG
Thr Ala Thr ACG GCG ACA
Glu Gly Pro Ala Tyr GAA GGG CCG GCC TAC
186 593
Cys TGC
Arg Phe AGG TTT
Leu TTG
Thr ACA
204 647
Val GTT
Leu TTG
222 701
Asn AAC
Leu Met CTG ATG
240 755
Ser Phe TCC TTC
258 809
Leu CTG
276 863
Glu Val GAG GTG
294 917
Lys AAG
Ala GCT
Ile ATC
Pro Ile CCA ATC
Lys Asn AAG AAT
Glu Lys GAG AAA
Glu Lys GAA AAG
Thr ACA
Phe TTT
Glu Phe GAG TTC
Leu Asn CTG AAC
Gln Leu CAG TTG
Val GTA
Ser Lys TCA AAG
Leu Asp CTG GAT
Glu Asp Gly Ile GAG GAC GGG ATC
Asn AAC
Leu TTA
Glu Glu Ile GAA GAG ATC
Arg Glu CGG GAG
Lys Ile AAG ATC
Arg Arg Leu Ser Leu CGG CGG CTC TCC CTG
Gly GGT
Leu Thr Gln Thr Gln CTG ACA CAG ACC CAG
Val GTG
I
Asp Ile GAC ATC Met ATG
Arg Val Trp AGG GTC TGG Phe TTT
Pro Lys CCC AAG
Phe TTC
Gin Ile CAG ATC
Ser Gln Ser AGC CAA TCA
Ser Ala Gln Lys AGC GCC CAG AAG
Ala Ile GCC ATC
Leu Lys CTG AAG
mu-soecific do&s
Pro CCG
Glu Ala Glu Leu Arg Asn Gln Glu Gly Gln Gln GAG GCA GAG CTC CGC AAC! CAG GAA GGC CAG CAG
Gly Gly Glu Pro Ser GGC GGC GAG CCC TCC
Pro Gln Ala Ile CCG CAG GCC ATA
Val GTC
Ala Thr Leu GCA ACC CTA
Ser AGT
Pro Thr Gly Gln Glu Ile CCC ACC GGC CAG GAG ATC Val GTG
Gln Pro Thr CAG CCG ACA
Ile ATC
Glu Thr Pro Thr Val GAG ACC CCA ACC GTC
Trp Leu TGG TTG
Ser TCA
Leu TTG
Glu Ala Leu Asn GAG GCT CTC AAT Thr Glu Ile ACG GAG ATC Cys TGT
Asn AAT
Pro CCG TAG
Lys AAG
Lys AAA
Ala Tyr GCC TAC
Ala Lys GCC AAG
Arg Lys Arg Arg Thr CGC AAG CGG CGC ACT Phe TTT
Glu Lys GAG AAA
Asn Pro AAC CCC
Glu Leu Asn Tyr GAG CTC AAC TAC
Asp Arg GAC CGG
Arg Arg Gln Thr CGA CGC CAG ACA
Leu Lys Asn Thr Ser CTG AAG AAC ACC AGC
GGC TCA
GCG TGT
GTG
TCA
Homeodomain
GCC GGC GCA
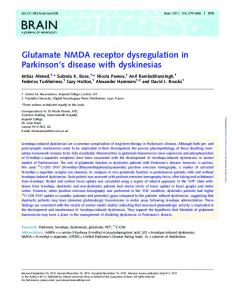
Figure 1. Part of the nucleotide sequence of the Cm-1 cDNA is presented along with the predicted amino acid sequence of the Cns-1 protein. The open reading frame begins with an ATG that is consistent with Kozak’s criteria for an initiation codon (Kozak, 1986, 1991). The predicted amino acid sequence of Cns-1 contains a POU-specific domain, a homeodomain, and a domain rich in serine, threonine, and proline residues. These domains are shown by the boxed sequences. The GenBank accession number for the Cns-I cDNA sequence is L13763.
Laboratory; SCIP/Tst-1 and Cer-1 cDNAs were isolated in our laboratory (R. F. Bulleit, unpublished observations). Repeated stripping of probes from blots reduced subsequent hybridization signals so that film exposure times frequently increased and varied from 2 to 12 d. Each experiment using cultured cells was repeated at least two times and the results of RNA blot analysis were consistently replicated in repeated experiments. Nuclear runoftranscription assay. We measured transcriptional activity by isolating nuclei from cells (-3 x 10’ cells) cultured in the presence or absence of 50 PM NMDA or 100 FM APV. Cells were lysed in 10 mM Tris-HCl pH 7.4, 10 mM NaCl, 3 mM MgCl,, 5% NP40, and
nuclei were prepared as previously described (Greenberg and Ziff, 1984). In vitro nuclear transcription was carried out in the presence of ribonucleotides and j2P-UTP at 30°C for 30 min (Greenberg and Ziff, 1984). We isolated labeled RNA by methods described previously (Groudine et al., 198 1). Labeled transcripts produced in this manner were hybridized in 6 x SSC, 5 x Denhardt’s, 1% SDS, 200 pg/rnl tRNA at 65°C for 36-48 hr to DNA immobilized on nitrocellulose filters. We hybridized each filter with an equal number of cpm and washed filters under stringent conditions (0.1 x SSC, 1% SDS at 65°C). The filters were exposed to Kodak AR x-ray film for 5 d. Nitrocellulose filters were prepared using plasmid DNA (10 fig) linearized by restriction digestion and de-
The Journal
WV-SPECIFIC
act-1 act-2
II
pit-1
III
cfla brn-1 brn-2 brn-4 tst-1 ceh-6
DD--A---Q--
uric-86
RQ--T--EH---------v--A
IV
1994,
f4(3)
1587
LINKER
FWs-B
EELEQFAKTFKQRRIKLGFTQGDVGLAMGKLYGNDF...
NLSSDSSLSSPSALNSPGIEGLS.
SQTTISRFEALNLSFKNMCKLKPLLEKWLNDAE
TMSVDSSLPSPNQLSSPSLGFEPA
QVGALYNEKVGANE.......... SSTGSPTSIDKIAAQ......... STTGSPTSIDKIAAQ.........
----------A-----L-T----V-...--C----C-----Q-------------Q---EE-D
DD------Q------------A-----L-T----V-.*.-----C-----Q-------------Q---EE-D DD------Q------------A-------V-,,.-----C-----Q
SSSGSPTSIDKIAAQ.........
-------------Q---EE-D
SSTGSPTSIDKIAAQ.........
D-------Q------------A---L-T----V-,..-----C-----Q-------------N---EK-D
SSSGSPTNLDKIAAQ......... STTGSPNSTFEKMTGQA.......
DD------Q------------A---L-T--L-T----”-...-----c-----Q-------------Q---EETD DD--G---Q---------Y--A---L-T--L-T----*-...-----c-----Q
-------------Q---EE-D
---K-LAH-I(MPGVGSL--S--C---S-T--HN--VA---I-HS--EK-S-LAN-KIPGVGSL--S--C---S-T--HN--IA---I-QA--EE-K-LAN-KLPGVGAV--S--C---S-T--HN--IA---I-QA--EE--
i-pou
R---A--ER---------V--A--R---A--ER---------v--A---
V
act-314
K- ------LL--K--T--Y--A----TL-V-F-~-...
VI
ens-1
--IRS---N--I--LS--I.--TQ--Q-LTATE-PAY.... Helix A -
brn-3
March
DOMAIN
PQU,-A
I
of Neuroscience,
EAMKQKDTIGDINGILPNT..... GPQREKMNKPELFNG......... AQAKNKRRDPDAPSVLPA...... NNENLQEICKSETLVQA.......
-----C-----Q--L------R------VEE-D
LRNQEGQQNLHEFVGGEPS.....
--SA-C---K-DITP-SAQ----V-----~--
-
Helix
B -
HOMEOOOHAIN I
act-1
act-2 II
pit-1
III
cfla brn-1 brn-2 brn-4 tst-1 ceh-6
IV
.RRRKKRTSIETNIRVALEKSFLENQKPTSEEITMIADQLNMEKEVIRVWFCNRRQKEKR G------------V-F-------A---------LL--K--H------------------.-K--R--T-SIAAKD---RH-G-HS--S-Q--S-Q----EE--L----V---------R---
G-K--------VSVKG---QH-HKQP--SAQ---SL--S-QL----"------------G-K--------VSVKG---SH--KCP--S-9--S-Q---NL--S-QL----V------------G-K--------VSVKG---SH--KCP--SAQ---SL--S-QL----V------------G-K--------VSVKGV--TH--KCP--AAQ--SSL--S-QL----V------------G-K--------VGVKG---SH--KCP--SAH--SAH---GL--S-QL----V------------G-K--------V-VKSR--FH-QS----NAQ---QV-ME-QL----V-------------
brn-3
i-pou
.DKKR-----AAPEKRE--QF-KQQPR-SG-R-AS---R-DLK-N-V------Q---Q-GEKKR-----RAPEKRS--AY-AVQPR-S--K-RA--EK-DLK-N-V------Q---Q-GEKK..---AAPEKRS--AY-AVQPR-SG-K-AA--EK-DLK-N-V------Q---Q--
V
act-314
. . -KR------NRV-WS--TM--KCP--SLQQ--H--N--GL--D-V----------G--
VI
cm-1
.KK--R---FTPOAIE--NAY-EK-PL--GQ---E--KE--YDR--V---------SL-N
uric-86
-Helix
1-
-
Helix
2 -
- Helix
3 -
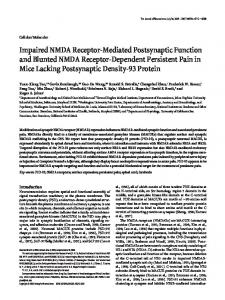
2. The predicted amino acid sequence of Cm-1 is similar to other POU/homeodomain proteins in the POU-specific domain and the homeodomain. All amino acid sequence information except that for Bm-4 and Cns- 1 was as reported by Rosenfeld (199 1) The amino acid sequence for Bm-4 was as reported by Le Moine and Young (1992). The amino acid sequence for Cns- 1 is as reported in this publication. The sequences are grouped into six classes based on relative sequence similarity. A dash indicates identity of amino acid sequence with Ott-1. The solid black bars identify the position of the sequences used in designing PCR primers. Regions with a-helical structure are indicated as Helix A and Helix B in the POU-specific domain and He/ix 1, 2, and 3 in the homeodomain.
Figure
natured in 0.2 M NaOH for 30 min at room temperature followed by neutralization in 10 vol of 6 x SSC. We immobilized the DNA on nitrocellulose filters using a slot blot apparatus (Bio-Rad, Richmond, CA). Filters were baked for 2 hr at 80°C. The plasmid DNAs used in these experiments included a plasmid containing a 3.7 kb fragment of the Cns-I cDNA, a plasmid containing a 3 kb fragment of the En-2 cDNA, and a control plasmid, pGEM 11 Z. Densitometry. Densitometry (Molecular Dynamics densitometer, Sunnyvale, CA) of exposed x-ray films was used to quantitate the hybridization signals on RNA blots hybridized with Cns-I and En-2 probes and in nuclear runoff transcription assays. Densitometric measurements (optical density, OD) were made on autoradiographs of RNA blots from three separate experiments in which cells were treated with glutamate receptor agonists of antagonists (see Fig. 4) or from three separate nuclear runoff transcription experiments (see Fig. 9). Background OD values were determined on each blot and subtracted from OD values for Cns- I and En-2 hybridization signals. We recorded the mean OD values * standard error of the mean for both Cns-1 and En-2 hybridization signals in RNA from cells treated under different conditions. Statistical analysis of the difference between the mean OD values for different treatment conditions was accomplished using a t test. We observed that
the level of the hybridization signal for En-2 RNA didn’t significantly change with any of the treatment conditions and was directly proportional to the level of 28s and 18s RNAs as visualized by ethidium staining of the RNA gels. Thus, En-2 can provide a reasonable measure of the relative amount of RNA on each blot.
Results
Isolation of Cm-1 cDNA clones Reverse transcription of cerebellar RNA in combination with the PCR allowed identification POU/homeobox genes expressed in the cerebellum. PCR was accomplished using degenerate oligonucleotide primers representing all possible codons for two conserved regions (Fig. 2). PCR amplification yielded DNA fragments within the expected size range based on the position of the two primers. These PCR products were subcloned and individual clones were isolated and sequenced. Several different POU/homeobox cDNA clones were identified using this PCR protocol. The deduced amino acid sequence of one of these
1588
Bulleit
et al. * NMDA
Regulates
Expression
of POU
Gene
Cm-1
half of Cns-1 is a region rich in serine, threonine, and proline residues(Fig. 1). This domain consistsof 25% serineand threonine residuesand 21% proline residues.Similar regionsrich in serineand threonine residuesare also present in the POUI homeodomain proteins Pit- 1 and Ott-2 (Ingraham et al., 1990; Tanaka and Herr, 1990).
28s
-
18s Figure 3. Cm-1 mRNA is expressed in the adult CNS. RNA was isolated from different adult brain regions and different adult tissues. Total RNA (20 pg) from each of the indicated brain regions or tissues was separated in a 1% formaldehyde agarose gel and transferred to a nylon membrane. The membrane was incubated with a random-primed DNA probe synthesized from a 3.7 kb fragment of the Cm-1 cDNA clone PH3,1-2. Probe hybridization and washing was accomplished as described in Materials and Methods. Following wash procedures, blots were exposed to Kodak AR x-ray film. Indicated on the left sidearethe positions of the 28s and 18s rRNAs.
Cns-1 is expressedin the CNS We examined the tissue distribution of Cm-1 mRNA. Total RNA was isolated from different adult brain regionsand other tissues.We did RNA blot analysis under high-stringency conditions using a DNA probe synthesizedfrom the Cns-I cDNA clone PH3,1-2. Under theseconditions the probe hybridized to an -5 kb transcript (Fig. 3). This transcript was present in all regions of the CNS examined (forebrain, midbrain, hindbrain, cerebellum, and spinal cord). We also observed hybridization to RNA of the samesize in RNA isolated from kidney tissue. We detectedonly faint hybridization signalsin the other tissues examined (heart, lung, liver, spleen,and intestine). Thus, Cns-1 mRNA is expressedpredominantly although not exclusively in the CNS. We have also observedthat Cns-I RNA is expressed in the developingpostnatalcerebellum(Pl-P2 1; data not shown). A comprehensive evaluation of the developmental expression of Cns-I in the CNS is currently under way.
Expression of Cns-1 is modulated by activation of NMDA receptorsin cells culturedfrom the early postnatal cerebellum Cultured establishedfrom the early postnatal cerebellum contain cerebellargranulecellsand their precursors,other cerebellar interneurons, and cerebellar glia (Trenkner, 1991). Cells were clones (PCRPH3) suggestedit encoded a new member of the cultured at high density in a chemically defined medium that allowsextended survival of thesecellswithout depolarizing conPOU/homeodomain protein family. We used a probe synthesized from the PCRPH3 clone to isolatefull-length cDNAs from centrations of KC1 (Cox et al., 1990). We cultured cells for 24 hr before the addition of glutamate receptor agonists and/or a mousebrain Xgt10 cDNA library. We isolated 10 clonesthat containedoverlappingrestriction maps.The largestclone(PH3,1antagonists. RNA blot analysis shows that Cns-1 mRNA is 2) contained an insert of -4.6 kb. Sequenceanalysis of this expressedin cultures under all treatment conditions (Fig. 4A). clone revealed an open reading frame beginning with an ATG The Cns-I probe hybridized to two different-sized transcripts (Fig. 4A). The smaller of the two RNAs was the samesize as that is consistent with Kozak’s criteria for an initiation codon (Kozak, 1986, 1991). The open reading frame is 903 basepairs the prominent Cns-I transcript observed in adult tissues(Fig. 3). This larger RNA was also observed in adult tissuesif blots long and encodesa 301 amino acid protein with a molecular weight of 32,850 (Fig. 1). This amino acid sequencecontains were exposedfor longer periods of time (data not shown).Since all of the RNA blots were washedat high stringency, this larger regions that are similar but not identical to the POU-specific RNA must be a transcript from a very closely related gene,a domain and the homeodomain of other POU/homeodomain proteins (Figs. 1, 2). We have designatedthis new sequence splicing variant of the Cns-I transcript or derived from the use Cns-1. of an alternate polyadenylation signal. An RNase protection experiment suggestedthat RNA from cultured cells could fully An amino acid sequencecomparisonof the POU-specific doprotect a 300 bp RNA fragment synthesized from the Cns-I main and the homeodomain of Cns-1 and 13 other POU/homcDNA. We observedno other partially protected fragments(data eodomain proteins is presentedin Figure 2. Cns-I is 48-57% not shown). This observation suggeststhat the observed tranidentical to the other POU/homeodomain proteins within the scripts on RNA blots are likely to be derived from the Cns-1 POU-specific domain and 43-52% identical within the homgene.However, further studiesare necessaryto determinewhich eodomain. The greatestsimilarity was observedbetweenCns-1 of several possibilitiesmight account for the larger transcript. and Pit-l, where there was 57% identity in the POU-specific The level of these Cns-I mRNAs changed in responseto domain and 52% identity in the homeodomain. Cns-1 and Pit- 1 treatment with NMDA receptor agonistsand antagonists.Treatalso have similar secondary structural features. Prediction of secondarystructure in Cns-1 (Chou and Fasman, 1978)suggests ment of cultures with glycine (10 PM), which potentiates agonist that within the POU-specific domain and the homeodomain responseat the NMDA receptor (Johnson and Ascher, 1987) there are five a-helical regions.In the POU-specific domain one or 20 PM CNQX, a non-NMDA glutamate receptor antagonist, helical domain residesin eachof the POU subdomains(POU-A did not result in a significant difference in the level of Cns-1 and POU-B) and three helical domains are presentin the homRNA when compared to control cultures (Fig. 4A, lanes l-3). eodomain (Fig. 2). The position of these helical domains is Treatment with 100 PM APV, a competitive antagonist at the similar to the position of predicted helicesin Pit-l (Ingraham NMDA receptor, appearedto reduced the level of Cns-1 RNA et al., 1990). We also observedthat within the amino-terminal when compared to treatment with 10 mM KC1 (Fig. 4A, lane
The Journal
T
B
m I 2
10
10 20
100 50
4
En-2
3
x
2
Q
1
mM KC1 PM Gly PM CNQX pM APV PM NMDA
+++++++ ++++++ +
+
+ \\
\
I
March
1994,
U(3)
1559
4). However, this differencewasnot statistically significantwhen averaging the resultsfrom three separateexperiments (Fig. 4A). Alternatively, treatment of cultures with 50 PM NMDA resulted in a significant increasein the level of Cm-1 mRNA (Fig. 4A, lane 5). Simultaneous addition of APV to cells treated with NMDA blocked the NMDA induced increasein the level of Cm-1 mRNA (Fig. 4A, lane 7). However, CNQX did not affect this increase(Fig. 4A, lane 6). A comparison of the mean OD measurementsfrom blots of three separateexperimentsshowed that treatment of cells with NMDA or NMDA plus CNQX resulted in a 2.8-3.3-fold increasein the level of Cm-1 mRNA when compared to APV-treated cultures and a 2.2-2.6-fold increase when compared to control cultures. These differences were statistically significant at p values < 0.03. We observeda similar increasein the level of the larger Cm-1 transcript following NMDA treatment. Treatment of thesecultures with 20 PM glutamate also resulted in an increasein the level of Cns-1 mRNA that was blocked by cotreatment with APV (data not shown). We remove the Cns-I probe from the blots and rehybridized the blots with a probe to the homeobox geneEn-2 to determine if the levels of other homeobox genetranscripts were also increasein responseto NMDA treatment. Densitometric measurementsof the En-2 hybridization signalsshowed that there was no significant change in the level of En-2 RNA following treatment with any of NMDA receptor agonistsor antagonists(Fig. 4B). Thus, NMDA treatment doesnot result in a generalincreasein the level of all homeobox genetranscripts. We also observed that the changesin the level of En-2 RNA were consistentwith changesin the level of RNAs as measured by absorbanceat 260 nm and visualization by ethidium staining of the RNA gels(Fig. 4C). Thus, the En-2 hybridization signal provides a measureof the relative amount of RNA in eachlane of the blot and suggeststhat the increasein Cns-I mRNA is not the result of differences in the level of total RNA on the blots. Examination of RNAs encoded by several other homeobox genessuggestedthat the levels of mRNA for thesegenes were, for the most part, not altered by treatment with NMDA (Fig. 5). RNAs encoding En-2, the POU/homeobox geneOct1, and a newly identified homeobox gene related to the Dro-
*
Cns-1
of Neuroscience,
+ I+/+/+
C
sophila paired gene, Cer-I (Bulleit,
unpublished
observations),
are expressedat similar levels under all treatment conditions (Fig. 5). The exception was RNA encoded by the POU/homeobox geneSUP (Monuki et al., 1989; also referred to as Tst-I or Ott-6), which alsoappearedto increasein responseto NMDA treatment, but to a lesserdegree than Cns-I mRNA. Thus, NMDA receptor activation specifically resultsin an increasein transcripts for the Cns- 1 geneand possiblythe SCIP/Tst- 1 gene. NMDA causeda dose-dependentincreasein the level of the Cns-I mRNA. We observed a responseat concentrations of t
Figure 4. NMDA receptor activation increases the expression of Cns- 1 mRNA in cultured cerebellar cells. Cells from the early postnatal cerebellum were cultured for 24 hr in a chemically defined medium containing 5 mM KCl. Cultures were continued for an additional 24 hr in medium containing (+) 10 mM potassium chloride (KCI), 10 FM glycine (Gly), 20 PM 6-cyano-7-nitroquinoxaline-2,3-dione (CNQX), 100 PM amino-5-phosphonovaleric acid (APV), and/or 50 FM N-methyl-n-as-
partate (NMDA). A, RNA blot analysis using an Cns-I cDNA probe was accomplished as described in Figure 3 and Materials and Methods. The mean OD f SE from densitometric measurements of the autoradiographs of three separate blots is presented along with a representative autoradiographic image. The asterisks (*) indicate that these mean OD values are statistically different (P < 0.03) than the mean OD values for any of the other treatment conditions. B, The &s-I probe was removed from the blots and the blots were hybridized with an En-2 cDNA probe (refer to Materials and Methods). The mean OD f SE of the hybridization signals is presented along with the autoradiographic image from the same blot presented in A. C, Ethidium bromide staining of the RNA gel used for blot analysis to obtain the autoradiographic image presented in A and B.
1590
Bulleit
et al.
l
NMDA
Regulates
Expression
of POU
Gene
Cns-7
20 PM CNQX
100 /e&MAPV 50 ~,LMNMDA
Cns-1
SCIP/Tst-1
In
Hours
o
d
rl
N
v
UI
2
Ott-1
En-2
Cer-1 Figure 5. NMDA receptor activation does not affect the expression of several homeobox genetranscripts in cultured cerebellar cells, Cells from the early postnatal cerebellum were cultured for 24 hr in a chemically defined medium containing 5 mM KCl. Cultures were continued for an additional 24 hr in medium containing 10 mM KC1 and 10 WMglycine plus (+) 20 PM 6-cyano-7-nitroquinoxaline-2,3-dione (CNQX), 100 PM amino-Sphosphonovaleric acid (APJ’), and/or 50 PM N-methyl-D-aspartate (NA4LI.4). RNA blot analysis using an Cns-I cDNA probe was accomplished as described in Figure 3 and Materials and Methods. Probes to several other homeobox genes(En-2,Oct-1, SCIP/Tst-I, and Cer-I) were used for repeated rehybridization to the same blot (refer to Materials and Methods). NMDA as low as 10 PM, reaching a peak at 50-l 00 PM NMDA (Fig. 6A). The increase was also apparent in cells treated with NMDA in physiologic magnesium (5 mM) without added glycine (Fig. 7). High concentrations of KC1 (40 mM) also resulted in an increase in Cns-I transcript levels (Fig. 7). Treatment of cells with GABA, somatostatin, or basic fibroblast growth factor did not affect the level of Cm-1 RNA (Fig. 7) although cultured granule cells express functional receptors for all three of these ligands (Hatten et al., 1988; Bovolin et al., 1992; Gonzalez et al., 1992). An increase in the level of this mRNA was first apparent -2 hr after the start of NMDA treatment (Fig. 6B). The level of mRNA continued to increase up to 24 hr following NMDA treatment (Fig. 6B). This increase in the level of Cm-1 mRNA could be maintained for at least 5 d (Fig. 8). APV added after 4 d of NMDA treatment reduced the level of Cns- I mRNA to control levels over the next 24 hr of culture (Fig. 8). The above data suggest that the specific activation of the NMDA receptor results in an increase in the level of Cns- 1 mRNA and that the maintenance of this increased mRNA level requires that this receptor remain active. The results of experiments described above suggest that activation of NMDA receptors in cultures of early postnatal cerebellar cells result in a specific increase in the level of Cns-I
Figure 6. NMDA receptor activation regulates the expression of Cns-1 mRNA in a concentration- and time-dependent manner. Cells from the early postnatal cerebellum were cultured in a chemically defined medium containing 5 mM KCl. A, Cultures were continued for an additional 24 hr in medium containing 10 mM KC1 and 10 PM glycine plus O-200 PM N-methyl-D-aspartate (NMDA). & Cultures were continued for additional time (O-24 hr) in medium containing 10 mM KC1 and 10 PM glycine plus 50 PM NMDA. RNA blot analysis using an &s-I cDNA probe was accomplished as described in Figure 3 and Materials and Methods. mRNA. This increase in the steady state mRNA level could be the result of an increase in transcript synthesis or a decrease in transcript degradation. We measured the level of transcript synthesis using isolated nuclei from cultured cerebellar cells that had been treated with either APV or NMDA. A nuclear runoff transcription assay was used to measure the level of transcription from both the Cns-I and En-2 genes (Greenberg and Ziff, 1984). Nuclei isolated from cultured cells after 24 hr of treatment with NMDA exhibited a 1.6-fold increase in transcription from the Cm-1 gene when compared to nuclei of cells treated with APV (Fig. 9). These observations suggest that the NMDA induced change in Cns-I mRNA level is at least in part the result of an increase in the rate of transcription from the Cns-I gene. However, we cannot rule out that a change in the rate of transcript degradation is also partially involved in mediating this response since the increase in the level of transcription is not identical to the increase in the level of &s-I RNA. Calcium mediates the increase in the level of Cns- 1 RNA in response. to NMDA treatment The NMDA receptor is a ligand-gated ion channel that when opened allows cations to move across the cell membrane, including Ca2+. At physiologic Mg*+ concentrations there is a voltage-dependent Mg*+ block of the NMDA channel (Mayer et al., 1984). Depolarizing conditions release Mg2+ from the channel allowing Ca2+ to enter the cell. High Mg2+ concentrations will antagonize NMDA receptor activation by blocking the channel. Treatment of cultured cerebellar cells with high Mg*+ concentrations (4 mM) consistently reduced the increase in Cns-I mRNA in response to NMDA treatment (Fig. 10). Although higher concentrations of Mg2+ (8 mM) didn’t reduce the viability of cultured cells (Fig. 1 l), they did alter the mor-
The Journal
of Neuroscience,
March
1994,
14(3)
1591
40 mM KC1 Figure 7. Treatment of cultured cerebellar cells with both NMDA and high concentrations of KC1 results in an increase in the level of Cns-I mRNA. Cells from the early postnatal cerebellum were cultured for 24 hr in a chemically defined medium containing 5 mM KCl. Cultures were continued for an additional 24 hr in medium containing 5 mM potassium chloride (KC!) plus 10 PM y-aminobutyric acid (GABA), 10 pM somatostatin, 20 PM basic fibroblast growth factor (bFGF), 50 PM N-methylD-aspartate (NMDA) or 40 mM KCl. RNA blot analysis using an Cns-I cDNA probe was accomphshed as described in Figure 3 and Materials and Methods.
50 pM NMDA
20 pM bFGF 10 pM GABA 10 pM Somatostatin
Control phology of the cultures, appearing to reduce cell aggregation. Thus, we didn’t use higher concentration of Mg2+ in these experiments. The incomplete block by 4 mM Mg*+ may’ result from a reduced sensitivity of the NMDA receptor to MgZ+ in developing neurons (Bowe and Nadler, 1990; Morrisett et al., 1990). However, the observation that 4 mM Mg*+ could reduce the NMDA response suggests that an open NMDA receptor/ channel is required to induce the change in Cm-1 transcript levels. We also usedCa*+ chelators to determine if Ca*+ entry through the NMDA channel mediatesthe increasein the level of Cns- I RNA. Treatment of cells with 1.5 mM EGTA, a chelator of extracellular Ca2+, reduced the NMDA mediated increasein Cm-1 mRNA (Fig. 10). A membrane-permeantform of BAPTA (BAPTA acetoxymethyl ester)was usedasan intracellular chelator of Ca2+. Cells were pretreated for 2 hr with BAPTA and the BAPTA containing medium wasremoved before exposureto NMDA. Conversion of the BAPTA analogto the parent acid occurs inside the cell sequesteringit inside the cellular compartment. Treatment with thesecalcium chelators reduced the level of Cm-1 mRNA in responseto NMDA (Fig. 10). The level of En-2 RNA wasthe sameunder all thesetreatment conditions (data not shown). Thus, chelation of either extracellular and intracellular calcium reduced the responseof
Cns-1 5 mM KC1 50
100
I.IM NMDA /.hM APV
(5d) (5d) (Id)
Figure 8. The maintenance of an increase in Cns- 1 mRNA is dependent on the continued activation of the NMDA receptor. Cells from the early postnatal cerebellum were cultured for.5 d in a chemically defined medium containing (+) 5 mM potassium chloride (KCY), 5 mM KC1 plus 50 PM N-methyl-D-aspartate (NMDA), or 5 mM KC1 plus 50 PM NMDA in which 100 PM amino-5-phosphonovaleric acid (API”) was added for the last 24 hr. RNA blot analysis using an Cns-I cDNA probe was accomplished as described in Figure 3 and Materials and Methods.
thesecultured cells to NMDA. Only higher concentrations the chelator EGTA (2.5 mM) reduced cell viability in thesecultures (Fig. 11). All other culture treatments did not reduce cell viability when compared to control cultures (Fig. 11). Except for
g d ' i! "
0.8 0.6 0.4
P
O 0.2 10 10 100 50
mM KC1 PM Gly j&M APV j&M NMDA
+ + +
+ + +
Figure 9. NMDA receptor activation increases the synthesis of transcripts from the Cm-1 gene. Cells from the early postnatal cerebellum were cultured for 24 hr in a chemically defined medium containing 5 mM KCl. Cultures were continued for an additional 24 hr in medium containina (+) 10 mM notassium chloride (KU) and 10 UM alvcine (G/v) plus 100 i& amino-5-phosphonovaleric acid (Ah’), or 50 &N-methyl: D-aspartate (NMDA). Nuclei isolated from treated cells were used in a nuclear transcription runoff assay as described in Materials and Methods. RNA probes, synthesized from nuclei in vitro using 32P-UTP, were incubated with a Cns-1 cDNA, an En-2 cDNA, or control plasmid DNA (pGEM 11Z) that had been immobilized to nitrocellulose membranes. Densitometric measurements (OD) of probe hybridization signals were made from autoradiographs in three separate experiments. OD values for hybridization of probes to pGEMl1Z DNA were used as background and subtracted from OD values for hybridization to Cns-I cDNA and En-2 cDNA. The ratio of the OD measurement for Cns-I to the OD measurement for En-2 is presented as the mean + standard error.
1592
Bulleit
et al.
l
NMDA
Regulates
Expression
of POU
Gene
Cns-7
80
Cns-1
60
10 mM KC1 10 FM Gly 50 PM NMDA 4 mM Mg 1.5 mM EGTA 20
/.LM BAPTA
+ +
+ + +
+ + + +
+ + +
+ + +
+ +
Figure 10. Calcium chelators block the increase in expression of Cns- 1 mRNA in response to NMDA receptor activation. Cells from the early postnatal cerebellum were cultured for 24 hr in a chemically defined medium containing 5 mM KCl. Cultures were continued for an additional 2 hr in medium containing (+) 10 mM potassium chloride (KC/) and 10 PM glycine (Cry) plus 4 mM MgSO, (Mg), 1.5 mM ethylene glycolbis(&aminoethyl ether) N, N, N’, N’,-tetraace& acid (EGTA), or 20 PM 1.2-bis(2-aminonhenoxv)ethane-N.N, N! N’-tetraacetic acid (BAPTA) tetrakis(acetoxymethy1): Following the pretreatment with either ma& nesium or EGTA, 5b PM N-methyl-D-aspartate (NMDA) was added directly to the culture medium. Following BAPTA pretreatment, the BAPTA containing medium was removed and replaced with fresh medium, minus BAPTA, containing 50 PM NMDA. The cultures were the incubated for an additional 24 hr. RNA blot analysis using an Cns-I cDNA probe was accomplished as described in Figure 3 and Materials and Methods. treatment
with 8 mM Mg*+ and 2.5 mM EGTA, thesetreatment conditions also did not appear to affect morphology of cultures, asexamined under phase-contrastmicroscopy. Thus, cell death induce by the treatment conditions is not likely to account for the responseto NMDA or the antagonism of this responseby calcium chelators.
Discussion The amino acid sequenceof Cns-1 is similar to the sequenceof other POU/homeodomain proteins in the conservedPOU-specific domain and homeodomain. Relative amino acid sequence similarity between these proteins in these two conserved domains separatesthem into five classes(Rosenfeld, 1991). There is an 80-98% identity betweenmembersof an individual POU/ homeodomain protein class.Cns-1 is at most 57% identical to any other POU/homeodomain protein in these two domains. Thus, Cns-1 appearsto belongto a sixth and new classof POU/ homeodomainprotein. The POU-specific domain and the homeodomain are involved in sequencespecific DNA binding required for theseproteins to function astranscriptional activators (Sturm and Herr, 1988; Ingraham et al., 1990). Outside the POU-specific domain and homeodomain, there are no conserved regions between Cns-1 and other POU/homeodomain proteins. However, Cns-1 contains a region in the amino-terminal half that is similar in amino acid composition to regions in other POU/homeodomain proteins. This region is rich in serine, threonine, and proline residues(Fig. 1). Regionswith similar amino acid composition in Pit- 1 and Ott- 1 function as transcriptional activation domains(Theill et al., 1989;Ingraham et al., 1990; Tanaka and Herr, 1990).Thus, it is possible,given the sequenceand structural similarity of Cns-1 with other POU/ homeodomain proteins, that Cns-1 also functions as a tran-
Fgure II. Viability of postnatal cerebellar cells in culture. Cells from the early postnatal cerebellum were cultured for 24 hr in a chemically defined medium containing 5 mM KCI. Cultures were further incubated for 2 hr in medium containing 10 mM KC1 and 10 FM glycine. Some cultures also contained 4 or 8 mM MgSO, (Mg2+ ), 1.5 or 2.5 mM ethylene glycol-bis(&aminoethyl ether) N, N, N’,N’,-tetraacetic acid (EGTA), or 20 PM 1,2-bis(2-aminophenoxy)ethane-N, N, N’, N’-tetraacetic acid (BAPTA) tetrakis(acetoxymethy1). Except for cells treated with BAPTA, after the 2 hr pretreatment either 50 FM N-methyl-D-aspartate (NMDA) or 100 PM amino-5-phosphonovaleric acid (APV) was added directly to the culture medium. In the case of cells pretreated with BAPTA, the BAPTA-containing medium was removed and replaced with fresh medium, minus BAPTA, containing 50 PM NMDA. All cultures were the incubated for an additional 24 hr in the presence of NMDA or APV. Cell viability was measured using a trypan blue exclusion assay described in Materials and Methods. Six separate viability measurements were done on cells treated with each condition. The mean percentage of viable cell + standard error is presented for each treatment condition. The viability of cell treated in 2.5 mM EGTA was significantly reduced compared to cell under any other treatment condition (P < 0.01).
scriptional activator. However, further studiesare necessaryto determine definitively whether Cns-1 functions in this manner. POU/homeodomain and homeodomain proteins are important transcriptional regulators involved in controlling development and determining individual cellular phenotypes (Ingham, 1988; Rosenfeld, 1991; Ruvkun and Finney, 1991). As a memberof the POU/homeodomain protein family, Cns-1may function similarly in the CNS, a tissuewhere it is predominantly expressed(Fig. 3). We have observed that Cm-1 is expressed in reaggregatecultures of cells derived from the early postnatal cerebellum(Fig. 4). This in vitro preparation of CNS cells consistsprimarily of cerebellargranule cellsbut alsocontains other cerebellarcellular phenotypesincluding glia (Trenkner and Sidman, 1977; Trenkner,
199 1). Several aspects of cerebellar
gran-
ule neuron development may occur in thesereaggregatecultures, including cell division of granule neuron precursors(Gao et al., 199l), neurite extension, and granule neuron migration (Trenkner and Sidman, 1977). Cm-1 may be expressedin any of the
The Journal
cell types present in these culture and thus may be involved in determining their phenotype(s). Determination of what cell types express Cns-I must come from experiments to localize its expression within individual cells. We have made an interesting observation concerning expression of Cm-1 in the cerebellar reaggregate cultures. Treatment of these cultures with NMDA at concentrations greater than 10 PM results in an increase in the level of Cm-1 mRNA that is blocked by simultaneous treatment with APV, an NMDA receptor antagonist. We did not observe antagonism of this NMDA response by CNQX, an antagonist of non-NMDA glutamate receptors (Fig. 4A). Treatment of these cultures with APV alone consistently reduced the level of Cns-I mRNA. Although this was not statistically significant, it is possible that an endogenous activator of the NMDA receptor is present in these cultures. Since granule neurons are glutaminergic and can release glutamate under conditions of tissue culture, it is likely that this endogenous activator is glutamate (Gallo et al., 1982; Van Vliet et al., 1989). The addition of glycine, a coagonist at the NMDA receptor, might be expected to increase the level of Cns- I mRNA by potentiating the response of NMDA receptors to endogenous glutamate (Johnson and Ascher, 1987). However, we observed no significant change in the in the level of Cns-I mRNA in response to glycine. In cerebellar slice preparations from the early postnatal cerebellum, endogenous activity of the NMDA receptor on granule neurons is absent unless glycine is present (D’Angelo et al., 1990). Our reaggregate cultures respond to NMDA at physiologic concentration of KC1 (5 mM) even without added glycine (Fig. 7). These observations suggest that endogenously release glycine may also be present in these cultures. Variability in the level of Cns-I RNA under control conditions may be the result of variability in the amount of endogenous NMDA receptor agonists present in the cultures. Thus, cultures treated with APV may provide a more accurate measure of the basal level of expression of Cns-I RNA. At resting membrane potentials there is a voltage-dependent Mg*+ block of the NMDA channel (Mayer et al., 1984). Activation of the channel in the presence of an agonist is dependent on depolarization of the cell that removes the Mg 2+ block. At physiologic K+ our cultures responded to NMDA (Figs. 7, 8). This may be due to endogenous glutamate activating non-NMDA glutamate receptors or spontaneous depolarizing activity in the cell providing a depolarizing response to remove the Mg*+ block. Alternatively, this result may be due to a difference in the NMDA receptor’s Mg2+ sensitivity in developing neurons (Bowe and Nadler, 1990; Morrisett et al., 1990). The observation that CNQX did not affect the NMDA-induced increase in Cns- I RNA would suggest that activation of non-NMDA glutamate receptors was not involved in the response. The combined results of these pharmacologic experiments suggest that specific activation of the NMDA subtype of glutamate receptors in cultured cerebellar cells increases the level of Cns-I mRNA. Experiments using several other homeobox genes, En-2, Ott-I, SCIP/Tst-I, and (k-1, suggest that NMDA receptor activation has a relatively specific effect on the level of Cns-I mRNA. Three of these sequences, En-2, Ott- I, and SCIP/Tst- I, have been previously shown to be expressed in the cerebellum (Davis and Joyner, 1988; Davis et al., 1988; He et al., 1989). Excepting SCZP/TstI, NMDA receptor activation did not alter the level of mRNA encoded by these genes (Fig. 8). However, the response is not limited to the Cns-1 since the level of SCIP/Tst-I RNA also appears to increase in response to NMDA treatment.
of Neuroscience,
March
1994,
14(3)
1593
An increase in the level of Cns- I mRNA in response to NMDA was first apparent about 2-4 hr after NMDA treatment (Fig. 6B). The level of Cns-I mRNA reached a new steady state level after about 24 hr of NMDA treatment. This new level was maintained as long as the NMDA receptor remained active. A transcription assay also suggests that, at least in part, this increase in the level of Cns-I mRNA is the result of an increase in transcription from the Cns-I gene (Fig. 9). The timing of the response would suggest that the synthesis of new genes and their protein products may be require for new Cns- I gene expression. The immediate-early genes may be candidates for regulators of Cns-I expression. Many of these genes are transcription regulators whose expression rapidly increases in the CNS in response to a variety of signals, including NMDA receptor activation (Cole et al., 1989; Szekely et al., 1989; Morgan and Curran, 199 1). Further experiments will be required to test whether this interaction takes place. Changes in the level of expression of individual homeobox genes regulate various aspects of development and cellular differentiation (Akam, 1987; Scott and Carroll, 1987; Ingham, 1988). Similarly, the observed increase in Cns-1 expression may mediate developmental changes of cultured cerebellar cells in response to NMDA receptor activation (Pearce et al., 1987; Balazs et al., 1988a,b; Moran and Patel, 1989; Cox et al., 1990; Cambray-Deakin and Burgoyne, 1992). This increase in Cns-I expression may occur in granule cells that express functional NMDA receptors (Cull-Candy and Ogden, 1985; Sciancalepore et al., 1989; Cox et al., 1990) or alternatively, granule neuron activation by NMDA could secondarily modify Cns-I expression in other cell types, possibly glia. If the 2.8-3.3-fold increase in the level of Cns-I RNA is occurring in individual cells, is this change large enough to affect cellular differentiation? In Drosophila there are several studies that suggest there is a concentration dependence of homeodomain protein function. The homeodomain protein encoded by bicoid has a critical threshold concentration necessary to activate expression of a second developmental control gene hunchback (Driever and NtissleinVolhard, 1989; Struhl et al., 1989). As little as a twofold difference in the concentration of the bicoid protein will determine whether hunchback gene expression is on or off (Struhl et al., 1989). In two loss-of-function mutants the normal two copies of the homeobox genes Ultrabithorax or Sex combed reduced are replaced by only a single copy of the gene. These mutants develop abnormally with a partial transformation of larval segments (Lewis, 1963; Kaufman et al., 1980). In Drosophila, gene dosage usually determines the concentration of the gene’s product. Thus, as little as a twofold change in the level of expression of a homeodomain protein can initiate new gene expression, modifying cellular development and differentiation. Thus, it is possible that this increase in Cns- 1 mRNA level could also result in alterations in the differentiation of postnatal cerebellar cells in culture. However, it must first be demonstrated that the increase in Cns-I mRNA results in a comparable increase in the Cns-1 protein and that this increase in Cns-1 protein corresponds to a significant change in developmental gene expression. Both NMDA and depolarizing concentrations of KC1 have similar effects on the development and differentiation of cerebellar cells in culture (Gallo et al., 1987; Moran and Patel, 1989; Cox et al., 1990). The response to both these treatments occurs through calcium entry into the cells, either through the NMDA receptor/channel complex or through voltage-dependent L-type calcium channels (Gallo et al., 1987; Moran and Patel, 1989;
1594
Bulleit
et al. * NMDA
Regulates
Expression
of POU Gene
Cm-1
Cambray-Deakin and Burgoyne, 1992). Thus, changes in the concentration of intracellular calcium may be an important mechanism regulating cerebellar cell development and differentiation in vivo. We have observed that the increase in Cm-1 expression, in response to NMDA, is also dependent on calcium. Both extracellular and intracellular chelation of calcium reduced the increase in Cm-1 expression in response to NMDA (Fig. 10). This experiment might suggest that calcium entry through the NMDA channel is responsible for the increase in the level of Cm-1 expression. However, we can’t rule out that calcium released from intracellular stores is also involved in this response. We have tested the effect of several other agents on Cm-1 expression in these postnatal cerebellar cultures. Only NMDA and high concentrations of KC1 (40 mM) resulted in an increase in Cm-1 transcript levels. Treatment ofcells with GABA, somatostatin, or basic fibroblast growth factor did not affect the level of Cns-I RNA (Fig. 10) though cultured granule cells express functional receptors for all three of these ligands (Hatten et al., 1988; Bovolin et al., 1992; Gonzalez et al., 1992). An increase in the level of Cns- I mRNA in response to 40 mM KC1 is not blocked by the addition of APV (X. Lin, unpublished observation). This observation suggests that the response to KC1 is not do to K+-induced release of endogenous glutamate activating NMDA receptors. Thus, this response appears specific to NMDA receptor activation and KC1 depolarization, both of which allow calcium to enter cells. Changes in Cns- I expression may be part of the mechanism by which Calcium regulates differentiation and development of cultured cerebellar cells. Both NMDA receptor activation and changes in intracellular calcium can have important effects on development and plasticity in the CNS. Spontaneously active NMDA receptors are present in the early developing CNS (Blanton et al., 1990; Lo Turco et al., 199 1). Activity-dependent development of certain CNS neurons requires NMDA receptor activation (Kleinschmidt et al., 1987; Scherer and Udin, 1989; Cline and Constantine-Paton, 1990; Kalb and Hockfield, 1990; Simon et al., 1992). Changes in the intracellular concentration of calcium have been shown to play an important role in regulating neuronal differentiation and neuronal growth cone behavior (Mattson et al., 1988; Holliday and Spitzer, 1990; Kater and Mills, 1991). The observation that Cns-1 is expressed throughout the CNS suggests that NMDA receptor activation or changes in the intracellular calcium concentration may also modify its expression in other CNS cells. Thus, Cns-I could have several roles in regulating development and plasticity in the CNS. References LUU,,leltxlLklll”‘l “I txll”‘y”‘llc: Adler R, Hatlee M (1989) Pla retinal cells after terminal mitosis: Science 243:391-393. Akam M (1987) The molecular basis for metameric pattern in the Drosophila embryo. Development 10 1: l-22. Balazs R, Hack N, Jorgensen OS (1988a) Stimulation of the N-methylD-aspartate receptor has a trophic effect on differentiating cerebellar granule cells. Neurosci Lett 87:80-86. Balazs R, Jorgensen OS, Hack N (1988b) N-methyl-D-aspartate promotes the survival of cerebellar granule cell in culture. Neuroscience 27~437-451. Blanton MC, Lo Turco JJ, Kriegstein AR (1990) Endogenous neurotransmitter activates N-methyl-D-aspartate receptors on differentiating neurons in embryonic cortex. Proc Nat1 Acad Sci USA 87: 8rl71-m-40 Bovolin P, Santi MR, Puia G, Costa E, Grayson D (1992) Expression uattern of Y-aminobutvric acid tvne A receutor subunit mRNAs in primary cultures of granule neurons and astrocytes from neonatal rat cerebella. Proc Nat1 Acad Sci USA 89:9344-9348.
Bowe MA, Nadler JV (1990) Developmental increase in the sensitivity to magnesium of NMDA receptors on CA 1 hippocampal pyramidal cells. Dev Brain Res 5655-61. Cambray-Deakin MA, Burgoyne RD (1992) Intracellular Ca2+ and N-methyl-D-aspartate-stimulated neuritogenesis in rat cerebellar granule cell culture. Dev Brain Res 66:25-32. Chomczynski P, Sacchi N (1987) Single step method of RNA isolation by acid guanidinium thiocyanate-phenol-chloroform extraction. Anal Biochem 162: 156. Chou PY, Fasman CD (1978) Empirical predictions of protein conformation. Ann Rev Biochem 47:251-276. Cline HT (199 1) Activity-dependent plasticity in the visual system of frogs and fish. Trends Neurosci 14: 104-l 11. Cline HT, Constantine-Paton M (1990) NMDA receptor agonist and antagonists alter retinal ganglion cell arbor structure in the developing frog retinotectal projection. J Neurosci 10: 1197-l 2 16. Cole AJ, Saffen DW, Baraban JM (1989) Rapid increase of an immediate early gene messenger RNA in hippocampal neurons by synaptic NMDA receptor activation. Nature 340:474-476. Cox JA, Felder CC, Henneberry RC (1990) Differential expression of excitatory amino acid receptor subtypes in cultured cerebellar neurons. Neuron 4:941-947. Cull-Candy SC, Ogden DC (1985) Ion channels activated by L-glutamate and GABA in cultured cerebellar neurons of the rat. Proc R Sot Lond [Biol] 224:367-373. D’Angelo E, Rossi P, Garthwaite J (1990) Dual-component NMDA receptor currents at a single central synapse. Nature 346:467-470. Davis CA, Joyner AL (1988) Expression patterns of the homeoboxcontaining genes En- 1 and En-2 and the proto-oncogene Int-1 diverge during mouse development. Genes Dev 2: 1736-l 744. Davis CA, Noble-Topham SE, Rossant J, Joyner AL (1988) Expression of the homeobox-containing gene En-2 delineates a specific region of the developing mouse brain. Genes Dev 2:36 l-37 1. Doe CQ, Hiromi Y, Gehring WJ, Goodman CS (1988a) Expression and function of the segmentation gene Fushi Tarazu during Drosophila neurogenesis. Science 239: 170-l 75. Doe CQ, Smouse D, Goodman CS (1988b) Control of neuronal fate by the Drosophila segmentation gene even-skipped. Nature 333:376378. Driever W, Ntisslein-Volhard C (1989) The bicoid protein is a positive regulator of hunchback transcription in the early Drosophila embryo. Nature 337:138-143. Finney M, Ruvkun G, Horvitz RH (1988) The C. eleguns cell lineage and differentiation gene uric-86 encodes a protein with a homeodomain and extended similarity to transcription factors. Cell 55:757769. Gallo V, Ciotti MT, Coletti A, Aloisi F, Levi G (1982) Selective release of glutamate from cerebellar granule cells differentiating in culture. Proc Nat1 Acad Sci USA 79:79 19-7923. Gallo V, Kingsbury A, Balazs R, Jorgensen OS (1987) The role of depolarization in the survival and differentiation of cerebellar granule cells in culture. J Neurosci 7:2203-22 13. Gao W, Heintz N, Hatten ME (199 1) Cerebellar granule cell neurogenesis is regulated by cell-cell interactions in vitro. Neuron 6:841854. Gonzalez B, Leroux P, Lamacz M, Bodenant C, Balazs R, Vaudry H (1992) Somatostatin receptors are expressed by immature cerebellar granule cells: evi dence for a direct inhibitory effect of somatostatin on neuroblast activitv. Proc Nat1 Acad Sci USA 89:9627-963 1. Goulding MD, Chalepakis G, Deutsch U, Erselius JR, Gruss P (199 1) Pax-3, a novel murine DNA binding protein expressed during early neurogenesis. EMBO J 10: 1135-l 147. Greenberg ME, Ziff EB (1984) Stimulation of 3T3 cells induces transcription of the c&s proto-oncogene. Nature 3 11:433-438. Groudine M, Peretz M, Weintraub H (198 1) Transcriptional regulation of hemoglobin switching in chicken embryos. Mol Cell Biol3:28 l.Ton LF56. Hatten ME, Lynch M, Rydel RE, Sanchez J, Joseph-Silverstein J, Moscatelli D, Rifkin DB (1988) In vitro neurite extension by granule cells is dependent upon astroglial derived fibroblast growth factor. Dev Biol 125:280-289. He X, Rosenfeld MC (199 1) Mechanisms of complex transcriptional regulation: implications for brain development. Neuron 7: 183-l 96. He X, Treaty MN, Simmons DM, Ingraham HA, Swanson LW, Rosenfeld MC (1989) Expression of a large family of POU-domain
The Journal
regulatory genes in mammalian brain development. Nature 340:3542. Henikoff S (1984) Unidirectional digestion with exonuclease III creates targeted breakpoints for DNA sequencing. Gene 28:351. Holliday J, Spitzer NC (1990) Spontaneous calcium influx and its roles in differentiation of spinal neurons in culture. Dev Biol 14 1: 1323. Iacovitti L, Evinger MJ, Joh TH, Reis DJ (1989) A muscle-derived factor(s) induces expression of a catecholamine phenotype neurons in neurons of cultured rat cerebral cortex. J Neurosci 9:3529-3537. Ingham PW (1988) The molecular genetics of embryonic pattern formation in Drosophila. Nature 335:25-34. Ingraham HA, Flynn SE, Voss JW, Albert VR, Kapiloff MS, Wilson L, Rosenfeld MG (1990) The POU-specific domain of pit- 1 is essential for sequence-specific, high-affinity DNA binding and DNA-dependent pit-l-nit-l interactions. Cell 61:1021-1033. Johnson JW, kscher P (1987) Glycine potentiates the NMDA response in cultured brain neurons. Nature 325:529-53 1. Kalb RG. Hockfield S f 1990) Induction of a neuronal nroteonlvcan by the NMDA receptor in the developing spinal cord. Science 250: 294-296. Kalb RG, Lidow MS, Halsted MJ, Hockfield S (1992) N-methyl-naspartate receptors are transiently expressed in the developing spinal cord ventral horn. Proc Nat1 Acad Sci USA 89:8502-8506. Kater SB, Mills LR (1991) Regulation of growth cone behavior by calcium. J Neurosci 11:891-899. Kaufman TC, Lewis R, Wakimoto B (1980) Cytogenetic analysis of chromosome 3 in Drosophila melanogaster: the homeotic gene complex in polytene chromosomal interval 84A, B. Genetics 94: 115-l 33. Kessel M, Gruss P (1990) Murine developmental control genes. Science 249~374-379. Kessler JA (1986) Differential regulation of cholinergic and peptidergic development in the rat striatum in culture. Dev Biol 113:77-89. Kingsbury AE, Gallo V, Balazs R (1989) Culture of rat cerbellar intemeurons in chemically defined medium. In: A dissection and tissue culture manual of the nervous system (Shahar A, de Vellis J, Vernadakis A, Haber B, eds), pp 207-210 New York: Liss. Kleinschmidt A, Bear MF, Singer W (1987) Blockade of NMDA receptors disrupts experience-dependent plasticity of kitten striate cortex. Science 238:355-358. Komuro H, Rakic P (1992) Modulation of neuronal migration by NMDA receptors. Science 260:95-97. Kozak M (1986) Point mutations define a sequence flanking the AUG initiator codon that modulates translation by eukaryotic ribosomes. Cell 44:283-292. Kozak M (199 1) Structural features in eukaryotic mRNAs that modulate the initiation of translation. J Biol Chem 266:19867-19870. Le Moine C, Young WS III (1992) RHS2, a POU domain-containing gene, and its expression in developing and adult rat. Proc Nat1 Acad Sci USA 89:3285-3289. Lewis EB (1963) Genes and developmental pathways. Am Zoo1 3:3356. Lipton SA, Kater SB (1989) Neurotransmitter regulation of neuronal outgrowth, plasticity and survival. Trends Neurosci 12:265-270. Lo Turco JL, Blanton MG, Kriegstein AR (199 1) Initial expression and endogenous activation of NMDA channels in early neocortical development. J Neurosci 11:792-799. Luskin MB, Pearlman AL, Sanes JR (1988) Cell lineage in the cerebral cortex of the mouse studied in vivo and in vitro with a recombinant retrovirus. Neuron 1:635-647. Mattson M, Dou P, Kater SB (1988) Outgrowth-regulation action of glutamate in isolated hippocampal pyramidal neurons. J Neurosci 8:2087-2100. Mayer ML, Westbrook GL, Guthrie PB (1984) Voltage-dependent block by Mgz+ of NMDA responses in spinal cord neurons. Nature 309:261-263. McConnell SK, Kaznowski CE (199 1) Cell cycle dependence of laminar determination in developing neocortex. Science 254:282-285. Messer A (1989) Cell-specific enrichment of primary monolayer culture of postnatal rodent cerebellum. In: A dissection and tissue culture manual of the nervous system (Shahar A, de Vellis J, Vemadakis A, Haber B, eds), pp 195-l 97. New York: Liss. Monuki ES, Weinmaster G, Kuhn R, Lemke G (1989) SCIP: a glial POU domain gene regulated by cyclic AMP. Neuron 3:783-793. Moran J, Pate1 AJ (1989) Stimulation of the N-methyl-o-aspartate
of Neuroscience,
March
1994,
74(3)
1595
receptor promotes the biochemical differentiation of cerbellar granule neurons and not astrocytes. Brain Res 486: 15-25 Morgan JI, Curran T (1991) Stimulus-transcription coupling in the nervous system: involvement of the inducible proto-oncogenes fos and jun. Annu Rev Neurosci 14:42 l-45 1. Morrisett RA, Mott DD, Lewis DV, Wilson WA, Swartzwelder HS (1990) Reduced sensitivity of the N-methyl-D-aspartate component of synaptic transmission to magnesium in hippocampal slices from immature rats. Dev Brain Res 56:257-262. -Odenwald WF. Tavlor CF. Palmer-Hill FJ. Friedrich V. Tani M. Lazzarini RA (1987) Expression of a homeodomain protein in noncontact-inhibited cultured cells and postmitotic neurons. Genes Dev 1:482-496. Pearce IA, Cambray-Deakin MA, Burgoyne RD (1987) Glutamate acting on NMDA receptors stimulates neurite outgrowth from cerebellar granule cells. FEBS Lett 223:143-147. Porteus MH, Bulfone A, Ciaranello RD, Rubenstein JLR (199 1) Isolation and characterization of a novel cDNA encoding a homeodomain that is developmentally regulated in the ventral forebrain. Neuron 71221-229. Price M, Lazzaro D, Pohl T, Mattei M-G, Riither U, Olivo J-C, Duboule D, Di Lauro R (1992) Regional expression of the homeobox gene Nkx-2.2 in the develonina mammalian forebrain. Neuron 8:241-255. Rosenfeld MG (199 1) -P&J-domain transcription factors: pou-er-ful developmental regulators. Gene Dev 5:897-907. Ruvkun G, Finney M (199 1) Regulation of transcription and cell identity by domain proteins. Cell 64:475-478. Sambrook J, Fritsch EF, Maniatis T (1989) Molecular cloning, 2d ed. Cold Spring Harbor, NY: Cold Spring Harbor Laboratory. Sanger F, Nicklen S, Coulson AR (1977) DNA sequencing with chain terminating inhibitors. Proc Nat1 Acad Sci USA 74:5463-5467. Scherer WJ, Udin SB (1989) N-methvl-D-aSDam& antaeonists ore_ _ vent interactions of binocular maps in Xenopus tectum. J Neurosci 9:3837-3843. Sciancalepore M, Forti L, Moran 0 (1989) Changes of N-methyl-oaspartate activated channels of cerebellar granule cells with days in culture. Biochem Biophys Res Commun 165:48 11187. Scott MP, Carroll SB (1987) The segmentation and homeotic gene network in early Drosophila development. Cell 51:689-698. Simon DK, Prusky GT, O’Leary DM, Constantine-Paton M (1992) N-methyl-D-aspartate receptor antagonists disrupt the formation of a mammalian neural man. Proc Nat1 Acad Sci USA 89: 10593-10597. Struhl G, Struhl K, Macdonald PM (1989) The gradient morphogen bicoid is a concentration-dependent transcriptional activator. Cell 57: 1259-1273. Sturm RA, Herr W (1988) The POU domain is a bipartite DNAbinding structure. Nature 336:601-604. Szekely AM, Barbaccia ML, Alho H, Costa E (1989) In primary cultures of cerebellar granule cells the activation of N-methyl-o-aspartate-sensitive glutamate receptors induces c-fos mRNA expression. Mol Pharm 35:401-408. Tanaka M, Herr W (1990) Differential transcriptional activation by Ott-1 and Ott-2: interdependent activation domains induce Ott-2 phosphorylation. Cell 60:375-386. Theill LE, Castrillo J-L, Wu D, Karin M (1989) Dissection of functional domains of the pituitary-specific transcription factor GHF- 1. Nature 342:945-948. Trenkner E (199 1) Cerebellar cells in culture. In: Culturing nerve cells (Banker G, Goslin K, eds), pp 283-307. Cambridge, MA: MIT Press. Trenkner E, Sidman RL (1977) Histogenesis of mouse cerebellum in microwell culture: cell reaggregation and migration, fiber and synapse formation. J Cell Biol 75:9 15-940. Turner DL, Cepko CL (1987) A common progenitor for neurons and glia persists in rat retina late in development. Nature 328: 13 l-l 36. Van Vliet BJ, Sebben M, Dumuis A, Gabrion J, Bockaert J, Pin J-P (1989) Endogenous amino acid release from cultured cerebellar neuronal cells: effect of tetanus toxin on glutamate release. J Neurochem 5211229-1239. Walsh C, Cepko CL (1992) Widespread dispersion of neuronal clones across functional regions of the cerebral cortex. Science 255:434-440. Way JC, Chalfie M (1989) The met-3 gene of Caenorhabditis elegans requires its own product for maintained expression and is expressed in three neuronal cell types. Gene Dev 3: 1823-1833. Wetts R, Fraser SE (1988) Multipotent precursors can give rise to all major cell types of the frog retina. Science 239: 1142-l 145. I
~
/